2 What Is a Theory?
A regional grocery chain notices that its best-performing stores employ more staff per square metre than its worst-performing stores. The operations team proposes adding staff everywhere. The finance team objects: perhaps busy stores were given more staff because they were already busy. A third executive suggests that the real driver is the store manager: good managers both hire well and sell more. A fourth points out that the comparison mixes urban and rural stores, which differ in almost everything. Four people, one correlation, four different accounts of what causes what and why. Each account is a theory, and the decision the chain makes will depend on which theory it acts on.
This chapter is about what such accounts are, what distinguishes a good one from a bad one, and how scholars and practitioners can tell the difference. We begin with what theory is, and, just as importantly, what it is not. We then take theories apart into their building blocks (constructs, relationships, mechanisms, and boundary conditions), distinguish types of theory, set out the criteria by which theories are judged, examine the levels of analysis at which theories operate, and close with how theories change over time. Along the way we argue a simple thesis: managers do not choose between “theory” and “practice”. They choose between theories that are explicit, tested, and bounded and theories that are implicit, untested, and unbounded (Table 2.1).
| Concept | Core question | Key sources |
|---|---|---|
| What theory is (and is not) | What separates a theory from data, lists, diagrams, or hypotheses? | Sutton & Staw (1995), Weick (1995), DiMaggio (1995) |
| Building blocks | What, how, why, and who/where/when? | Whetten (1989), Bacharach (1989), Dubin (1978) |
| Mechanisms | Through what process does a cause produce its effect? | Hedstrom & Swedberg (1998), Coleman (1990) |
| Types of theory | Does the theory analyse, explain, predict, or prescribe? | Merton (1968), Gregor (2006) |
| Criteria for good theory | Is it falsifiable, useful, parsimonious, general, and interesting? | Popper (1959), Davis (1971), Corley & Gioia (2011) |
| Levels of analysis | At what level do constructs live, and can findings cross levels? | Rousseau (1985), Klein, Dansereau & Hall (1994) |
| Theory change | How do theories and paradigms rise and fall? | Kuhn (1962), Lakatos (1970) |
2.1 Why Theory Matters
The word theory suffers in everyday speech. “That’s just a theory” suggests speculation. “In theory, yes, but in practice …” suggests irrelevance. In the sciences the word means something closer to the opposite: a theory is the most disciplined form of understanding available, an account that has been stated precisely enough to be checked and has survived attempts to show it wrong.
Definition 2.1 Theory. A coherent set of statements about the relationships among constructs, together with an explanation of why those relationships hold and a specification of the conditions under which they are expected to hold. In Bacharach’s formulation, a theory is a system of constructs and variables in which constructs are related by propositions and variables by hypotheses, the whole bounded by the theorist’s assumptions (Bacharach 1989). In everyday managerial language, Christensen and Raynor (2003) offer a compact equivalent: a theory is a statement of what causes what, and why.
2.1.1 Managers run on implicit theories
Every managerial decision embeds a causal claim. A sales incentive presumes that pay shapes effort. A rebrand presumes that perceptions drive choice. A reorganization presumes that structure shapes coordination. McGregor (1960) made the point vividly half a century ago: managers who assume that people dislike work and must be controlled (“Theory X”) design very different organizations from managers who assume that people seek responsibility under the right conditions (“Theory Y”). Neither manager thinks of himself or herself as a theorist, yet each acts on a theory of human motivation, and each theory tends to produce the behaviour it predicts.
Christensen and Raynor (2003) argue that executives should care about management theory precisely because they cannot avoid using it. Their critique targets the “best-practice” habit: copying what successful firms do without understanding the circumstances in which those practices work. Early attempts at human flight, they observe, imitated the attributes of birds, feathers and flapping wings, rather than the underlying mechanism of lift. Management advice built on attributes (“successful companies have flat structures”) fails in the same way when it is transplanted to circumstances where the mechanism does not operate. Good theory, in their account, progresses from describing phenomena, to sorting them into categories defined by circumstances rather than surface attributes, to stating causal relationships that hold within each category, and it improves fastest when someone finds an anomaly the existing theory cannot explain.
2.1.2 Evidence-based management
The evidence-based management movement makes the same argument from a different direction. Rousseau (2006) defines it as translating principles based on the best available evidence into organizational practice, and contrasts it with decisions grounded in personal preference, imitation, and unsystematic experience. Pfeffer and Sutton (2006) document how often popular management practices, forced ranking, merger strategies, pay schemes, are adopted on the strength of anecdote or fashion rather than evidence. Evidence-based management is not anti-theoretical. It depends on theory to tell managers which evidence is relevant to their circumstances and why a finding from one setting should (or should not) generalize to another.
Open-plan offices and the theory of collaboration. Many firms moved to open-plan offices on the strength of an implicit theory: removing walls increases chance encounters, encounters increase face-to-face interaction, and interaction improves collaboration. Bernstein and Turban (2018) tested the second link directly. Using wearable sensors and electronic communication records in two corporate headquarters that switched to open-plan layouts, they found that face-to-face interaction fell sharply after the change while email and messaging rose. A plausible mechanism is that employees seek privacy when visual exposure increases. The case illustrates a general lesson: an intuitively appealing causal chain is a theory, and like any theory it can be wrong in one link even when the other links are plausible.
2.2 What Theory Is Not
A useful way to understand theory is through its imitations. In a widely cited editorial essay, R. I. Sutton and Staw (1995) identified five things that are often presented as theory in management manuscripts but are not, on their own, theory. Each is a legitimate part of a theoretical argument. None can substitute for it (Table 2.2).
| Not theory on its own | Why it falls short | What turns it into theory |
|---|---|---|
| References | Citing prior work signals which literature a paper belongs to but does not explain anything | State the logic the cited work supplies and how it applies here |
| Data | Data describe which patterns were observed, not why they arose | Explain the process that generated the pattern |
| Lists of variables or constructs | Naming predictors says what matters, not how or why | Specify relationships and the mechanism linking them |
| Diagrams | Boxes and arrows show structure but rarely the reasoning behind each arrow | Accompany each arrow with an explicit causal argument |
| Hypotheses or predictions | Hypotheses state what is expected, not why | Derive hypotheses from the underlying logic and its assumptions |
The common thread is the missing why. A paper can be well referenced, rich in data, and full of diagrams and hypotheses, yet still fail to tell the reader the causal process that connects one construct to another, or why that process should operate in some settings but not others. Strong theory, in Sutton and Staw’s account, delves into underlying processes, explores the connections among phenomena, and tells a story about why acts, events, structures, and thoughts occur.
Theory as product or as process? Sutton and Staw’s essay prompted two influential replies in the same issue of Administrative Science Quarterly. Weick (1995b) argued that theory is better seen as a continuum than as a binary: references, data, lists, diagrams, and hypotheses are often the visible traces of theorizing, an ongoing process whose products are approximations. Judging only finished theory, he warned, may discourage the interim work from which theory grows. DiMaggio (1995) distinguished three conceptions of theory, theory as covering laws (general statements that subsume particulars), theory as enlightenment (a way of seeing that reveals what was hidden), and theory as narrative (an account of how a process unfolds), and argued that the most valuable theories combine elements of all three. The exchange remains a useful reminder that standards for theory depend partly on the stage of a research programme. Weick’s earlier essay describes theory construction itself as “disciplined imagination”: generating many conjectures and selecting among them with explicit criteria (Weick 1989).
2.3 The Building Blocks of Theory
If theory is not a list, a diagram, or a hypothesis, what is it made of? The most widely used answer in management comes from Whetten (1989), who proposed that a complete theory answers four questions. Earlier, Dubin (1978) had laid out a similar architecture of units, laws of interaction, boundaries, and system states, and Bacharach (1989) sharpened the distinction between the abstract and the observable parts of a theory.
2.3.1 What, how, why, and who/where/when
Table 2.3 presents the whetten’s (1989) four elements of a complete theory, illustrated with resource-based theory (Section 4.1) (Wernerfelt, 1984, Barney, 1991).
| Element | Question | What it supplies | Illustration: resource-based theory |
|---|---|---|---|
| What | Which factors (constructs) logically belong in the explanation? | Comprehensiveness balanced against parsimony | Firm resources and capabilities, competitive advantage |
| How | How are the factors related? | Direction, form, and often causality of relationships | Resources that are valuable, rare, and costly to imitate lead to sustained advantage |
| Why | What psychological, economic, or social dynamics justify the relationships? | The mechanism, the theory’s explanatory core | Imperfect imitability (causal ambiguity, path dependence, social complexity) blocks competitive erosion |
| Who / where / when | To which actors, settings, and times does the theory apply? | Boundary conditions, limits of generalizability | Markets with resource heterogeneity and imperfect factor mobility. Advantage can erode when environments shift |
Whetten placed particular weight on the why. The what and how together describe a theory’s domain, they could be read off a diagram, but the why supplies the reasons a reader should believe the diagram, and it is the element reviewers most often find missing. Resource-based theory illustrates the four elements well: Wernerfelt (1984) and Jay Barney (1991) identify the constructs (resources and competitive advantage), the relationship (certain resources produce sustained advantage), the mechanism (imitation is blocked), and the conditions (resource heterogeneity and immobility). Later work refined each element (J. Barney and A. Arikan 2001, J. B. Barney, Ketchen, and Wright 2011, Kozlenkova, Samaha, and Palmatier 2013), a pattern typical of productive theories.
2.3.2 Constructs and variables
Definition 2.2 Construct. An abstract concept, deliberately invented or adopted for a scientific purpose, that cannot be observed directly (e.g., trust, brand equity, absorptive capacity (Section 5.2)). Variable. An observable, measurable operationalization of a construct (e.g., a five-item trust scale, a price premium, R&D intensity). Measure. The concrete instrument or data source that produces values of the variable.
Bacharach’s distinction between the two levels of a theory is essential for reading and writing research (Bacharach 1989). Constructs are related to one another by propositions. Variables are related to one another by hypotheses. A proposition (“customer trust increases loyalty”) is a claim about the world at the level of concepts. A hypothesis (“respondents’ scores on the trust scale predict repurchase within twelve months”) is a claim about measured data. Because the link from construct to variable is never perfect, every empirical test is simultaneously a test of the theory and of the measurement assumptions: a point that returns in Chapter 3 under the heading of construct validity.
Suddaby (2010) argues that many theories in management suffer from poor construct clarity: constructs are defined loosely, overlap with neighbouring constructs, or shift meaning across studies. Clear constructs have precise definitions, a stated scope (the conditions under which the construct applies), explicit relationships to other constructs, and coherence with the theory’s broader logic. Table 2.4 illustrates the ladder from construct to measure across business functions.
| Function | Construct | Variable | Example measure |
|---|---|---|---|
| Marketing | Brand equity | Price premium over a private-label equivalent | Scanner-panel prices for matched products |
| Strategy | Absorptive capacity | R&D intensity, prior related knowledge | R&D spend divided by sales |
| HR / OB | Psychological safety | Team members’ perception that interpersonal risk is safe | Multi-item survey scale aggregated to the team |
| Finance | Information asymmetry | Dispersion of analysts’ earnings forecasts | Standard deviation of forecasts for a firm-year |
| Operations | Process flexibility | Number of products a plant can switch among | Plant-level product-assignment records |
| Information systems | Perceived usefulness | User beliefs that a system improves performance | Validated survey items |
2.3.3 Propositions, hypotheses, and assumptions
Propositions and hypotheses differ in abstraction, not in importance. A theory paper may advance only propositions. An empirical paper translates them into hypotheses that a particular dataset can test. Both rest on assumptions: statements the theorist takes as given rather than tests. Bacharach (1989) emphasizes that the theorist’s implicit values and the spatial and temporal bounds of a theory are among its most consequential assumptions. Agency theory (Section 6.1), for instance, assumes self-interested agents and goal conflict. Stewardship theory relaxes the first assumption and therefore predicts different governance arrangements (see Agency theory (Section 6.1) and Stewardship theory (Section 6.2)).
Figure 2.1 assembles these building blocks into one picture, using a signaling example developed fully in Chapter 8. The upper row is the theory proper. The lower row is its empirical shadow.
Figure 2.1: The anatomy of a theory. Constructs (upper row) are linked by propositions and a mechanism. Boundary conditions moderate the mechanism. Each construct is operationalized by a measured variable (lower row), and variables are linked by testable hypotheses. Example drawn from signaling theory (Spence, 1973, Connelly et al., 2011).
2.3.4 Mechanisms: opening the black box
A theory that says X leads to Y without saying how is a black-box theory. A mechanism is the set of entities and activities, organized in a particular way, that brings about the effect (Hedström and Swedberg 1998). Mechanism-based explanation became a programme in analytical sociology because correlations between macro variables, religion and economic development, inequality and crime, firm size and innovation, say little about the processes that generate them. Specifying the mechanism makes a theory more credible (because the process is plausible), more testable (because intermediate steps can be measured), and more useful (because managers can intervene on the process itself).
Core claim. Macro-level associations should be explained by showing how macro conditions shape individual situations, how individuals act in those situations, and how individual actions aggregate into macro outcomes.
Origins. Sociology. Coleman (1990), reconstructing Max Weber’s argument linking Protestant religious doctrine to the rise of capitalism. Elaborated as a typology of social mechanisms by Hedström and Swedberg (1998).
Level of analysis. Explicitly multi-level: macro (society, market, organization) and micro (individual).
Key constructs. Situational mechanism (macro to micro), action-formation mechanism (micro to micro), transformational mechanism (micro to macro).
Boundary conditions. Most useful when the outcome of interest is a collective property produced by many individual actions. Less informative for purely individual-level phenomena.
Related theories. Social exchange theory (Section 9.1), Institutional theory (Section 7.2), Wisdom of the crowd (Section 30.5).
Coleman’s diagram, often called Coleman’s boat or the “bathtub”, is redrawn in Figure 2.2. The dashed line across the top is the observed macro association. Coleman argued that this line is not itself an explanation. The explanation runs down, across, and back up. Hedström and Swedberg label the three arrows the situational, action-formation, and transformational mechanisms (Hedström and Swedberg 1998).
Figure 2.2: Coleman’s boat: a macro association (dashed) is explained by a situational mechanism (macro to micro), an action-formation mechanism (micro to micro), and a transformational mechanism (micro to macro). Labels follow Weber’s Protestant-ethic example as reconstructed by Coleman (1990) and the typology of Hedstrom and Swedberg (1998).
Illustrative scenario: forced ranking and collaboration. A firm adopts a forced-distribution appraisal system (a macro, organization-level policy). The macro association the board observes a year later is lower cross-unit collaboration. Coleman’s boat structures the explanation. Situational mechanism: the policy turns colleagues into competitors for a fixed number of top ratings, changing how each employee perceives the payoff to helping others. Action-formation mechanism: employees who believe that helping a peer may cost them a rating rationally help less and share knowledge more selectively. Transformational mechanism: many such individual choices aggregate into thin cross-unit networks and slower knowledge flows. Each arrow suggests a different intervention: redesign the policy, change the individual payoff (e.g., reward helping explicitly), or build structures that make collaboration less dependent on discretionary effort.
2.3.5 Boundary conditions
No theory holds everywhere. Boundary conditions specify the actors, settings, and times for which a theory’s relationships are expected to hold: Whetten’s who, where, and when (Whetten 1989). In empirical work, boundary conditions are often represented as moderators: variables that change the strength or direction of a relationship. Stating boundary conditions is not an admission of weakness. A theory that claims to hold everywhere is either trivially true or unfalsifiable. A theory that states where it stops is both more credible and more useful, because it tells a manager when not to rely on it.
Figure 2.3 shows the logic for the signaling example. Warranty generosity should matter a great deal when buyers know little about a seller (a new entrant) and much less when buyers already have abundant information (an established brand), because the warranty’s signal value depends on the information gap it closes.
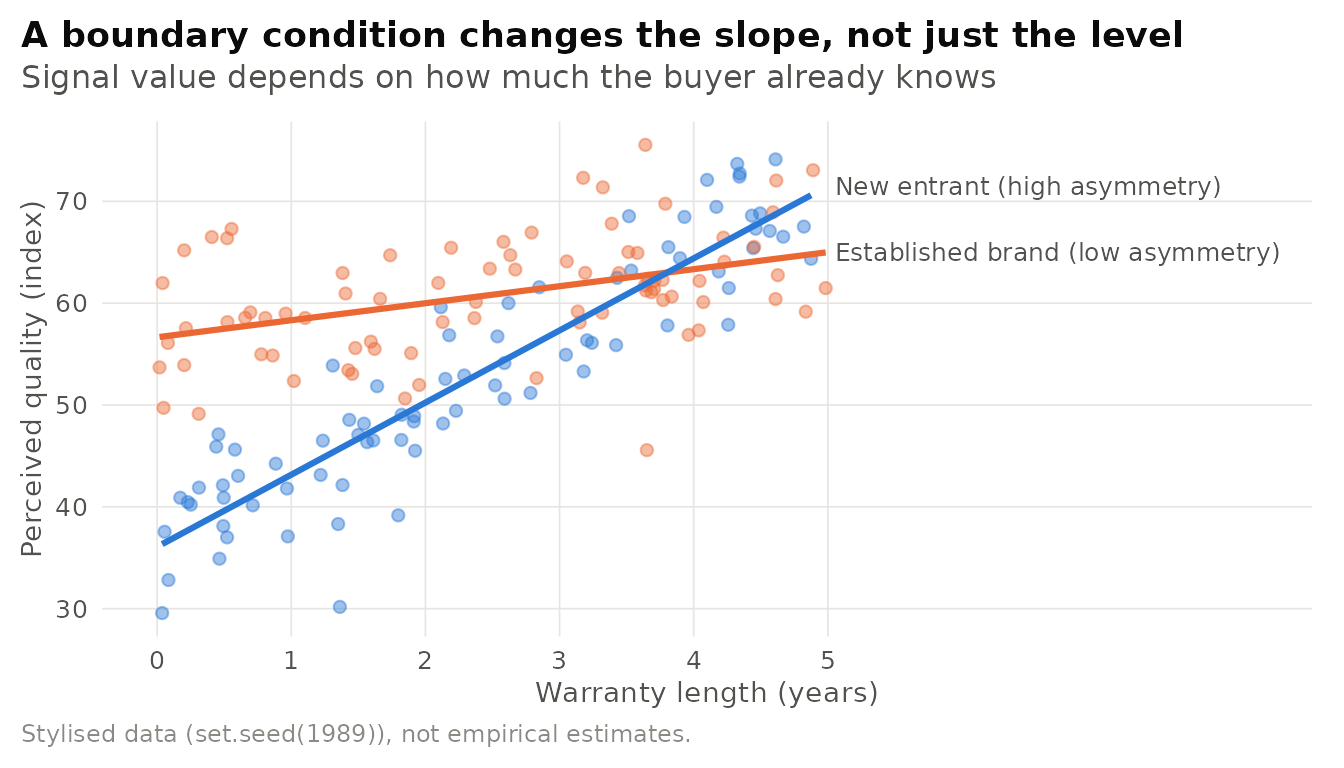
Figure 2.3: Illustrative boundary condition. The effect of warranty length on perceived quality is steep when information asymmetry is high (new entrant) and nearly flat when it is low (established brand). Stylised simulated data, lines are least-squares fits.
2.3.6 Variance and process theories
Most of the theories discussed so far take the form of variance theories: they explain variation in an outcome by variation in its antecedents (“the more X, the more Y, under condition Z”). Mohr (1982) contrasted variance theories with process theories, which explain an outcome as the result of a sequence of events unfolding over time, where the order and timing of events matter and the necessary conditions need not be sufficient. A variance theory of mergers might relate acquirer experience to post-merger performance. A process theory would describe how integration teams, early decisions about systems and leadership, and emerging conflicts sequence into success or failure.
The two forms answer different questions and call for different evidence. Variance theories are naturally tested with cross-sectional or panel regressions and experiments. Process theories are built and tested with longitudinal case studies, event-sequence data, and narrative analysis. Langley (1999) reviews strategies for theorizing from process data, from narrative and visual mapping to temporal bracketing and quantification of events. For managers, the distinction is practical: a variance theory says which levers matter. A process theory says when and in what order to pull them. Many business failures, a sound strategy launched before the organization could absorb it, a pricing change introduced before customers understood the value proposition, are failures of sequencing that a variance theory cannot see.
Boxes and arrows without a why. The most common weakness in theory sections is a model diagram whose arrows are justified only by citations (“prior research has found that X affects Y”). A citation shows that a relationship has been observed. It does not explain it. For every arrow, write one or two sentences stating the mechanism and one sentence stating when the mechanism should weaken. If you cannot, the arrow is an empirical conjecture, not theory.
Pick a management idea you have encountered recently: “remote work lowers innovation”, “subscriptions increase customer lifetime value (Section 28.4)”, “diverse boards improve decisions”. Write it out using Whetten’s four elements: list the constructs (what), state the relationship (how), specify the mechanism (why), and name at least two boundary conditions (who, where, when). Then sketch it as a Coleman boat: which arrows are situational, action-formation, and transformational?
2.4 Types of Theory
Theories differ not only in content but in ambition and purpose. Two distinctions are especially useful: scope (grand versus middle-range) and goal (explanation versus prediction, among others).
2.4.1 Grand theory and theories of the middle range
Merton (1968a) argued that sociology had been caught between two unproductive poles: the minor working hypotheses of everyday research, which accumulate without integration, and all-inclusive systematic theories that attempt to explain all social behaviour and are too abstract to be tested. Between them he advocated theories of the middle range: theories limited to a delimited class of phenomena, abstract enough to generalize across settings but concrete enough to yield testable propositions. His own examples included reference group theory and the theory of role-sets.
Most of the theories in this book are middle-range in Merton’s sense. Signaling theory does not try to explain all of economic life, only how informed parties reveal hidden quality. Optimal distinctiveness theory (Section 22.3) does not explain all of identity, only the tension between assimilation and differentiation (Brewer 1991). The middle range is where theory is most easily tested, accumulated, and applied, and where most business research operates.
2.4.2 Gregor’s taxonomy of theory types
Writing for information systems, Gregor (2006) proposed a taxonomy that applies well beyond that field. It distinguishes theories by their primary goal (Table 2.5).
| Type | Primary goal | What it offers | Business illustration |
|---|---|---|---|
| I. Analysis | Describe and classify | Taxonomies, typologies, frameworks | Porter’s generic strategies, Hofstede’s cultural dimensions |
|
Explain how and why, without precise prediction | Causal accounts and mechanisms | Case-based accounts of why incumbents miss disruptive technologies |
|
Forecast outcomes without necessarily explaining them | Accurate forecasts, black-box models | Machine-learning churn or demand forecasts |
|
Explain and predict | Testable causal propositions | Signaling theory, prospect theory, goal-setting theory |
| V. Design and action | Prescribe how to do something | Methods, design principles, interventions | A/B testing protocols, incentive-design principles |
The distinction between types II and III deserves emphasis. A model can predict well without explaining anything: a demand-forecasting algorithm may exploit weather, search trends, and calendar effects with no account of why consumers behave as they do. Conversely, a theory can explain well and predict poorly, as in evolutionary accounts of industries. Shmueli (2010) shows that explanatory and predictive modelling call for different choices about variables, model complexity, and evaluation. Business analytics increasingly mixes the two, which makes it important to be explicit about which one a given analysis is attempting.
Figure 2.4 crosses scope with goal to place some familiar theories. Placement is a matter of judgement, not measurement. The point is that “theory” spans a wide range of ambitions.
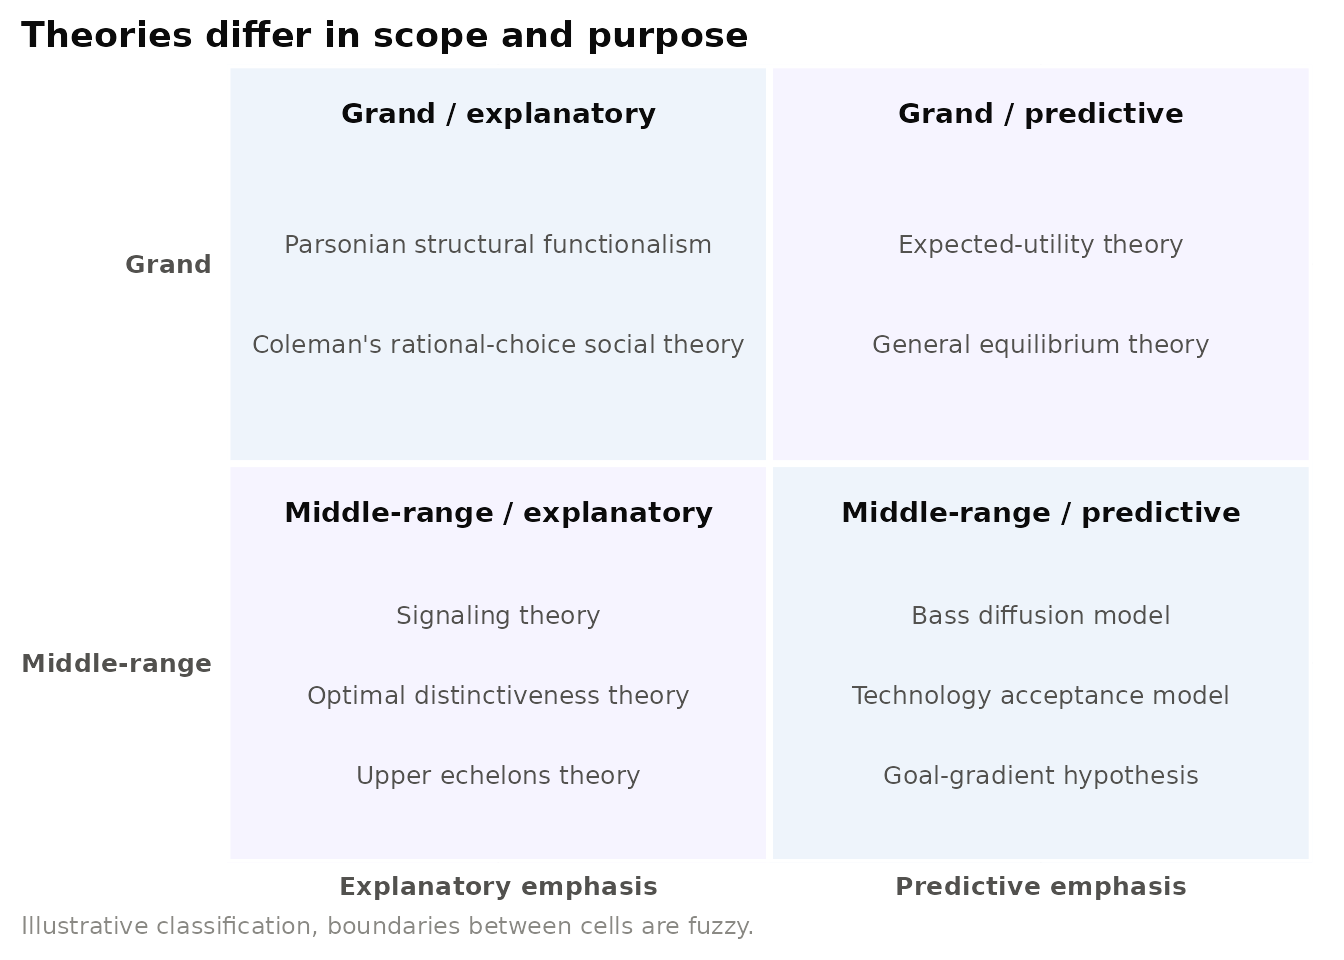
Figure 2.4: A stylised map of theories by scope (grand vs. middle-range. Merton, 1968) and primary goal (explanatory vs. predictive emphasis. Gregor, 2006). Placements are the author’s illustrative judgements, not measurements.
Prediction without explanation in customer analytics. A subscription business can build a churn model that identifies at-risk customers with impressive accuracy using hundreds of behavioural features. The model is a type III theory: it predicts but does not explain. Problems arise when managers treat its predictors as levers. If “number of support tickets” predicts churn, it does not follow that suppressing tickets reduces churn: tickets may simply reveal dissatisfaction that has other causes. An explanatory theory (for example, that churn results from unmet expectations formed at sign-up) suggests different interventions and different tests. Mature analytics teams therefore pair predictive models, which target whom to act on, with explanatory theory and experiments, which determine what action works.
2.5 What Makes a Theory Good?
If theories differ in type and scope, by what standards should they be judged? Philosophers of science and management scholars have converged on a set of criteria that pull in somewhat different directions.
2.5.1 Falsifiability
Popper (1959) proposed that the line between science and non-science is falsifiability: a scientific theory must prohibit some observable states of affairs, so that observing them would count against it. A theory compatible with every possible outcome explains nothing. Bacharach (1989) applies the criterion to organizational theory: constructs must be defined clearly enough, and relationships stated precisely enough, that empirical refutation is possible. Vague constructs, tautological propositions (“successful firms have the capabilities needed for success”), and post hoc boundary conditions all undermine falsifiability.
2.5.2 Utility: explanation and prediction
Bacharach’s second criterion is utility, which he splits into explanatory potential (does the theory explain the relationships it addresses, through clearly specified constructs and mechanisms?) and predictive adequacy (does it anticipate outcomes beyond the observations from which it was built?) (Bacharach 1989). A theory that merely redescribes its own data has low utility even if it is technically falsifiable.
2.5.3 Parsimony, generality, and accuracy
A good theory explains much with little. Parsimony favours theories with fewer constructs and assumptions, other things equal. Generality (or scope) favours theories that apply across many settings. Accuracy favours theories whose predictions match observations closely. Weick (1979) popularized Thorngate’s argument that a theory of social behaviour cannot simultaneously maximize generality, accuracy, and simplicity: gaining on any two typically costs the third. The trade-off explains why the theory landscape contains both broad, abstract frameworks and narrow, precise models, and why neither is simply “better”.
2.5.4 Novelty and interestingness
Theories must also be worth attention. In a classic essay, M. S. Davis (1971) argued that theories are judged interesting when they deny some assumption their audience holds, when what seems to be the case turns out not to be, and boring when they affirm what the audience already believes. Prospect theory (Chapter 24) was interesting because it contradicted the assumption that decision-makers evaluate final wealth states consistently (Kahneman and Tversky 1979). The finding that open offices reduce face-to-face interaction is interesting because it contradicts the design intuition behind them (Bernstein and Turban 2018). Interestingness is audience-relative: a result that surprises economists may be obvious to psychologists.
2.5.5 Usefulness
Corley and Gioia (2011) review how management scholars define a theoretical contribution and identify two dimensions: originality, ranging from incremental to revelatory, and utility, ranging from scientific usefulness (advancing scholarly conversation) to practical usefulness (informing what practitioners do). They argue that the field has overweighted scientific utility and call for more prescience: theorizing that anticipates problems managers and societies will face, rather than only explaining the past.
Illustrative scenario: an unfalsifiable strategy claim. A consultancy publishes a study concluding that “customer-obsessed” companies outperform their peers. On inspection, firms were classified as customer-obsessed partly on the basis of strong growth and high customer ratings: the very outcomes the theory claims to explain. The claim cannot fail: any high performer will be coded as customer-obsessed after the fact. A falsifiable version would define the construct independently of the outcome (for instance, by the share of executive time spent with customers, or by whether product decisions require customer evidence), measure it before performance is observed, and specify what pattern , such as customer-obsessed firms underperforming in markets where customer preferences shift rapidly, would count against it. The scenario illustrates Bacharach’s point that falsifiability depends as much on construct definition as on the hypothesis itself (Bacharach 1989).
Choose a theory from later in this book and evaluate it against Table 2.6. On which criterion does it score highest? Which criterion does it sacrifice, and is that sacrifice consistent with Thorngate’s trade-off between generality, accuracy, and simplicity?
| Criterion | Diagnostic question | Typical failure | Key source |
|---|---|---|---|
| Falsifiability | What observation would show the theory wrong? | Tautology, constructs too vague to measure | Popper (1959), Bacharach (1989) |
| Explanatory potential | Does it say why, through a clear mechanism? | Black-box correlations | Bacharach (1989), Hedstrom & Swedberg (1998) |
| Predictive adequacy | Does it anticipate outcomes beyond its founding data? | Post hoc fitting, overfitting | Bacharach (1989), Shmueli (2010) |
| Parsimony | Could fewer constructs explain as much? | Kitchen-sink models | Weick (1979) |
| Generality / scope | How many settings does it cover? | Context-bound results presented as general | Merton (1968), Whetten (1989) |
| Internal consistency | Do the assumptions and propositions cohere? | Mutually inconsistent assumptions | Bacharach (1989) |
| Interestingness | Does it challenge an assumption the audience holds? | Confirming the obvious | Davis (1971) |
| Usefulness | Does it inform scholars, practitioners, or both? | Theory that changes no one’s action | Corley & Gioia (2011), Christensen & Raynor (2003) |
Can a field be too devoted to theory? Hambrick (2007a) argued that management’s insistence that every published paper make a novel theoretical contribution has costs. It discourages the publication of important facts that lack a ready theoretical explanation, encourages authors to dress up findings in elaborate but weakly connected theory, and slows the accumulation of replicated empirical regularities from which better theory could later be built. Others respond that without theory, facts do not cumulate and cannot be transported to new contexts. The debate is a useful reminder that the criteria in Table 2.6 are ideals in tension, not a checklist to be maximized simultaneously, a theme that returns in the discussion of replication in Chapter 3.
2.6 Levels of Analysis
Every theory is a theory of something: individuals, dyads, teams, organizations, networks, industries, or societies. The level of analysis is the unit to which a theory’s constructs and generalizations apply. Business phenomena are almost always nested, employees within teams, teams within firms, firms within industries and countries, which makes level mistakes both common and costly.
2.6.1 Three levels that must align
K. J. Klein, Dansereau, and Hall (1994) distinguish the level of theory (the unit the theory seeks to explain), the level of measurement (the unit to which data are directly attached), and the level of statistical analysis (the unit treated as the observation in the analysis). Problems arise when these are misaligned: for example, when a theory about team climate is tested with individual survey responses analysed as independent observations. Klein and colleagues also show that a level-specific theory carries an implicit assumption about how members of a higher-level unit relate to it: members may be homogeneous (alike within the unit, so the unit is the relevant level), independent of the unit (so the individual is the relevant level), or heterogeneous within the unit (so position relative to the group matters, as in a frog-pond model).
2.6.2 Emergence and cross-level models
Rousseau (1985) distinguished composition models, which specify how a construct at one level relates to a functionally similar construct at another (e.g., individual perceptions of climate and organizational climate), from cross-level models, which relate constructs at one level to outcomes at another, and multilevel models, which claim that a relationship holds at several levels. Kozlowski and Klein (2000) add the concept of emergence: higher-level properties that arise from the interactions of lower-level elements. Emergence can be compositional, when the higher-level construct is essentially the shared version of the lower-level one (team efficacy as shared individual efficacy), or compilational, when the higher-level construct is a configuration different in kind from its parts (a team’s coordination pattern, which no individual possesses).
2.6.3 Cross-level fallacies
Two inferential errors recur. The ecological fallacy infers individual-level relationships from aggregate data. W. S. Robinson (1950) provided the classic demonstration: across US states, the proportion of foreign-born residents was negatively correlated with illiteracy, while among individuals foreign birth was positively associated with illiteracy, immigrants tended to settle in states whose native-born residents were more literate. The opposite error, sometimes called the atomistic or individualistic fallacy, infers group-level relationships from individual data. Figure 2.5 shows how the two levels can point in opposite directions.
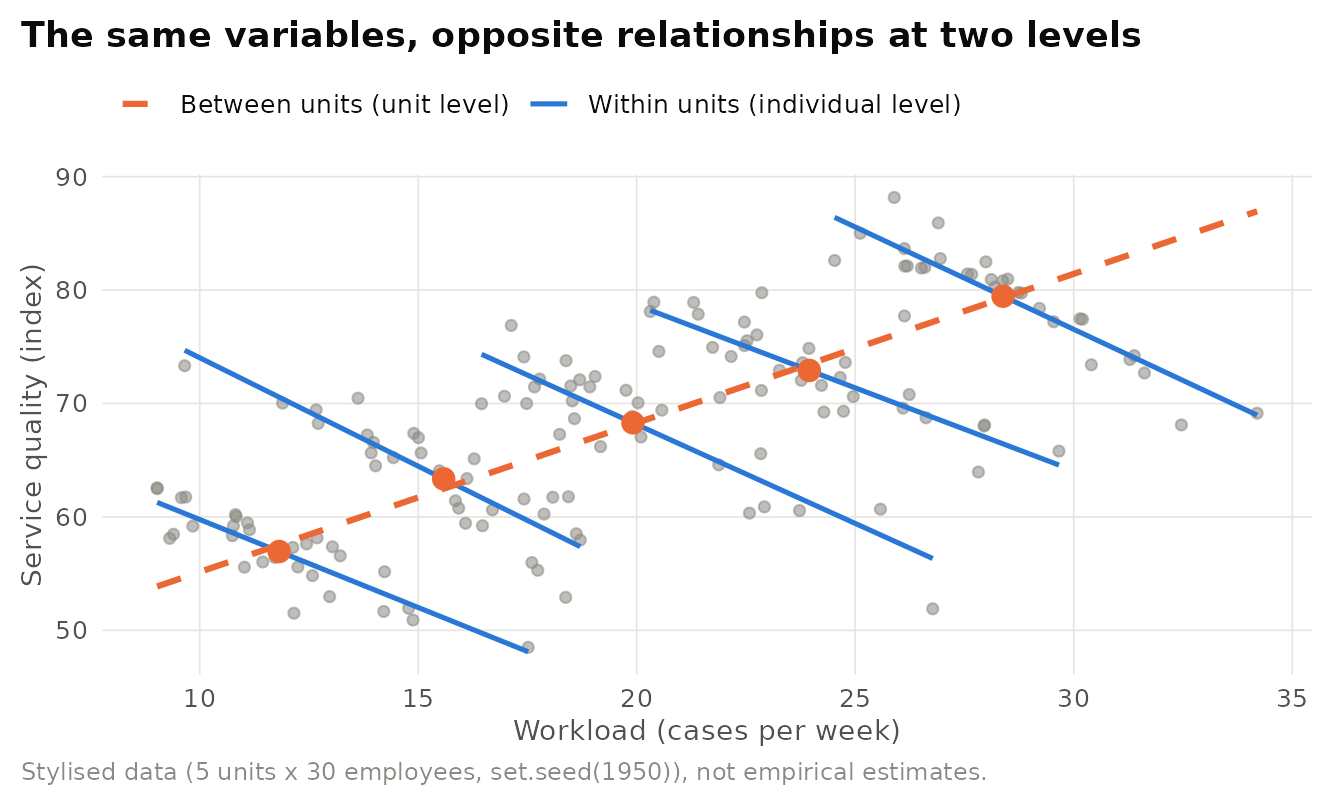
Figure 2.5: Illustrative cross-level reversal. Across business units, units with higher average workload show higher average service quality (orange), perhaps because high-performing units attract more demand. Within each unit, employees carrying more cases than their colleagues deliver lower quality (blue). Stylised simulated data.
Engagement surveys and the level of inference. Harter, Schmidt, and Hayes (2002) meta-analysed the relationship between employee satisfaction and engagement and business outcomes , customer satisfaction, productivity, profit, turnover, and safety, at the level of business units, finding generalizable positive relationships. The level of the evidence matters for how managers use it. The findings support unit-level claims (units with more engaged workforces tend to perform better) and unit-level interventions (improving local management practices). They do not, by themselves, establish that any given employee would perform better if made more engaged, nor do they settle the direction of causality, since well-performing units may also make work more engaging. Reading the evidence at the right level is the difference between a sound engagement programme and an overreaching one.
Checklist for levels in a research design.
- State the focal level of each construct in the theory section, and justify it.
- Specify the composition model when aggregating (e.g., direct consensus, referent shift, dispersion), and report within-group agreement before aggregating.
- Align the levels of theory, measurement, and analysis, or explain and model the misalignment.
- Model nesting explicitly (multilevel or hierarchical models, clustered standard errors, fixed effects for higher-level units).
- Guard against both fallacies: do not draw individual conclusions from unit data or unit conclusions from individual data without a cross-level argument.
2.6.4 A map of the book by level
The theories in this book can be organized by the level at which they primarily operate. Table 2.7 serves as a navigational map. Many theories span levels, signaling theory (Section 8.2) has been applied to individuals, firms, and nations, so the “dominant level” column indicates centre of gravity, not exclusive domain.
| Part | Chapter | Theory families | Dominant level(s) |
|---|---|---|---|
| Foundations | 1-3. Introduction, What is a theory?, Using theory | Meta-theory, theory building and testing | All levels |
| Organizations & Strategy |
|
Resource-based theory, VRIO, knowledge-based view, resource-advantage theory | Firm |
| Organizations & Strategy |
|
Dynamic capabilities, absorptive capacity, exploration-exploitation, ambidexterity | Firm, business unit |
| Organizations & Strategy |
|
Agency, stewardship, transaction cost economics, upper echelons | Dyad, top management team, firm |
| Organizations & Strategy |
|
Resource dependence, institutional, legitimacy, stakeholder, ecology, contingency, CSR | Organization, field, population |
| Organizations & Strategy |
|
Information asymmetry, signaling, screening, costly signaling | Dyad, market |
| Organizations & Strategy |
|
Social exchange, network exchange, weak ties, structural holes, social capital | Dyad, network |
| Organizations & Strategy |
|
Diffusion of innovations, Bass model, TAM, UTAUT, IS success | Individual adopter, market |
| Organizations & Strategy |
|
Structure-conduct-performance, competitive dynamics, game theory, real options, behavioral theory of the firm | Firm, industry |
| Organizations & Strategy |
|
Creative destruction, disruptive innovation, profiting from innovation, effectuation | Firm, venture, industry |
| Organizations & Strategy |
|
Uppsala model, OLI paradigm, internalization, institutional voids | Multinational firm, country |
| Organizations & Strategy |
|
Garbage can, escalation, organizational learning, culture, sensemaking | Organization, team |
| Organizations & Strategy |
|
Job design, JD-R, LMX, transformational leadership, justice, tournaments | Individual, dyad, team |
| Markets, Finance & Economics |
|
Portfolio theory, CAPM, efficient markets, capital structure, behavioral finance | Investor, firm, market |
| Markets, Finance & Economics |
|
Coase theorem, collective action, network effects, auctions, social preferences | Market, institution |
| Individuals & Groups |
|
Hofstede, power distance, GLOBE, Schwartz values, tight-loose | Society, individual |
| Individuals & Groups |
|
Expectancy, equity, goal setting, goal gradient, self-determination | Individual |
| Individuals & Groups |
|
Regulatory focus and fit, construal level, self-control | Individual |
| Individuals & Groups |
|
Cognitive dissonance, attribution, self-perception, social cognitive theory, reactance | Individual |
| Individuals & Groups |
|
Social comparison, social identity, optimal distinctiveness, conformity, norms | Individual within groups |
| Individuals & Groups |
|
Bounded rationality, heuristics and biases, dual process, choice architecture | Individual |
| Individuals & Groups |
|
Expected utility, prospect theory, loss aversion, reference dependence | Individual, market |
| Individuals & Groups |
|
Broaden-and-build, hedonic adaptation, appraisal theory | Individual |
| Individuals & Groups |
|
Elaboration likelihood, persuasion knowledge, agenda setting | Individual, audience |
| Consumers & Marketing |
|
Satisfaction, brand equity, brand relationships, self-congruity, reference price | Consumer |
| Consumers & Marketing |
|
Market orientation, service-dominant logic, service quality, customer equity | Firm, customer base |
| Effects, Phenomena & Frameworks |
|
Mere exposure, decoy, anchoring, IKEA, snob, glass cliff | Individual (mostly) |
| Effects, Phenomena & Frameworks |
|
Similarity asymmetry, wisdom of the crowd, groupthink, bullwhip effect | Individual, dyad, collective |
| Effects, Phenomena & Frameworks |
|
Information processing, five forces, creativity models, mechanism toolkit | Individual to industry |
2.7 How Theories Change
Theories are not discovered once and then preserved. They are proposed, tested, amended, combined, and sometimes abandoned. Understanding how this happens helps readers place any single theory in its intellectual trajectory.
Core claim. Science alternates between long periods of normal science, conducted within a shared paradigm, and occasional revolutions in which an accumulation of anomalies leads a community to adopt a new paradigm.
Origins. History and philosophy of science, Kuhn (1962).
Level of analysis. Scientific community and discipline.
Key constructs. Paradigm, normal science, puzzle-solving, anomaly, crisis, revolution, incommensurability.
Boundary conditions. Developed from the history of the natural sciences. Its fit to the social sciences, where several paradigms often coexist, is debated.
Related theories. Lakatos’s methodology of research programmes (Lakatos 1970). Popper’s falsificationism (Popper 1959).
Kuhn (1962) argued that mature sciences are organized around paradigms: shared exemplars, assumptions, and methods that define which problems are legitimate and what counts as a solution. Within a paradigm, scientists solve puzzles rather than test foundations. Anomalies, observations the paradigm cannot accommodate, are initially set aside or explained away. When they accumulate, a crisis may follow, and a new paradigm can replace the old one. Kuhn controversially argued that competing paradigms can be partly incommensurable, so that the choice between them is not settled by data alone. Figure 2.6 summarizes the cycle.
Figure 2.6: The Kuhnian cycle of theory change (after Kuhn, 1962). Normal science proceeds within a paradigm until anomalies accumulate. A crisis can lead to a revolution and a new period of normal science. Lakatos (1970) offers a gradualist alternative in which research programmes progress or degenerate.
Lakatos (1970) proposed a less dramatic account. Scientific research programmes consist of a hard core of assumptions protected by a belt of auxiliary hypotheses that absorb anomalies. A programme is progressive when its modifications predict novel facts and degenerating when they merely patch failures after the fact. The Lakatosian lens fits management and economics well, where theories are rarely overthrown outright but are amended, bounded, and gradually displaced.
The history of strategy research illustrates the pattern. Industrial-organization reasoning, popularized for strategy by Porter, located the sources of profitability primarily in industry structure (Michael E. Porter 1980a). Persistent performance differences among firms within the same industry were an anomaly for that view, and the resource-based view relocated the explanation inside the firm (Wernerfelt 1984, Jay Barney 1991). When critics noted that static resource endowments could not explain how firms adapt to rapid change, the dynamic-capabilities framework extended the programme (Teece, Pisano, and Shuen 1997). Each shift retained much of its predecessor. None was a clean Kuhnian revolution. In behavioural decision research, by contrast, the accumulation of anomalies for expected-utility theory produced something closer to a paradigm contest, with prospect theory offering a descriptive alternative built on reference dependence and loss aversion (Section 24.4) (Kahneman and Tversky 1979).
Does management have, or need, a paradigm? Pfeffer (1993) argued that organizational science suffers from low paradigm development: weak consensus on theories and methods, compared with fields such as economics. In his view, this fragmentation makes it harder to accumulate knowledge, allocate resources, and defend the field’s standing. Critics countered that theoretical pluralism is appropriate to a complex subject matter and that enforced consensus could suppress valuable alternatives. The debate maps onto a practical question for readers of this book: when theories disagree, should we seek a winner, a synthesis, or a clear statement of the conditions under which each applies? Chapter 3 takes up that question under the heading of competing-theory tests and strong inference.
Mistaking a fashion for a revolution. Management ideas often rise and fall with the business press, and new labels are sometimes presented as paradigm shifts. Before treating a new framework as a replacement for an established theory, ask Lakatos’s question: does it predict novel facts that the older theory cannot, or does it re-describe familiar facts in new vocabulary?
2.8 Chapter Summary
- A theory is a set of related propositions about constructs, together with an explanation of why they are related and where the relationships hold (Whetten 1989, Bacharach 1989).
- References, data, variable lists, diagrams, and hypotheses are ingredients of theory, not substitutes for it. The missing element is usually the why (R. I. Sutton and Staw 1995), although theorizing is a process whose interim products matter (Weick 1995b).
- Constructs are linked by propositions, variables by hypotheses. Every empirical test is also a test of measurement.
- Mechanisms open the black box. Coleman’s boat decomposes macro associations into situational, action-formation, and transformational mechanisms (Coleman 1990, Hedström and Swedberg 1998).
- Theories vary in scope (grand vs. middle-range) and goal (analysis, explanation, prediction, design) (Merton 1968a, Gregor 2006).
- Good theories are falsifiable, useful, parsimonious, appropriately general, and interesting, but these criteria trade off against one another (Popper 1959, M. S. Davis 1971, Corley and Gioia 2011).
- Levels of theory, measurement, and analysis must align. Relationships can reverse across levels (K. J. Klein, Dansereau, and Hall 1994, W. S. Robinson 1950).
- Theories change through revolutions and, more often in management, through the progressive or degenerating evolution of research programmes (Kuhn 1962, Lakatos 1970).
- Managers always act on theories. The choice is between explicit, tested theories and implicit, untested ones (Christensen and Raynor 2003, Rousseau 2006).
Table 2.8 presents the summary of the chapter’s core ideas.
| Idea | Core claim | Practical test | Key source |
|---|---|---|---|
| What theory is not | Ingredients are not explanations | Can you state the why for each arrow? | Sutton & Staw (1995) |
| Four building blocks | What, how, why, who/where/when | Are all four explicit? | Whetten (1989) |
| Constructs vs. variables | Propositions link constructs, hypotheses link variables | Is the construct-to-measure link defensible? | Bacharach (1989) |
| Mechanisms | Explain macro patterns through micro processes | Can the intermediate steps be observed? | Coleman (1990), Hedstrom & Swedberg (1998) |
| Middle-range theory | Bounded, testable theories accumulate best | Is the scope stated and testable? | Merton (1968) |
| Theory types | Analysis, explanation, prediction, design | Is the goal explicit? | Gregor (2006) |
| Evaluation criteria | Falsifiable, useful, parsimonious, interesting | Which criterion is being traded off? | Popper (1959), Davis (1971) |
| Levels of analysis | Align theory, measurement, analysis | Is a cross-level inference being made? | Klein et al. (1994) |
| Theory change | Paradigms and research programmes | Does the new idea predict novel facts? | Kuhn (1962), Lakatos (1970) |
2.9 Discussion Questions
- Take a recent empirical article in your field. Using Whetten’s four elements, identify which element is weakest. What would it take to strengthen it?
- Sutton and Staw argue that diagrams are not theory, while Weick argues that they may be valuable steps in theorizing. Under what circumstances is a diagram-heavy paper a genuine contribution?
- Choose a managerial “best practice” (e.g., open-plan offices, forced ranking, loyalty programmes). Reconstruct the implicit theory behind it as a Coleman boat. Which arrow is least supported by evidence?
- A consultancy reports that firms with more diverse boards have higher returns on equity. What level-of-analysis and causal questions would you ask before recommending board diversification to a specific client?
- Thorngate’s postulate suggests that no theory can be simultaneously general, accurate, and simple. Pick one theory from this book and argue which of the three it sacrifices.
- Is the shift from industry-structure explanations to the resource-based view better described as a Kuhnian revolution or a Lakatosian progression? Defend your answer with evidence.
2.10 Further Reading
- Whetten (1989): a five-page statement of what a theoretical contribution requires. The most practical starting point.
- R. I. Sutton and Staw (1995): a sharp diagnosis of what theory is not, with the replies by Weick (1995b) and DiMaggio (1995) in the same issue.
- Bacharach (1989): rigorous criteria for evaluating organizational theories, including the construct-variable distinction.
- Hedström and Swedberg (1998): the core statement of mechanism-based explanation in the social sciences.
- K. J. Klein, Dansereau, and Hall (1994): the standard reference on levels issues in theory, measurement, and analysis.
- M. S. Davis (1971): why some theories capture attention and others do not. Still provocative.
- Christensen and Raynor (2003): a practitioner-oriented argument for why managers need explicit causal theory.
- Kuhn (1962): the classic account of paradigms and scientific revolutions.