1 Introduction
Doing social science research requires knowing a great many theories, and knowing which one fits which problem. For a new doctoral student this can be overwhelming. Senior colleagues seem to speak theory as a second language: “that’s an agency problem”, “it’s a signaling story”, “sounds like optimal distinctiveness”. The standard advice is that theories are absorbed gradually, one paper at a time. That advice is sound, but slow and unsystematic, and it leaves gaps that only become visible when a reviewer points them out.
This book takes the opposite approach. It organizes the theories most often used in business and the social sciences into a single, consistent reference, so that a reader can (1) find the right theory quickly, (2) understand its logic well enough to use it correctly, and (3) see how it connects to its neighbours. It began as the author’s personal notes and grew into a field guide meant for anyone who needs theory to do serious work: in a dissertation, a journal article, a classroom, or a boardroom.
1.1 Why theory matters: in research and in business
A theory is a set of statements about how and why a set of constructs are related, and under what conditions (Chapter 2). Theory does three jobs that data alone cannot do:
- It tells you where to look. Every dataset contains more correlations than anyone could test. Theory narrows the search to relationships that should exist if a particular mechanism operates.
- It explains why. An observed effect without a mechanism cannot be generalized. Knowing that a warranty raises sales is useful. Knowing that it does so because it is a costly signal (Section 8.2) tells you when it will stop working (when competitors can match it cheaply).
- It travels. Mechanisms transfer across settings. The logic of adverse selection (Section 8.1) explains used cars, insurance, hiring, and venture capital alike.
Managers use theory constantly, usually without naming it. A pricing manager who offers a “good-better-best” menu is applying screening (Section 8.3). An HR director worried that a bonus will undermine intrinsic interest is invoking self-determination theory (Section 19.6). A utility that tells households how their energy use compares with their neighbours’ is using social norms (Section 22.5). Making these theories explicit lets decision makers anticipate side effects and boundary conditions before they become expensive surprises.
Theory as a decision tool. Consider a subscription business deciding whether to offer a free trial. Four theories in this book make different predictions: the endowment effect (Section 23.4) suggests trial users will value the product more once they “own” it. Hedonic adaptation (Section 25.2) warns that novelty fades. Signaling theory (Section 8.2) suggests that a long free trial signals confidence in quality, and choice architecture (Section 23.10) highlights that whether the trial converts by default will dominate the outcome. A manager who knows all four can design an experiment that tells them apart, and a researcher can turn the same contrast into a paper.
1.2 A map of the theories
The theories in this book are not isolated islands. Many share mechanisms (for example, information, incentives, identity, or power), and many were developed in dialogue with one another. Figure 1.1 shows every entry in the book as a node, coloured by part of the book. Edges connect theories that cross-reference each other in the text. In the online edition the map is interactive: hover to see a theory’s core claim, click to highlight its neighbours, and use the menu to select a theory.
Figure 1.1: The theory map: each node is an entry in the book, coloured by part. Edges connect entries that cross-reference each other. Hover over a node for details.
Figure 1.2 cross-tabulates the entries by level of analysis and dominant mechanism. Two patterns stand out. First, most organization-level theories explain outcomes through resources, incentives, power, or legitimacy (Section @ref(legitimacy (Section 7.3))), while individual-level theories rely on cognition, emotion, motivation, and identity. Second, a handful of mechanisms, especially information and social comparison, work at every level, which is why theories built on them (signaling, social comparison, social norms) travel so widely across disciplines.
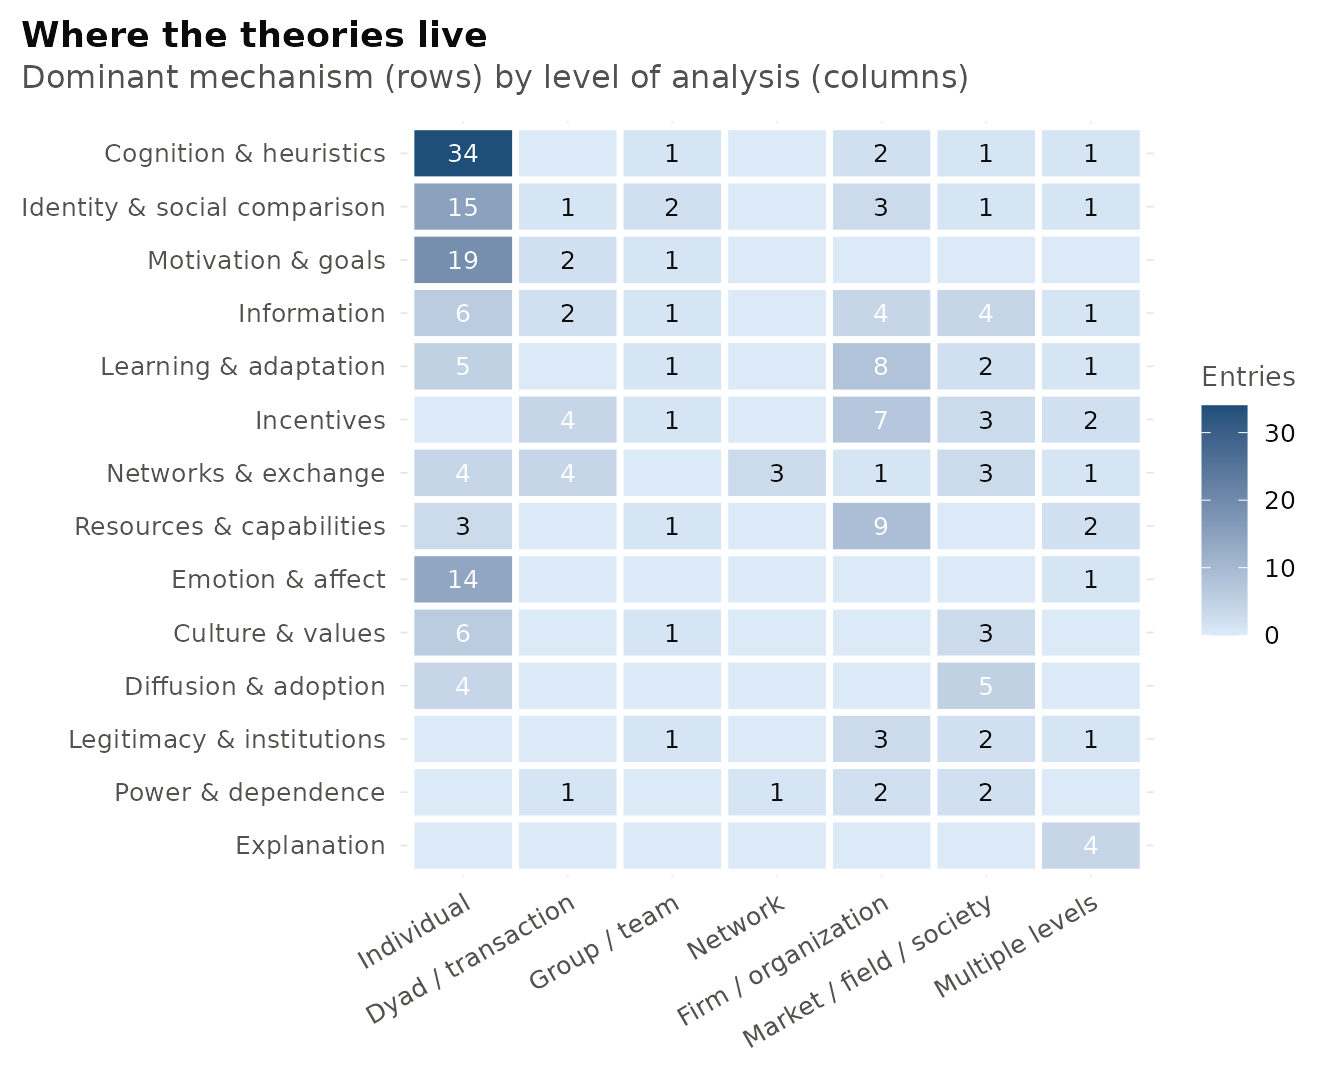
Figure 1.2: Entries in the book by level of analysis and dominant mechanism. Darker cells contain more theories.
1.3 Finding the right theory for your question
Researchers usually start from a phenomenon, not a theory. Table 1.1 works backwards from common research and managerial questions to the families of theory that address them.
| If your question is about… | Start with | Chapter |
|---|---|---|
| Why some firms persistently outperform others | Resource-based view, dynamic capabilities | 4-5 |
| Whether to make, buy, or partner | Transaction cost economics, resource dependence | 6-7 |
| Aligning managers or employees with owners | Agency theory, stewardship theory | 6 |
| Why firms in a field look alike | Institutional theory, legitimacy | 7 |
| Communicating quality that buyers cannot see | Signaling, screening, information asymmetry | 8 |
| Who gets information, power, and opportunities | Social exchange, weak ties, structural holes | 9 |
| How new products and technologies spread | Diffusion of innovations, Bass model, TAM/UTAUT | 10 |
| How firms compete and respond to rivals | Structure-conduct-performance, competitive dynamics, game theory | 11 |
| Why incumbents fail and start-ups succeed | Disruptive innovation, profiting from innovation, effectuation | 12 |
| How firms expand across borders | Uppsala model, OLI paradigm, institutional voids | 13 |
| How organizations decide, learn, and make sense of events | Garbage can, escalation of commitment, sensemaking | 14 |
| Job design, engagement, and leadership | Job demands-resources, LMX, transformational leadership | 15 |
| Capital structure, valuation, and investor behaviour | Modigliani-Miller, efficient markets, behavioral finance | 16 |
| Platforms, externalities, and fairness in markets | Network effects, two-sided markets, social preferences | 17 |
| Adapting strategy or messages across countries | Hofstede, GLOBE, self-construal | 18 |
| Designing incentives, goals, and rewards | Expectancy, equity, goal setting, self-determination | 19 |
| Framing messages for different audiences | Regulatory focus and fit, construal level | 20 |
| Changing attitudes and explaining blame | Cognitive dissonance, attribution, reactance | 21 |
| Using peers, norms, and identity to change behaviour | Social comparison, social norms, optimal distinctiveness | 22 |
| Pricing, defaults, and seemingly irrational choices | Mental accounting, choice architecture, heuristics | 23 |
| Gains, losses, risk, and reference points | Prospect theory, loss aversion, status quo bias | 24 |
| Customer experience, well-being, and virality | Peak-end rule, hedonic adaptation, emotion and virality | 25 |
| Persuasion, word of mouth, and media effects | ELM, persuasion knowledge, social transmission | 26 |
| Satisfaction, brands, and consumer identity | Expectancy-disconfirmation, brand equity, self-congruity | 27 |
| Customer value, services, and marketing strategy | Market orientation, service quality, customer equity | 28 |
1.4 How to read this book
- Looking up one theory? Search the book or use the Theory Atlas. Each entry opens with a theory card that summarises the essentials in under a minute.
- Learning a field? Read a whole chapter. Chapters group theories that are usually compared with each other and end with a comparison table and discussion questions suitable for seminars.
- Writing a paper? Read Chapters 2 and 3 first, then use the research toolkit box in each entry for sample hypotheses, measures, and designs.
- Making a decision? Go straight to the business case boxes, then read the pitfall and debate boxes to understand where the theory breaks down.
Theory shopping. It is tempting to pick a theory after the results are in and choose whichever one “explains” them. This is a form of HARKing, hypothesizing after the results are known, and it produces fragile findings (Chapter 3). Choose theories for their mechanisms before collecting data, and, where possible, pit two theories with different predictions against each other.
1.5 Conventions
Citations follow author-year style and link to the full reference list. Figures labelled Illustrative or Stylised are built from simulated or schematic data to show a theory’s logic. They are not empirical results. All code used to make the figures is in the book’s GitHub repository, so every figure can be reproduced and adapted.