27 Consumer Behavior and Branding
In April 1985 the Coca-Cola Company replaced the formula of its flagship drink with a sweeter recipe that had beaten both the original and Pepsi in extensive blind taste tests. The launch of “New Coke” provoked letters, protests, and a wave of press coverage, and within three months the company brought the original back as Coca-Cola Classic. Consumers had rejected a product they preferred when they could not see the label. The episode is the most famous demonstration of a point this chapter develops at length: what consumers buy is rarely just a bundle of physical attributes. They buy expectations that can be met or disappointed, chains of meaning that link attributes to personal values, memories of a brand, a partner in a relationship, a mirror for the self, a licence to indulge, a feeling of “mine”, a reference point against which a price feels fair, and a share in a culture.
Similar puzzles appear across categories. Why do some owners of Harley-Davidson motorcycles tattoo the company’s logo on their skin, while few owners of equally reliable machines feel any such loyalty? Why did Porsche’s move into sport utility vehicles succeed while Bic’s move from pens and lighters into perfume did not? Why do shoppers at outlet malls respond to “compare at” prices that they may not fully believe, and why did a large US department store chain lose customers when it abolished the discounts that its shoppers claimed to dislike? Why does touching a mug in a store make it feel more valuable, and why do people choose less-preferred options “for the sake of variety”?
This chapter introduces twelve theories that consumer researchers and brand managers use to answer such questions. We begin with the cognitive core of post-purchase evaluation (expectancy-disconfirmation) and the motivational logic linking product features to personal values (means-end chain theory). We then turn to the brand: how it lives in consumer memory (customer-based brand equity), how it acquires human characteristics (brand personality), how consumers form relationships with it (consumer-brand relationships), and how it expresses the self (self-congruity). Four theories address how consumers evaluate and choose: schema congruity (new products and brand extensions), the hedonic-utilitarian distinction, psychological ownership, and variety seeking. Two final theories widen the lens to price perception (reference price) and to the cultural meanings of consumption (consumer culture theory). Table 27.1 summarises the territory.
| Theory | Core question | Level of analysis | Key source |
|---|---|---|---|
| Expectancy-disconfirmation | How do consumers judge whether they are satisfied? | Individual | Oliver (1980) |
| Means-end chain | How do product attributes connect to personal values? | Individual | Gutman (1982) |
| Customer-based brand equity | Why does the same marketing work better for some brands? | Individual / brand | Keller (1993), Aaker (1991) |
| Brand personality | Which human traits do consumers ascribe to brands? | Brand | Aaker (1997) |
| Consumer-brand relationships | Can consumers have relationships with brands, and of what kind? | Dyad (consumer-brand) | Fournier (1998) |
| Self-congruity | Why do consumers prefer brands that match who they are? | Individual | Sirgy (1982), Belk (1988) |
| Schema congruity | Why are moderately unexpected products evaluated favourably? | Individual | Meyers-Levy & Tybout (1989) |
| Hedonic and utilitarian consumption | How do pleasure and function shape choice and justification? | Individual | Hirschman & Holbrook (1982), Dhar & Wertenbroch (2000) |
| Psychological ownership | Why do people value what feels like theirs? | Individual | Pierce, Kostova & Dirks (2001) |
| Variety seeking | Why do consumers switch away from a favourite? | Individual | McAlister & Pessemier (1982) |
| Reference price | Against what standard do consumers judge a price? | Individual / market | Winer (1986), Mazumdar et al. (2005) |
| Consumer culture theory | How do consumers use goods and brands to make cultural meaning? | Individual / community / society | Arnould & Thompson (2005) |
Three organising ideas recur. First, consumers evaluate offerings against standards (expectations, schemas, reference prices, the self), so the same objective product can delight one person and disappoint another. Second, brands are knowledge structures in memory that carry functional, symbolic, and emotional meaning, and that meaning is co-authored by firms, consumers, and the wider culture. Third, many of the most consequential effects in this chapter are asymmetric: losses loom larger than gains, transgressions matter more for some brands than others, and extensions can dilute as well as leverage. The chapter connects to Prospect theory (Chapter 24), the Endowment effect (Section 23.4), Social identity theory (Section 22.2), and the Elaboration likelihood model (Section 26.1), and it prepares the ground for the firm-level theories of the next chapter, such as Market orientation (Section 28.1) and Customer equity (Section 28.4).
27.1 Expectancy-Disconfirmation Theory
Core claim. Satisfaction results from comparing perceived performance with prior expectations. Performance that exceeds expectations (positive disconfirmation) raises satisfaction, and performance that falls short (negative disconfirmation) lowers it, over and above the levels of expectations and performance themselves.
Origins. Consumer psychology and marketing, building on adaptation-level and assimilation-contrast ideas (R. E. Anderson 1973). Formalised by R. L. Oliver (1980) and tested against rival specifications by Churchill and Surprenant (1982). Extended to firm-level data by E. W. Anderson and Sullivan (1993).
Level of analysis. Individual consumer, aggregated to firms, industries, and national indices.
Key constructs. Expectations (predictive standards), perceived performance, disconfirmation (subjective comparison), satisfaction, repurchase intention, complaining, word of mouth (Section 26.3).
Boundary conditions. Expectations must exist before consumption and performance must be evaluable. For complex durables or credence services, performance may dominate and disconfirmation matters less. Asymmetries are expected: shortfalls hurt more than equivalent surpluses help.
Related theories. Prospect theory (Chapter 24), Hedonic adaptation (Section 25.2), Service quality gap model (Section 28.3), Customer equity (Section 28.4), Cognitive dissonance theory (Section 21.1).
27.1.1 Origins and intellectual history
Early research on consumer satisfaction borrowed two ideas from psychology. The first was assimilation: consumers who expect a product to be good may perceive it as better than it is, pulling perceptions toward expectations. The second was contrast: a product that falls short may be perceived as worse than it is because the gap is magnified. R. E. Anderson (1973) set these rival predictions against each other experimentally and helped establish disconfirmed expectations as a central variable in satisfaction research.
R. L. Oliver (1980) reorganised the field around a simple but powerful structure. Expectations create a frame of reference. After consumption, the consumer judges whether performance was better or worse than expected. That disconfirmation judgment, together with the expectation level, determines satisfaction, and satisfaction in turn updates attitudes and purchase intentions. Satisfaction is therefore not a property of the product. It is a relative judgment that depends on what the consumer brought to the encounter.
27.1.2 Core logic and propositions
The theory involves four constructs and two paths to satisfaction: a direct effect of expectations (which anchor judgments) and an effect of disconfirmation (which captures surprise relative to that anchor).
- P1 (Disconfirmation). Holding performance constant, satisfaction increases with positive disconfirmation and decreases with negative disconfirmation (R. L. Oliver 1980).
- P2 (Performance). Perceived performance affects satisfaction both directly and through disconfirmation. For some products, the direct path dominates: Churchill and Surprenant (1982) found that satisfaction with a durable product was driven by performance alone, whereas expectations and disconfirmation also mattered for a nondurable product.
- P3 (Asymmetry). Negative disconfirmation has a larger effect on satisfaction than positive disconfirmation of the same size (E. W. Anderson and Sullivan 1993).
- P4 (Evaluability). Disconfirmation is more likely to be perceived when quality is easy to evaluate (E. W. Anderson and Sullivan 1993).
- P5 (Consequences). Satisfaction raises repurchase intention, but the link between stated satisfaction and actual repurchase is nonlinear and differs across customer groups (Mittal and Kamakura 2001) (Figure 27.1).
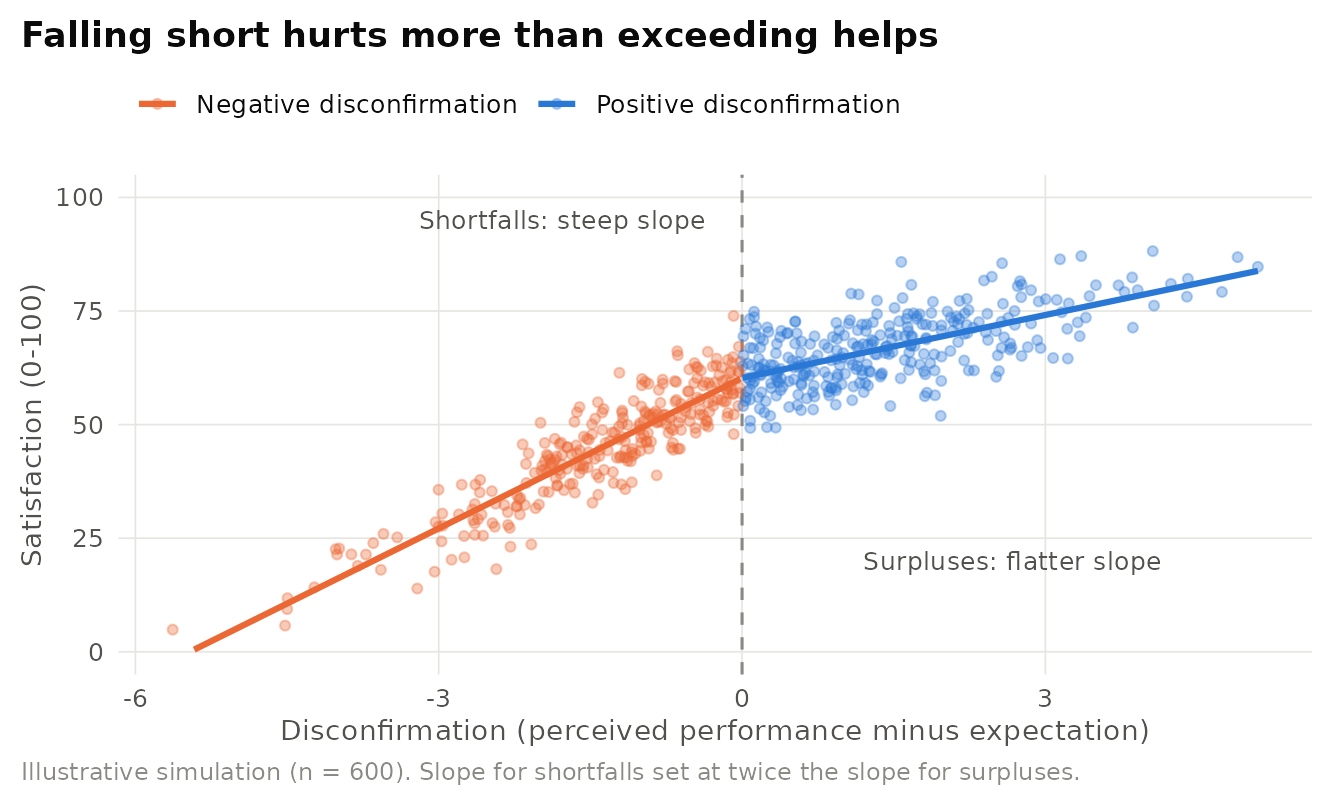
Figure 27.1: Stylised expectancy-disconfirmation relationship. Each point is a simulated customer. Satisfaction rises with disconfirmation (perceived performance minus expectations), but the slope is steeper for shortfalls than for surpluses, the asymmetry reported by Anderson and Sullivan (1993). Illustrative data, not empirical estimates.
27.1.3 Mechanism
Figure 27.2 shows the causal structure. The dashed edge from expectations to perceived performance represents assimilation: high expectations can colour the experience itself. The dotted moderator captures evaluability, which governs how much the comparison process, rather than raw performance, drives the judgment.
Figure 27.2: Mechanism of expectancy-disconfirmation. Expectations and perceived performance feed a subjective comparison (disconfirmation), which shapes satisfaction and downstream loyalty. Based on Oliver (1980), Churchill and Surprenant (1982), and Anderson and Sullivan (1993).
27.1.4 Evidence and extensions
The model has been tested in hundreds of studies. A meta-analysis by Szymanski and Henard (2001) found that disconfirmation and perceived fairness (equity) are among the strongest correlates of satisfaction, while the direct effect of expectations is weaker and more variable. Spreng, MacKenzie, and Olshavsky (1996) argued that expectations are not the only relevant standard: consumers also compare performance with their desires, and desire congruency adds explanatory power. At the firm level, E. W. Anderson and Sullivan (1993) used Swedish national survey data to show that perceived quality and disconfirmation drive satisfaction and that negative disconfirmation weighs more heavily, an asymmetry that echoes Loss aversion (Section 24.4). Satisfaction research also scaled up into national indices: the American Customer Satisfaction Index (ACSI) models satisfaction as the outcome of customer expectations, perceived quality, and perceived value, with complaints and loyalty as consequences (Fornell et al. 1996). Fornell et al. (2006) reported that a portfolio of firms with high ACSI scores outperformed the market, which suggested that satisfaction is an under-priced intangible asset.
Is satisfaction a comparison or a feeling? Critics argue that the disconfirmation paradigm is too cognitive. Satisfaction also has affective roots: R. L. Oliver (1993) showed that positive and negative affect experienced during consumption contribute to satisfaction alongside disconfirmation and attribute-level judgments. A second debate concerns measurement: inferred disconfirmation (performance minus expectation scores) and perceived disconfirmation (“better or worse than expected”) are not equivalent, and the perceived version is contaminated by the satisfaction judgment it is supposed to explain. A third debate concerns financial consequences. Jacobson and Mizik (2009) re-examined the claim that satisfaction predicts abnormal stock returns and found the effect concentrated in a small set of firms, mostly in computer and internet industries, which raised doubts about a general market mispricing. The exchange is a useful reminder that satisfaction-performance links depend on industry, time window, and model specification.
27.1.5 Applications in business
Expectancy-disconfirmation gives managers two levers rather than one. Firms can raise performance, but they can also manage expectations: promise what they can reliably deliver, then exceed it. Overpromising in advertising may win the first purchase but sets up negative disconfirmation, the costliest outcome in the asymmetric model.
Customer satisfaction measurement: the ACSI. The American Customer Satisfaction Index, launched in 1994 at the University of Michigan, surveys customers of companies across the US economy and estimates a structural model in which expectations, perceived quality, and perceived value drive satisfaction, which in turn drives complaints and loyalty (Fornell et al. 1996). Its design embodies the theory: it does not ask only “how satisfied are you” but measures the standards against which satisfaction is formed. Firms use ACSI benchmarks to compare themselves with competitors and to diagnose whether a fall in satisfaction reflects rising expectations or declining quality. The contrast with single-question loyalty metrics is instructive. The Net Promoter Score asks only about likelihood to recommend (Reichheld 2003), and Keiningham et al. (2007) did not find that it outperformed the ACSI in predicting revenue growth.
Table 27.2 presents the approaches to measuring customer satisfaction and their relation to expectancy-disconfirmation theory.
| Approach | What is measured | Link to the theory | Main limitation |
|---|---|---|---|
| Inferred disconfirmation | Separate expectation and performance ratings, difference computed | Operationalises the comparison explicitly | Difference scores are unreliable |
| Perceived disconfirmation | Direct rating: better or worse than expected | Captures the subjective comparison | Overlaps with the satisfaction judgment |
| ACSI structural model | Expectations, quality, value, satisfaction, complaints, loyalty | Embeds satisfaction in its antecedents and consequences | Survey cost, annual cadence |
| Net Promoter Score | Likelihood to recommend (0-10) | Outcome only, no standard of comparison | Weak diagnostic value |
| Behavioural metrics | Repurchase, churn, complaints, returns | Tests the satisfaction-loyalty link | Confounded by switching costs |
Illustrative scenario: launch messaging for a meal-kit service. A start-up tests two launch messages. Version A promises “restaurant quality in 20 minutes”. Version B promises “a good weeknight dinner in about 30 minutes”. Version A lifts trial, but customers report recipes taking 35-40 minutes. Under expectancy-disconfirmation, Version A converts a performance that is adequate in absolute terms into a shortfall. The theory predicts higher first-box churn for Version A, and an A/B test that tracks second-order rates rather than sign-ups is the appropriate check.
27.1.6 Using the theory in research
Sample hypotheses.
- H1. Holding perceived performance constant, customers exposed to higher-expectation advertising will report lower satisfaction.
- H2. The effect of negative disconfirmation on churn will be larger than the effect of positive disconfirmation of equal magnitude.
- H3. The effect of disconfirmation on satisfaction will be weaker for credence services (e.g., financial advice) than for search or experience goods.
Established measures. Oliver’s satisfaction items (R. L. Oliver 1980), perceived disconfirmation scales (“much worse than expected” to “much better than expected”), and the ACSI model and survey items (Fornell et al. 1996).
Designs. Experiments that manipulate expectations (advertising claims) and performance (product quality) orthogonally. Panel surveys linking satisfaction to observed repurchase (Mittal and Kamakura 2001). Firm-level panels using ACSI data with financial outcomes (Fornell et al. 2006, Jacobson and Mizik 2009).
Data sources. ACSI firm scores, customer review text (with star ratings as satisfaction and review content as disconfirmation cues), CRM churn data.
Treating satisfaction as absolute. A satisfaction score is relative to a standard. Comparing scores across segments, brands, or time without asking whether expectations moved can produce wrong conclusions: a luxury hotel and a budget motel can earn identical scores for very different performance. A related error is to measure disconfirmation and satisfaction in the same survey block and then report a large correlation as support for the theory. Separate the measures in time or method, or manipulate expectations directly.
27.2 Means-End Chain Theory
Core claim. Consumers value product attributes not for their own sake but as means to desired consequences, which in turn serve personal values. Product knowledge is organised as chains linking attributes, consequences, and values.
Origins. Consumer research. Gutman (1982), drawing on value theory and categorisation research. The laddering interview method was systematised by Reynolds and Gutman (1988). Zeithaml (1988) applied the logic to price, quality, and value.
Level of analysis. Individual consumer, aggregated to segments through hierarchical value maps.
Key constructs. Concrete and abstract attributes, functional and psychosocial consequences, instrumental and terminal values, ladders, implication matrix, hierarchical value map.
Boundary conditions. Most informative for involving products where consumers can articulate reasons. Less useful for habitual, low-involvement purchases where chains are short or absent.
Related theories. Schwartz values (Section 18.6), Expectancy theory (Section 19.2), Self-congruity, Hedonic and utilitarian consumption.
27.2.1 Core logic
Gutman (1982) proposed that consumers choose actions that produce desired consequences and minimise undesired ones, and that values give consequences their positive or negative valence. Product attributes matter because they are associated, in the consumer’s mind, with consequences that are themselves linked to values. The result is a cognitive chain: attribute (what the product has) leads to consequence (what it does for me) leads to value (why that matters to me).
Figure 27.3 shows an illustrative ladder for a running shoe. The same attribute can lead to different values for different consumers, which is why means-end analysis is a segmentation tool as much as a theory of motivation.
Figure 27.3: Illustrative means-end ladders for a running shoe. Two consumers start from the same attribute (cushioning) but reach different terminal values through different consequences. Laddering interviews elicit such chains by repeatedly asking why an element is important. Illustrative example, not interview data.
27.2.2 Laddering as method
Reynolds and Gutman (1988) described laddering as a semi-structured interview that begins with a distinction the consumer draws between products (often elicited by sorting or preference comparisons) and then repeatedly asks “why is that important to you?” until the respondent reaches a value or cannot go further. Responses are content-coded into attributes, consequences, and values. An implication matrix counts how often each element leads to every other, and a hierarchical value map (HVM) draws the dominant links above a cut-off. Table 27.3 summarises the levels.
| Level | Definition | Typical laddering prompt | Coffee example | Marketing use |
|---|---|---|---|---|
| Concrete attribute | Physical, observable feature | What makes this one different? | Single-origin beans | Product specification |
| Abstract attribute | Subjective characterisation of features | What does that mean for the product? | Rich flavour | Positioning claims |
| Functional consequence | Direct, tangible outcome of use | Why is that important to you? | Enjoyable morning ritual | Benefit copy |
| Psychosocial consequence | Social or psychological outcome | And why does that matter? | Moment to myself before work | Emotional appeals |
| Instrumental value | Preferred mode of conduct | Why is that important to you? | Being in control of my day | Brand character |
| Terminal value | Desired end state | And why is that important? | Inner harmony, self-respect | Leverage point for advertising |
27.2.3 Evidence and critique
Means-end analysis has been used to study food, financial services, tourism, and advertising, and it shaped how agencies translate product features into value-based communication. Zeithaml (1988) used a means-end framework to show that consumers move from intrinsic and extrinsic cues to perceived quality, perceived sacrifice, and perceived value, a structure still used in pricing research.
Are ladders discovered or constructed? Grunert and Grunert (1995) questioned whether laddering reveals stable cognitive structures or prompts respondents to construct plausible chains on the spot. “Why” probing may push people to higher abstraction than their actual decision process involves. Hard laddering (questionnaire formats) and the association pattern technique, which asks respondents to tick links in predefined attribute-consequence and consequence-value matrices, offer more scalable and comparable alternatives (ter Hofstede et al. 1998). The cost is that predefined lists can miss idiosyncratic meanings that soft interviews reveal.
From attribute claims to value platforms. Many mature categories compete on attribute parity: most toothpastes fight cavities, most cars are safe. Means-end analysis helps brand managers find the level of the ladder where differentiation is still possible. A car maker’s safety engineering (attribute) can lead to “protecting my family” (psychosocial consequence) and to “being a responsible parent” (value). Volvo’s long association with safety is a familiar public example of a brand that built its positioning around one ladder and kept it consistent across decades. The research task is to verify that the target segment’s ladder actually runs through the claimed attribute, rather than assuming it.
Sample hypotheses.
- H1. Advertising that connects an attribute to a terminal value from the segment’s dominant ladder will produce more favourable brand attitudes than advertising that stops at the functional consequence.
- H2. Ladders will be longer (reach more abstract levels) for high-involvement than for low-involvement categories.
Measures and designs. Soft laddering interviews coded into an implication matrix and HVM (Reynolds and Gutman 1988). The association pattern technique for large samples and cross-national segmentation (ter Hofstede et al. 1998). Value inventories such as the Schwartz value (Section 18.6) survey to validate the value level.
27.3 Customer-Based Brand Equity
Core claim. A brand has positive equity when consumers respond more favourably to its marketing (its product, price, promotion, or distribution) than they would to the same marketing for an unnamed or fictitious version. That differential response arises from brand knowledge in memory: awareness of the brand and the favourability, strength, and uniqueness of its associations (Keller 1993).
Origins. Marketing. D. A. Aaker (1991) framed brand equity as a set of assets and liabilities linked to a brand name. Keller (1993) developed the consumer-psychological account grounded in associative memory. Keller and Lehmann (2006) review the research programme.
Level of analysis. Individual consumer (brand knowledge), aggregated to the brand and the firm (price premiums, market share, firm value).
Key constructs. Brand awareness (recall, recognition), brand image, brand associations (type, favourability, strength, uniqueness), perceived quality, brand loyalty, differential response.
Boundary conditions. Equity is defined relative to a comparison (an unbranded or fictitious product) and to a consumer segment. Associations that are favourable in one segment or market may be neutral or negative in another.
Related theories. Signaling theory (Section 8.2), Market-based assets (Section 4.5), Brand personality, Schema congruity, Mere exposure effect (Section 29.1).
27.3.1 Origins and intellectual history
Brand equity became a managerial priority in the late 1980s, when a wave of acquisitions placed large financial values on brand names and practitioners asked what, exactly, they were paying for. D. A. Aaker (1991) answered with an asset view: brand equity comprises brand loyalty, name awareness, perceived quality, brand associations, and other proprietary assets such as trademarks and channel relationships. Each adds or subtracts value for the customer and the firm.
Keller (1993) moved the definition inside the consumer’s head. Building on associative network models of memory, he defined customer-based brand equity as the differential effect that brand knowledge has on how consumers respond to the brand’s marketing. Brand knowledge has two components. Brand awareness is the ability to recall or recognise the brand. Brand image is the set of associations linked to the brand node in memory. The definition’s power lies in its comparative structure: equity is not how much people like a brand, but how much more they respond to the same marketing action because the brand name is attached.
27.3.2 Core logic and propositions
- P1 (Awareness as a threshold). Brand awareness is necessary for equity: a brand must be in the consideration set before its associations can matter.
- P2 (Image). Given awareness, equity increases with the favourability, strength, and uniqueness of brand associations (Keller 1993).
- P3 (Differential response). High-equity brands enjoy higher willingness to pay, lower price elasticity, greater advertising and promotion effectiveness, and more favourable evaluations of brand extensions.
- P4 (Credibility). Brand investments make brand promises credible, which reduces perceived risk and information costs. Erdem and Swait (1998) formalise this as a signaling (Section 8.2) account of brand equity (Figure 27.4).
Figure 27.4: Customer-based brand equity as a memory structure. Awareness and the characteristics of brand associations jointly produce a differential response to marketing, which appears in market and financial outcomes. Based on Keller (1993) and Keller and Lehmann (2006).
Figure 27.5 translates P3 into a stylised demand comparison. The branded and unbranded products are physically identical. The branded product sells more at every price and loses fewer buyers when the price rises: brand equity shows up as both a level shift and a flatter demand curve.
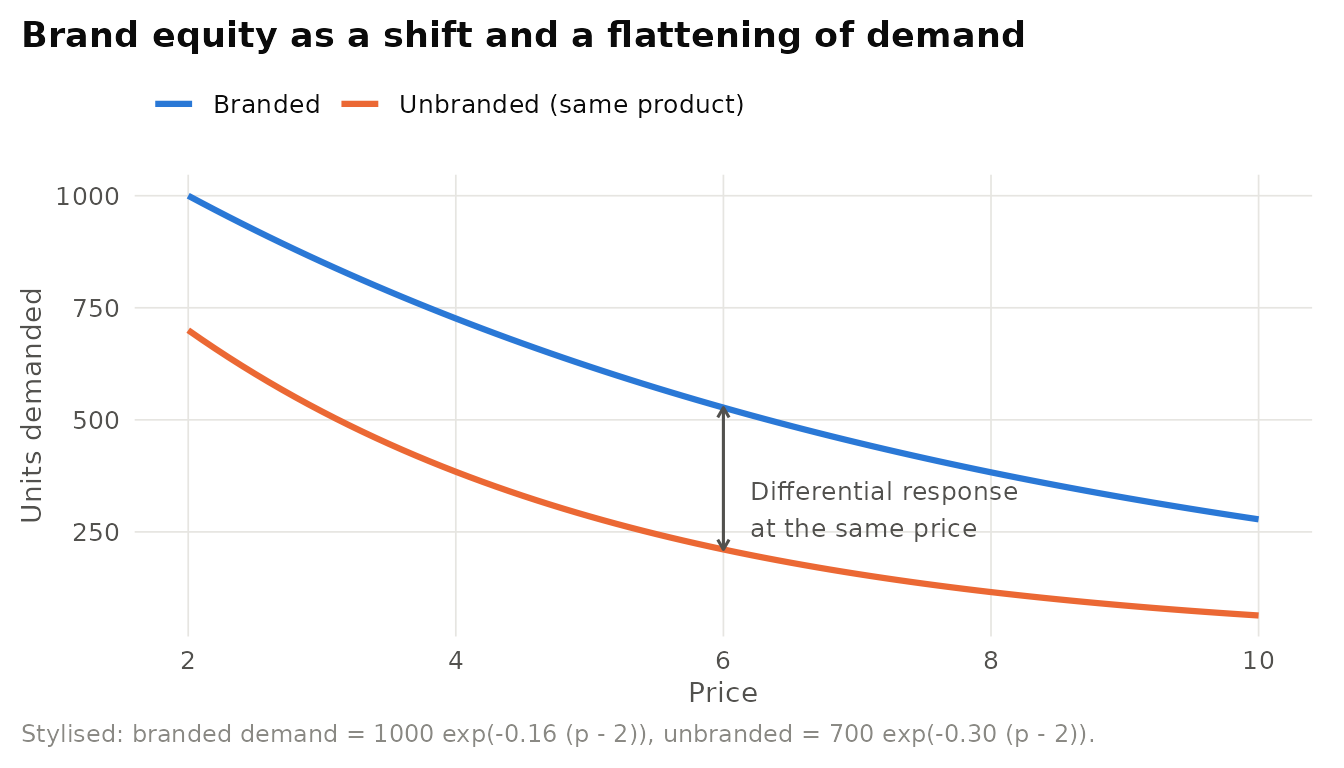
Figure 27.5: Stylised differential response. The same product sold under a strong brand name and without a brand faces different demand curves: more buyers at every price and lower price sensitivity. The vertical gap at a common price corresponds to the revenue premium measure of Ailawadi, Lehmann and Neslin (2003). Illustrative curves, not estimates.
27.3.3 Evidence and extensions
Evidence comes from three levels, summarised by Keller and Lehmann (2006) and in Table 27.4. At the customer-mindset level, survey scales measure awareness, associations, perceived quality, and loyalty (Yoo and Donthu 2001). At the product-market level, Ailawadi, Lehmann, and Neslin (2003) proposed the revenue premium, the extra revenue a brand earns relative to a private label, as an outcome measure that is objective, comparable across brands, and sensitive to changes in brand health. At the financial-market level, researchers relate brand metrics to firm value. Brand equity also predicts the success of brand extensions (D. A. Aaker and Keller 1990, Völckner and Sattler 2006), a topic we return to under schema congruity.
| Level | What is measured | Example measures | Strength | Weakness |
|---|---|---|---|---|
| Customer mindset | Awareness, associations, perceived quality, loyalty | Multidimensional brand equity scale (Yoo & Donthu, 2001), association elicitation | Diagnostic: shows why equity is high or low | Does not directly show market value |
| Product market | Price and volume premium over a benchmark | Revenue premium versus private label (Ailawadi et al., 2003), conjoint brand part-worths | Objective, comparable, tracks change | Needs a credible benchmark product |
| Financial market | Contribution of the brand to firm value | Event studies, brand value rankings | Speaks the language of finance | Hard to isolate the brand from other intangibles |
| Asset view | Loyalty, awareness, perceived quality, associations, proprietary assets | Aaker (1991) brand equity dimensions | Managerially complete | Mixes causes and outcomes |
Memory, signal, or market asset? The associative-memory account (Keller 1993) and the signaling account (Erdem and Swait 1998) make overlapping predictions but differ in mechanism. Memory accounts emphasise what consumers know and feel about a brand. Signaling accounts emphasise that brand investments are a bond the firm forfeits if it cheats, so equity should be greatest where quality is hard to observe. A second critique targets measurement proliferation: customer-mindset scales can be high while market outcomes stagnate, and many studies validate a scale against attitudes measured in the same survey. Linking mindset metrics to observed market behaviour remains the field’s central measurement challenge (Keller and Lehmann 2006).
27.3.4 Applications in business
New Coke and the location of brand equity. Coca-Cola’s 1985 reformulation was supported by blind taste tests in which the new formula was preferred. What the tests did not measure was the brand knowledge that consumers attached to the original product: associations with tradition, personal memories, and American identity. Replacing the formula threatened those associations, and the company restored the original under the Coca-Cola Classic name within months. In CBBE terms, the taste tests measured the response to the unbranded product, while the market responded to the branded product. The difference between the two is precisely what Keller’s definition calls brand equity.
Private labels and the revenue premium. Retailers’ own brands compete directly on the dimension where manufacturer brands claim superiority. Tracking the revenue premium of a national brand over the store brand in the same category, as Ailawadi, Lehmann, and Neslin (2003) propose, gives brand managers an early warning signal: a shrinking premium indicates eroding equity even when unit share is stable because of promotions.
27.3.5 Using the theory in research
Sample hypotheses.
- H1. The price elasticity of demand will be lower for brands with stronger and more unique associations, controlling for perceived quality.
- H2. The positive effect of brand equity on extension evaluations will be stronger when perceived fit is high.
- H3. The effect of brand equity on choice will be larger for experience and credence goods than for search goods (signaling account).
Established scales and measures. Multidimensional brand equity scale (Yoo and Donthu 2001). Aaker’s dimensions (D. A. Aaker 1991). Free association tasks coded for favourability, strength, and uniqueness. Revenue premium from scanner data (Ailawadi, Lehmann, and Neslin 2003).
Designs. Branded versus unbranded (or fictitious-brand) experiments. Choice models estimating brand intercepts and price coefficients. Panel data linking brand-tracking surveys to sales.
Measuring equity without the “differential”. Many studies label brand attitude, awareness, or advertising spend “brand equity”. Keller’s construct is comparative: it requires a benchmark (an unbranded, fictitious, or private-label version) and a response to marketing. Without the comparison, a study measures liking or awareness, not equity.
27.4 Brand Personality
Core claim. Consumers ascribe human personality traits to brands. In the United States these perceptions are organised along five dimensions: sincerity, excitement, competence, sophistication, and ruggedness (J. L. Aaker 1997).
Origins. Consumer psychology, adapting trait psychology and the Big Five lexical approach to brands (J. L. Aaker 1997).
Level of analysis. The brand, as perceived by consumers.
Key constructs. Brand personality dimensions and facets, brand-user imagery, self-expression.
Boundary conditions. The five-factor structure was derived from ratings aggregated across brands from many categories. It does not necessarily hold for individual brands within one category or in other cultures.
Related theories. Self-congruity, Consumer-brand relationships, Customer-based brand equity, Identity signaling (Section 8.5).
27.4.1 Core logic
J. L. Aaker (1997) defined brand personality as the set of human characteristics associated with a brand. Personality traits can be transferred to a brand directly, through the people associated with it (typical users, employees, endorsers), and indirectly, through product attributes, logo, advertising style, and price. Brand personality serves a self-expressive function: consumers can use brands to express their actual or ideal selves, which links the theory to self-congruity.
Aaker developed her scale by having a large US sample rate well-known brands on a broad set of traits and then reducing the ratings by factor analysis. Three of the resulting dimensions (sincerity, excitement, competence) resemble Big Five human personality factors, while sophistication and ruggedness have no close human counterpart and appear to capture aspirational qualities that consumers want but do not necessarily have. Table 27.5 lists the dimensions and their facets.
| Dimension | Facets | Human personality analogue | Typical positioning |
|---|---|---|---|
| Sincerity | Down-to-earth, honest, wholesome, cheerful | Agreeableness | Family, trust, care |
| Excitement | Daring, spirited, imaginative, up-to-date | Extraversion | Youth, novelty, energy |
| Competence | Reliable, intelligent, successful | Conscientiousness | Expertise, dependability |
| Sophistication | Upper class, charming | No close analogue | Luxury, refinement |
| Ruggedness | Outdoorsy, tough | No close analogue | Strength, outdoors, masculinity |
Figure 27.6 shows the illustrative brand personality profiles for two hypothetical brands in the same category, measured on Aaker’s five dimensions (1-5 scale).
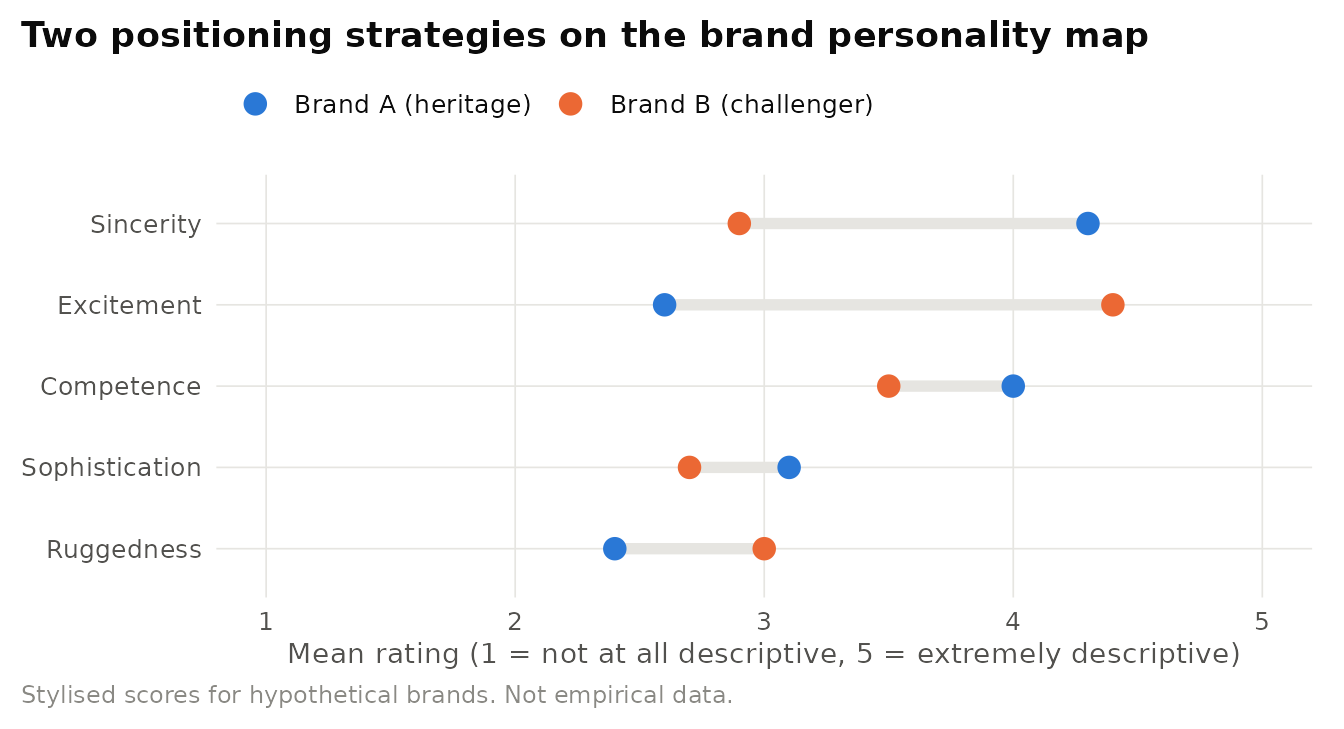
Figure 27.6: Illustrative brand personality profiles for two hypothetical brands in the same category, measured on Aaker’s five dimensions (1-5 scale). Profile comparisons like this guide positioning, but within-category differences may not reproduce the five-factor structure. Stylised data.
27.4.2 Evidence and critique
Brand personality has been linked to brand attitudes, attachment, and loyalty, and it moderates how consumers respond to brand transgressions: relationships with sincere brands can be more fragile after a transgression than relationships with exciting brands (J. Aaker, Fournier, and Brasel 2004), which we discuss in the next section. Malär et al. (2011) show that a brand personality that matches the consumer’s actual self strengthens emotional attachment.
Does the scale measure personality, and does it generalise? Three critiques dominate. First, A. Azoulay and Kapferer (2003) argue that the scale’s definition is too loose: items such as “upper class”, “intelligent”, or “successful” describe social status, competence, or user imagery rather than personality in the psychological sense. Second, Austin, Siguaw, and Mattila (2003) found that the five-factor framework did not replicate when applied to individual brands within a single product category, which is exactly the setting in which brand managers want to use it. Third, the structure varies across cultures. In response, Geuens, Weijters, and De Wulf (2009) developed a shorter measure restricted to personality traits that performs better at the level of individual brands and across categories. Researchers should choose between the scales according to the comparison they need to make.
Personifying platforms: Apple’s “Get a Mac” campaign. Between 2006 and 2009 Apple ran a long series of television spots in which two actors personified the Mac (casual, relaxed, creative) and the PC (formal, fussy, prone to problems). The campaign is an unusually literal application of brand personality: it assigned excitement and sincerity to one brand and a caricature of bureaucratic competence to its rival, and it invited viewers to choose the character they would rather be. It also illustrates the risk of personality positioning: a personality defined against a rival depends on consumers accepting the caricature, and a competitor can respond by reclaiming the traits, as Microsoft’s own counter-campaign attempted.
Sample hypotheses.
- H1. Congruence between a brand’s personality and the consumer’s actual self will predict emotional brand attachment more strongly than congruence with the ideal self, especially for consumers low in self-esteem.
- H2. An advertising style manipulation (spontaneous versus formal) will shift perceived excitement but not perceived competence.
Established scales. Aaker’s 42-item brand personality scale (J. L. Aaker 1997). The 12-item scale of Geuens, Weijters, and De Wulf (2009) for within-category comparisons.
Designs. Repeated-measures ratings of multiple brands with multilevel factor analysis (separating between-brand and within-respondent variance). Experiments manipulating personality cues in advertising or packaging.
Using the scale off the shelf for within-category positioning. Aaker’s dimensions were derived across categories. Applying them to compare three banks or four running-shoe brands, and then interpreting each dimension as if the structure held, invites the problem documented by Austin, Siguaw, and Mattila (2003). Test the factor structure in your own data, consider the Geuens, Weijters, and De Wulf (2009) alternative, and do not treat “competence” ratings of a bank as a statement about its personality rather than its perceived performance.
27.5 Consumer-Brand Relationships
Core claim. Consumers can form relationships with brands that resemble interpersonal relationships in their forms, norms, and dynamics. The brand is an active partner whose marketing actions are interpreted as behaviour, and relationship quality predicts stability, forgiveness, and loyalty (Fournier 1998).
Origins. Consumer research. Fournier (1998), using phenomenological case studies and interpersonal relationship theory. Extended by work on relationship norms (Aggarwal 2004), transgressions (J. Aaker, Fournier, and Brasel 2004), emotional attachment (Thomson, MacInnis, and Park 2005), brand attachment (Park et al. 2010), and brand love (Batra, Ahuvia, and Bagozzi 2012).
Level of analysis. Dyad (consumer and brand), embedded in communities.
Key constructs. Relationship forms, brand relationship quality (BRQ), relationship norms (exchange and communal), brand attachment (brand-self connection, prominence), brand love, transgression and repair.
Boundary conditions. Most applicable when brands carry symbolic or emotional meaning and are used repeatedly. For many low-involvement purchases, consumers have habits, not relationships.
Related theories. Commitment-trust theory (Section 9.6), Social exchange theory (Section 9.1), Self-congruity, Brand personality.
27.5.1 Origins and core logic
Fournier (1998) argued that the relationship metaphor is legitimate only if brands can act as partners. Brands do act, she reasoned, because consumers interpret marketing actions (a new advertising campaign, a price increase, a product change) as the behaviour of a partner. Through in-depth interviews with three women about the brands in their lives, Fournier identified a typology of relationship forms, from arranged marriages and casual friendships to committed partnerships, flings, dependencies, and enmities, and a model of brand relationship quality with six facets: love and passion, self-connection, interdependence, commitment, intimacy, and brand partner quality.
Later work specified the mechanisms more precisely:
- Norms. Aggarwal (2004) showed that consumers apply interpersonal relationship norms to brands. In exchange relationships, consumers expect quid pro quo. In communal relationships, they expect care, and being charged for a small favour feels like a violation.
- Transgressions. J. Aaker, Fournier, and Brasel (2004) followed consumers’ relationships with an online photo service in a longitudinal field experiment. Relationships with a brand given a sincere personality deepened over time but were damaged by a service transgression, while relationships with an exciting brand showed signs of reinvigoration after a transgression followed by repair.
- Attachment. Thomson, MacInnis, and Park (2005) developed a scale of emotional attachment to brands (affection, passion, connection). Park et al. (2010) defined brand attachment as the strength of the bond connecting the brand with the self, reflected in brand-self connection and the prominence of brand-related thoughts, and showed that attachment predicts behaviours that require consumers to invest their own resources better than attitude strength does (Figure 27.7).
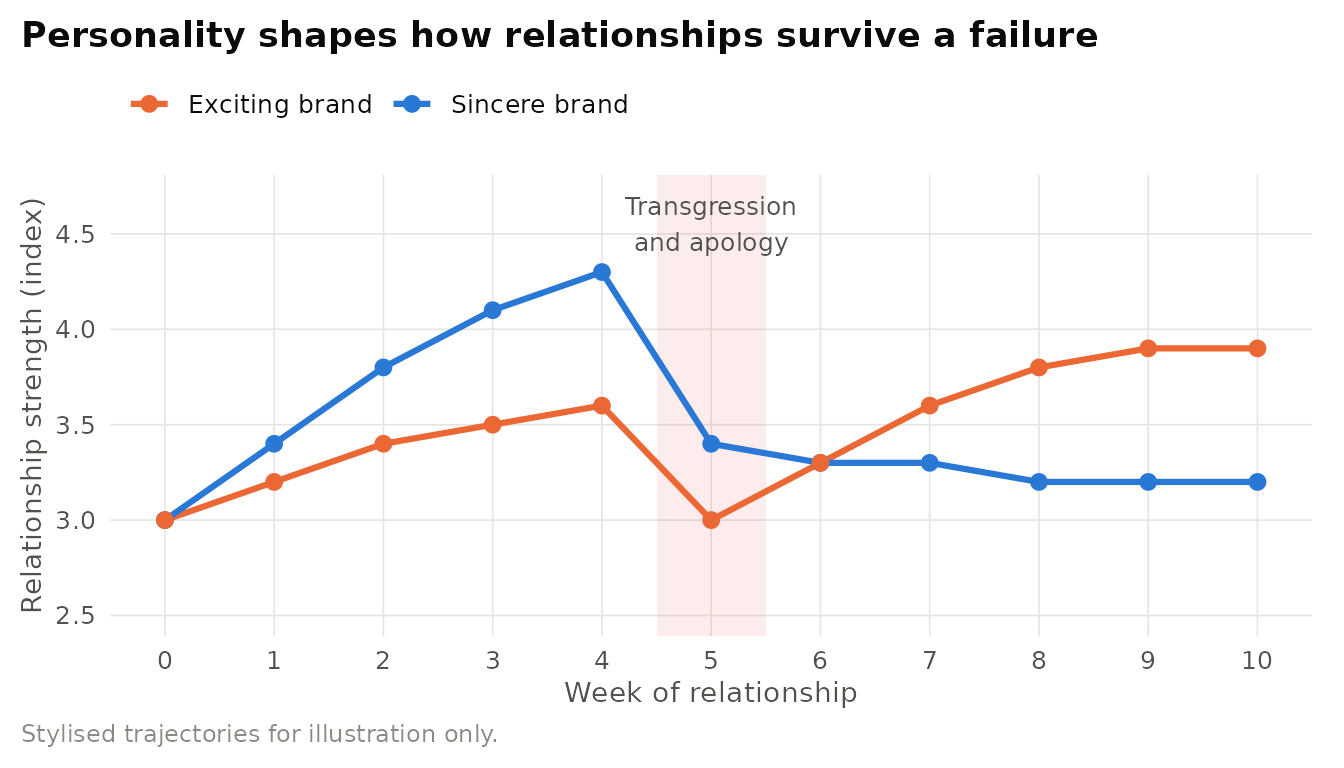
Figure 27.7: Stylised relationship trajectories after a brand transgression, following the pattern reported by Aaker, Fournier and Brasel (2004). Relationship strength with a sincere brand grows faster but does not recover after a service failure, while relationship strength with an exciting brand dips and then partially rebounds after repair. Illustrative values, not study data.
Table 27.6 presents the selected relationship forms and constructs in consumer-brand relationship research.
| Construct | Definition | Illustrative consumer statement | Source |
|---|---|---|---|
| Committed partnership | Long-term, voluntary, socially supported union with high love and intimacy | I would never switch, this brand is part of how I cook | Fournier (1998) |
| Arranged marriage | Non-voluntary union imposed by a third party, with little affect | It is the detergent my partner always buys | Fournier (1998) |
| Fling | Short-term, high emotional reward, no commitment | I tried that energy drink all summer | Fournier (1998) |
| Enmity | Intense negative affect and desire to avoid or harm the partner | I tell everyone not to use that airline | Fournier (1998) |
| Exchange norm | Benefits given in expectation of comparable return | I pay, they deliver, that is the deal | Aggarwal (2004) |
| Communal norm | Benefits given out of concern for the partner’s needs | They should help me without charging for it | Aggarwal (2004) |
| Brand attachment | Strength of the bond between brand and self (connection, prominence) | Thoughts about this brand come to me naturally | Park et al. (2010) |
| Brand love | Passion, self-brand integration, positive emotional connection, anticipated separation distress | I would feel anxious if this brand disappeared | Batra et al. (2012) |
27.5.2 Evidence and critique
The relationship perspective has been productive: it explains why loyal customers sometimes punish a beloved brand harshly after a betrayal, why communal brands face backlash when they monetise previously free services (Aggarwal 2004), and why attachment predicts costly behaviours such as recommending, defending, and paying a premium (Park et al. 2010).
Relationship or habit? Sceptics argue that the metaphor overreaches. Most purchase behaviour in repeat-purchase categories follows regularities that require no relationship construct: small brands have fewer buyers who are also somewhat less loyal, the pattern known as double jeopardy (A. S. C. Ehrenberg, Goodhardt, and Barwise 1990). On this view, “loyalty” is mostly a by-product of penetration and habit, and investments in deep relationships pay off only for a minority of customers. Relationship theorists reply that the metaphor is most useful where it was developed, for symbolically rich brands and heavy users, and that it predicts responses to transgressions and norm violations that penetration models cannot. The productive position is to treat relationship strength as a variable that is high for some consumer-brand dyads and absent for most.
27.5.3 Applications in business
Harley-Davidson and Apple: relationship brands with communities. Harley-Davidson founded the Harley Owners Group (H.O.G.) in 1983, giving owners rides, rallies, and local chapters organised around the brand. An ethnography of new bikers by Schouten and McAlexander (1995) described a subculture of consumption whose core values (personal freedom, American heritage, and machismo) were expressed through the motorcycle, clothing, and rituals, and in which the company actively participated. Muniz and O’Guinn (2001) studied brand communities around Ford Bronco, Macintosh, and Saab and identified three markers of community: consciousness of kind, shared rituals and traditions, and a sense of moral responsibility to other members. Apple users’ defence of the Mac against a dominant rival is a canonical example of the oppositional loyalty that such communities sustain. The managerial lesson from both brands is that a relationship is not only between a consumer and a brand. It is embedded in a community that the firm can support but not fully control.
Illustrative scenario: monetising a communal brand. A consumer electronics brand known for friendly, free support begins charging for phone help. The fee is modest and consistent with industry practice. Under Aggarwal (2004)’s norms account, customers in a communal relationship will perceive a norm violation, and the backlash will exceed what the money involved would predict. A better design reframes the change in exchange terms from the outset (a premium support tier) and preserves a free communal core.
Sample hypotheses.
- H1. After a service failure, customers with high brand attachment will be more forgiving of minor failures but more punitive after failures framed as betrayals of trust.
- H2. Charging for a previously free service will lower brand evaluations more under communal than under exchange relationship norms.
- H3. Brand attachment will predict share of wallet and advocacy better than brand attitude, controlling for satisfaction.
Established scales. Brand relationship quality facets (Fournier 1998). Emotional attachment scale (Thomson, MacInnis, and Park 2005). Brand attachment (connection and prominence) (Park et al. 2010). Brand love (Batra, Ahuvia, and Bagozzi 2012).
Designs. Longitudinal field experiments with manipulated brand personality and transgressions (J. Aaker, Fournier, and Brasel 2004). Relationship-norm priming experiments (Aggarwal 2004). Phenomenological interviews and netnography for discovery. Panel data on churn after service failures.
Assuming every customer wants a relationship. Relationship marketing programmes often treat all customers as potential partners. For most consumers in most categories, brand ties are weak and choice is habitual. Segment by relationship strength before investing in intimacy, and test whether relationship measures add predictive power beyond satisfaction and purchase history.
27.6 Self-Congruity Theory
Core claim. Consumers prefer products and brands whose image matches their self-concept. The match between brand-user image and self-image (self-congruity) motivates choice through the needs for self-consistency and self-esteem (Sirgy 1982). Possessions become part of an extended self (Belk 1988).
Origins. Consumer research, drawing on self theory and symbolic interactionism. Early statement by Grubb and Grathwohl (1967). Review and integration by Sirgy (1982). The extended self by Belk (1988).
Level of analysis. Individual consumer.
Key constructs. Actual self, ideal self, social self, ideal social self, brand-user image, self-congruity, self-consistency motive, self-esteem motive, self-brand connection, extended self.
Boundary conditions. Strongest for publicly consumed, symbolically rich products and for consumers high in self-monitoring or public self-consciousness. Weaker for functional, privately consumed products.
Related theories. Brand personality, Social identity theory (Section 22.2), Identity signaling (Section 8.5), Psychological ownership.
27.6.1 Core logic
Sirgy (1982) distinguished four components of the self-concept: the actual self (how I see myself), the ideal self (how I would like to see myself), the social self (how I believe others see me), and the ideal social self (how I would like others to see me). Products carry images, often stereotypes of their typical users. When product-user image matches a component of the self, consumption satisfies a motive: congruity with the actual self satisfies self-consistency, while congruity with the ideal self satisfies self-esteem. Table 27.7 summarises the logic.
| Self-concept component | Definition | Motive served by congruity | Positioning implication |
|---|---|---|---|
| Actual self | How I see myself | Self-consistency | Authentic, relatable users |
| Ideal self | How I would like to see myself | Self-esteem | Aspirational users and settings |
| Social self | How I believe others see me | Social consistency | Fit with the consumer’s reference group |
| Ideal social self | How I would like others to see me | Social approval | Visible, status-conferring cues |
Belk (1988) broadened the argument: people regard their possessions as parts of themselves. Possessions, including objects, places, people, and collections, are incorporated into an extended self, for example by controlling, creating, or coming to know them, and the involuntary loss of possessions can feel like a loss of self. Belk (2013) later extended the idea to digital possessions, online profiles, and shared digital spaces (Figure 27.8).
Figure 27.8: Mechanism of self-congruity. A brand-user image is compared with components of the self-concept. Actual-self congruity serves self-consistency and ideal-self congruity serves self-esteem, both feeding attachment and choice. Public consumption and self-monitoring strengthen the link. Based on Sirgy (1982) and Malar et al. (2011).
27.6.2 Evidence and extensions
Self-congruity predicts brand preference, store patronage, and loyalty across many categories. Three extensions refine it. First, Escalas and Bettman (2003) showed that consumers form self-brand connections with brands used by groups they belong to or aspire to join, and avoid brands associated with dissociative groups, which links the theory to Social identity theory (Section 22.2). Second, J. L. Aaker (1999) showed that the self is malleable: the traits that drive brand preference depend on which aspects of the self are made salient by the situation. Third, Malär et al. (2011) found that congruity with the actual self drives emotional brand attachment more strongly than congruity with the ideal self, with the ideal-self effect depending on involvement, self-esteem, and public self-consciousness. Aspirational branding is therefore not always the stronger strategy.
How should congruity be measured? Traditional studies rated the brand and the self on the same list of adjectives and computed a discrepancy score. Sirgy et al. (1997) argued that this method suffers from the unreliability of difference scores, the use of predetermined images that may be irrelevant to the consumer, and an implausible assumption that consumers compute congruity attribute by attribute. They proposed a direct method: respondents imagine the typical user and rate how well that image matches their own, and the direct method showed stronger predictive validity.
Actual versus ideal self in beauty advertising. For decades, beauty advertising relied on ideal-self appeals: idealised models and aspirational settings. Dove’s “Campaign for Real Beauty”, launched in 2004, used women of varied ages and body types instead, an actual-self appeal. The campaign is widely studied as a repositioning that traded the self-esteem motive for self-consistency and authenticity. The research of Malär et al. (2011) offers one explanation for why such a move can strengthen attachment: actual-self congruity tends to be the more powerful driver of emotional bonds.
Sample hypotheses.
- H1. The effect of self-congruity on brand preference will be stronger for publicly consumed than for privately consumed products.
- H2. Actual-self congruity will predict emotional brand attachment more strongly than ideal-self congruity, and the difference will be larger for consumers low in public self-consciousness.
Established measures. Direct self-congruity items (Sirgy et al. 1997). Self-brand connection scale (Escalas and Bettman 2003). Brand personality ratings for the brand and the self (J. L. Aaker 1997).
Designs. Experiments that prime the actual or ideal self. Surveys linking congruity to observed choice. Qualitative studies of the extended self and possession rituals.
Equating congruity with similarity scores. Computing the absolute difference between self and brand ratings on a fixed list of traits is the default in many studies, but it inherits the problems of difference scores and may miss the images that actually matter to the consumer. Use direct congruity measures or polynomial regression with response surface analysis when you need to model fit between two separately measured profiles.
27.7 Schema Congruity Theory
Core claim. Consumers evaluate a new product by comparing it with the schema of the category or brand it belongs to. Products that are moderately incongruent with the schema can be evaluated more favourably than fully congruent or extremely incongruent ones, because resolving a modest surprise is itself rewarding (Mandler 1982, Meyers-Levy and Tybout 1989).
Origins. Cognitive psychology (Mandler 1982), brought into consumer research by Meyers-Levy and Tybout (1989). Applied to brand extensions by D. A. Aaker and Keller (1990) and Meyers-Levy, Louie, and Curren (1994).
Level of analysis. Individual consumer evaluating a product, brand extension, or advertisement.
Key constructs. Schema, congruity, moderate incongruity, extreme incongruity, incongruity resolution, elaboration, perceived fit, dilution.
Boundary conditions. The moderate incongruity advantage requires that consumers are motivated and able to resolve the incongruity. It weakens when perceived risk is high (M. C. Campbell and Goodstein 2001) and depends on prior knowledge (Peracchio and Tybout 1996).
Related theories. Goldilocks effect (Section 29.3), Customer-based brand equity, Processing fluency (Section 23.8), Mere exposure effect (Section 29.1).
27.7.1 Origins and core logic
Mandler (1982) proposed that the value people place on an object depends partly on how well it fits the schema they bring to it. A congruent object is familiar and predictable, which produces mild positive affect. An object that is moderately incongruent creates arousal and prompts cognitive work. When the incongruity can be resolved within the existing schema, the successful resolution is experienced as positive and evaluations rise above those for congruent objects. Extreme incongruity cannot be resolved without changing the schema, and the resulting frustration tends to lower evaluations.
Meyers-Levy and Tybout (1989) tested this account with new product descriptions that matched a category schema, departed from it moderately, or departed from it extremely. Moderately incongruent products were evaluated most favourably and also generated more elaborative thought, consistent with Mandler’s resolution mechanism. The general pattern, an inverted U between incongruity and evaluation, is sketched in Figure 27.9. The same shape appears in research on attention to stimuli that are neither too simple nor too complex, the Goldilocks effect (Section 29.3).
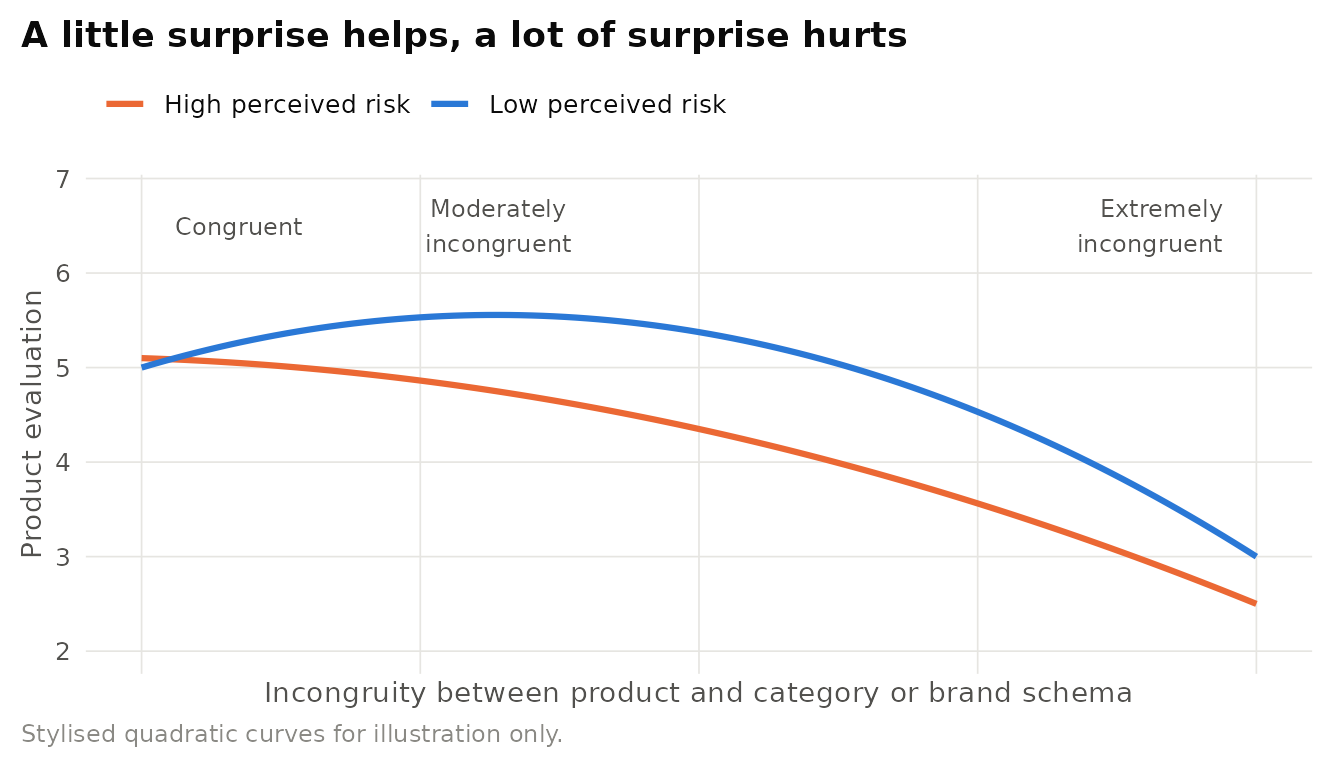
Figure 27.9: Stylised schema congruity effects. With low perceived risk, evaluations peak at moderate incongruity (resolution is rewarding). With high perceived risk, consumers prefer the norm and the advantage of moderate incongruity disappears. Pattern consistent with Meyers-Levy and Tybout (1989) and Campbell and Goodstein (2001). Illustrative curves.
27.7.2 Brand extensions as schema congruity problems
A brand extension uses an established brand name to enter a new category. The parent brand is a schema, and the extension’s fit with that schema shapes evaluations. D. A. Aaker and Keller (1990) found that extensions were evaluated more favourably when the parent brand was perceived as high quality and when the extension fit the parent, with fit reflecting complementarity, substitutability, and the transferability of the parent’s manufacturing skills. Extensions perceived as too easy to make were evaluated less favourably, as if consumers questioned what the brand added. A secondary analysis of eight studies across countries by Bottomley and Holden (2001) confirmed that parent quality and fit matter in general but that the weights vary across contexts. Völckner and Sattler (2006) identified fit between the parent brand and the extension as the most important driver of extension success, followed by marketing support, parent-brand conviction, retailer acceptance, and parent-brand experience.
Extensions also feed back into the parent schema. Loken and John (1993) showed that extensions with attributes inconsistent with the family brand’s beliefs can dilute those beliefs, especially when the extension is seen as typical of the brand. Meyers-Levy, Louie, and Curren (1994) found that brand names moderately incongruent with the extension category could produce more favourable evaluations than fully congruent names, which extends the moderate incongruity logic to naming (Table 27.8).
| Brand | Parent schema | Extension | Outcome | Schema congruity reading |
|---|---|---|---|---|
| Arm & Hammer | Baking soda: cleaning, deodorising | Toothpaste, deodorisers, laundry products | Long-lived extensions | Transfer of a core benefit makes moderate category distance resolvable |
| Honda | Engines, reliability | Cars, lawn mowers, generators | Durable multi-category brand | Fit through shared manufacturing competence |
| Porsche | Performance sports cars | Cayenne sport utility vehicle (2002) | Commercially successful despite enthusiast criticism | Moderate incongruity resolved by performance positioning |
| Starbucks | Premium coffeehouse | Bottled Frappuccino in grocery channels (with PepsiCo) | Durable line | Complementary category, coffee credentials transfer |
| Bic | Cheap, disposable pens, lighters, razors | Low-priced perfume (late 1980s) | Withdrawn, widely cited failure | Extreme incongruity: disposability clashes with the symbolism of fragrance |
| Virgin | Challenger, irreverent service brand | Virgin Cola (1990s) | Failed to win lasting share | Attitude fit, but no capability transfer against entrenched leaders |
How robust is the moderate incongruity advantage? The inverted U is attractive but conditional. Peracchio and Tybout (1996) found that prior knowledge moderates the effect: consumers with richer category knowledge can accommodate or discount incongruities and may evaluate products on their attributes instead. M. C. Campbell and Goodstein (2001) showed that when perceived risk is high, consumers prefer congruent products, a “preference for the norm”. Brand extension findings also travel imperfectly across cultures and product sets (Bottomley and Holden 2001). A further measurement concern is that studies rarely verify that participants actually resolved the incongruity, the mechanism the theory relies on. The safer claim is that moderate incongruity can be an advantage when consumers have the motivation, ability, and low risk needed to resolve it.
27.7.3 Applications in business
Brand extensions that worked and failed. Porsche’s Cayenne, launched in 2002, was a sport utility vehicle from a brand defined by sports cars. Many enthusiasts objected, but the vehicle was engineered and marketed around performance, which allowed consumers to resolve the incongruity within the Porsche schema (“a sports car that happens to be an SUV”). It became one of the brand’s highest-volume models. Bic’s late-1980s entry into perfume offers the contrast. The Bic schema of cheap, functional, disposable products could not accommodate the sensory, emotional, and status meanings of fragrance, and the line was withdrawn. The managerial test suggested by the theory is whether a consumer can complete the sentence “It makes sense for this brand because…” with a reason drawn from the parent schema.
Sample hypotheses.
- H1. Moderately incongruent brand extensions will be evaluated more favourably than congruent extensions under low perceived risk, but not under high perceived risk.
- H2. The moderate incongruity advantage will be mediated by incongruity resolution, measured as the number of resolution-related thoughts.
- H3. Atypical extensions with negative performance will dilute parent-brand beliefs less than typical extensions with negative performance.
Measures. Perceived fit (complementarity, substitutability, transfer) (D. A. Aaker and Keller 1990). Thought listing coded for elaboration and resolution (Meyers-Levy and Tybout 1989). Typicality ratings. Parent-brand belief change (Loken and John 1993).
Designs. Between-subjects experiments with pretested congruity levels. Field data on extension survival (Völckner and Sattler 2006). Secondary analysis across studies (Bottomley and Holden 2001).
Confusing incongruity with novelty or quality. An “incongruent” stimulus often also differs in attractiveness, novelty, or information content. Without pretests that hold quality constant and a check that resolution occurred, a favourable evaluation of the moderately incongruent product may reflect a better product, not the resolution mechanism.
27.8 Hedonic and Utilitarian Consumption
Core claim. Products deliver hedonic value (pleasure, fun, fantasy, sensory experience) and utilitarian value (function, instrumentality, practicality). The two kinds of value are evaluated differently: hedonic consumption evokes a stronger need for justification and more guilt, which makes choice sensitive to framing, effort, and prior virtuous acts (Hirschman and Holbrook 1982, Dhar and Wertenbroch 2000, Okada 2005, Khan and Dhar 2006).
Origins. Consumer research. Hirschman and Holbrook (1982) and Holbrook and Hirschman (1982) introduced the hedonic and experiential perspective. Dhar and Wertenbroch (2000) and later work brought it into behavioural decision research.
Level of analysis. Individual consumer, product, and attribute.
Key constructs. Hedonic value, utilitarian value, guilt, justification, licensing, effort, acquisition versus forfeiture, mode of payment.
Boundary conditions. Most products have both dimensions. Effects depend on the salience of the hedonic dimension and on whether the decision context calls for justification (joint evaluation, accountability).
Related theories. Mental accounting (Section 23.5), Self-control (Section 20.4), [Feelings-as-information](#feelings-as-information-theory) (Section 23.7) theory (Section 23.7), Warm-glow heuristic (Section 29.2).
27.8.1 Origins and core logic
Hirschman and Holbrook (1982) defined hedonic consumption as the facets of consumer behaviour that relate to the multisensory, fantasy, and emotive aspects of product experience. Together with Holbrook and Hirschman (1982), who described an experiential view of consumption built on “fantasies, feelings, and fun”, they challenged the information-processing paradigm that treated consumers as problem solvers choosing among attribute bundles. Behavioural decision researchers later asked how the two kinds of value trade off in choice.
Four propositions summarise the core findings:
- P1 (Loss aversion differs). Hedonic attributes loom larger when consumers give something up than when they acquire it. Dhar and Wertenbroch (2000) found that consumers were relatively more likely to choose a hedonic item in a forfeiture decision (which item to give up) than in an acquisition decision (which item to get).
- P2 (Justification). Hedonic options are harder to justify. Okada (2005) showed that a hedonic option tends to be rated more highly when evaluated on its own, while a utilitarian option is more often chosen when the two are compared side by side, and that consumers prefer to pay for hedonic goods with time and for utilitarian goods with money.
- P3 (Licensing). A prior virtuous act, or even the intention to act virtuously, boosts the self-concept and licenses a subsequent hedonic choice (Khan and Dhar 2006).
- P4 (Earned indulgence). Effort provides a justification. Kivetz and Simonson (2002) found that requiring more effort in a frequency programme shifted preferences toward luxury rather than necessity rewards (Figure 27.10).
Figure 27.10: Justification mechanism in hedonic consumption. Hedonic options evoke anticipated guilt and a need for justification. Justification cues (effort, prior virtue, a charitable tie-in, evaluating the option on its own) relieve that need and increase hedonic choice. Based on Okada (2005), Khan and Dhar (2006), Kivetz and Simonson (2002), and Strahilevitz and Myers (1998).
Table 27.9 presents the how hedonic and utilitarian value differ in consumer decision making.
| Dimension | Hedonic | Utilitarian | Key evidence |
|---|---|---|---|
| Nature of benefit | Pleasure, fantasy, sensory and emotional experience | Function, problem solving, instrumentality | Hirschman & Holbrook (1982) |
| Need for justification | High: evokes guilt | Low: easy to justify | Okada (2005) |
| Acquisition versus forfeiture | Weighs more when giving up | Weighs relatively more when acquiring | Dhar & Wertenbroch (2000) |
| Preferred payment | Time | Money | Okada (2005) |
| Effect of a prior virtuous act | Licensed: choice share rises | Little change | Khan & Dhar (2006) |
| Effect of required effort | Effort justifies luxury rewards | Necessity rewards preferred at low effort | Kivetz & Simonson (2002) |
| Charity incentive effectiveness | More effective | Less effective | Strahilevitz & Myers (1998) |
| Measurement | HED subscale | UT subscale | Voss et al. (2003) |
27.8.2 Evidence and extensions
The distinction is now standard in consumer research and is reviewed by Alba and Williams (2013). Strahilevitz and Myers (1998) showed that charity incentives (a donation tied to purchase) are more effective for frivolous products than for practical ones, consistent with the idea that the donation offsets guilt. The two dimensions can be measured with the HED/UT scale of Voss, Spangenberg, and Grohmann (2003), which treats them as separate attitude components rather than poles of a single continuum, and shopping itself can deliver hedonic and utilitarian value (Babin, Darden, and Griffin 1994).
Category or dimension? Much research classifies products as hedonic (chocolate, concerts) or utilitarian (detergent, printer cartridges). Critics note that the same product can be bought for either reason and that the hedonic-utilitarian distinction overlaps with other contrasts, such as vice versus virtue, wants versus shoulds, and luxuries versus necessities, which have different theoretical mechanisms (self-control, status, price). Studies that manipulate the salient goal of a purchase, or measure both dimensions with validated scales, yield cleaner inferences than studies that rely on category labels.
27.8.3 Applications in business
Hedonic purchase framing and loyalty programme design. The justification mechanism suggests several practical levers. Effort framing: points that consumers feel they have earned are more likely to be spent on indulgences, which supports offering luxury rewards (spa days, upgrades) in programmes that require sustained effort (Kivetz and Simonson 2002). Progress framing: loyalty cards that present progress as already under way increase completion (Nunes and Drèze 2006). Programme mechanics: Starbucks moved its Rewards programme in 2016 from earning per transaction to earning per dollar spent, a change that altered what customers had to do to earn a treat and illustrates how programme rules shape the effort-reward link. Cause tie-ins: the (PRODUCT)RED initiative, launched in 2006, partnered with brands such as Apple and Gap to contribute part of the proceeds from special-edition products to the Global Fund, pairing discretionary consumer products with a charitable justification, consistent with Strahilevitz and Myers (1998).
Illustrative scenario: framing a premium headphone. A retailer tests two product pages for premium noise-cancelling headphones. Page A emphasises sound quality and immersive listening (hedonic). Page B adds a utilitarian frame: “focus at work, fewer distractions on your commute”. The theory predicts that Page B lowers the need for justification and raises conversion among buyers who would otherwise feel guilty, while Page A performs better among buyers shopping for a gift, where justification concerns are weaker.
Sample hypotheses.
- H1. Requiring effort to earn a reward will increase the share of hedonic rewards chosen, and the effect will be mediated by reduced anticipated guilt.
- H2. A charitable tie-in will raise purchase likelihood more for products rated high on the HED subscale than for products rated high on the UT subscale.
- H3. Joint display of a hedonic and a utilitarian option will reduce the hedonic choice share relative to sequential display.
Established scales. HED/UT scale (Voss, Spangenberg, and Grohmann 2003). Hedonic and utilitarian shopping value (Babin, Darden, and Griffin 1994).
Designs. Choice experiments manipulating effort, prior virtue, and evaluation mode. Field experiments in loyalty programmes. Panel data on redemption choices.
Labelling categories instead of measuring value. Classifying a product as “hedonic” because it is chocolate, or “utilitarian” because it is a laptop, ignores that consumers buy laptops for gaming and chocolate as a gift. Measure the hedonic and utilitarian dimensions for the target consumers, and separate the hedonic-utilitarian contrast from vice-virtue and luxury-necessity contrasts when theorising mechanism.
27.9 Psychological Ownership
Core claim. People can feel that a target (an object, an idea, a brand, an organisation) is “theirs” without legal title. This feeling of psychological ownership arises from control, intimate knowledge, and investment of the self, and it raises valuation, attachment, and responsibility for the target (Pierce, Kostova, and Dirks 2001).
Origins. Organisational behaviour (Pierce, Kostova, and Dirks 2001, 2003), extended to consumers by research on touch (Peck and Shu 2009), the endowment effect (Shu and Peck 2011, Reb and Connolly 2007), and consumer empowerment (Fuchs, Prandelli, and Schreier 2010).
Level of analysis. Individual (with collective variants).
Key constructs. Feelings of ownership, routes (control, intimate knowledge, investment of self), motives (efficacy, self-identity, having a place), valuation, territoriality.
Boundary conditions. Requires a target that can be controlled, known, or invested in. Effects can turn negative, as territoriality, when ownership feels threatened.
Related theories. Endowment effect (Section 23.4), IKEA effect (Section 29.7), Self-congruity, Self-determination theory (Section 19.6).
27.9.1 Core logic
Pierce, Kostova, and Dirks (2001) defined psychological ownership as the state in which individuals feel as though the target of ownership, or a piece of it, is theirs. They proposed that the state serves three motives: efficacy and effectance (being in control), self-identity (expressing and maintaining the self), and having a place (a home or territory). Three routes produce it: controlling the target, coming to know it intimately, and investing the self in it through effort, time, or creativity. Figure 27.11 shows the mechanism and its consumer outcomes.
Figure 27.11: Routes to psychological ownership and their consumer outcomes. Touch, customisation, co-creation, and use produce feelings of ownership through control, intimate knowledge, and self-investment. Based on Pierce, Kostova and Dirks (2001) and Peck and Shu (2009).
27.9.2 Evidence
Peck and Shu (2009) showed that merely touching an object increases perceived ownership and valuation, and that vivid imagery of touching can substitute for touch when physical contact is not possible. Reb and Connolly (2007) separated legal ownership from physical possession and found that feelings of ownership tracked valuations, which places psychological ownership at the heart of the Endowment effect (Section 23.4). Shu and Peck (2011) showed that psychological ownership and the affective reactions it produces help explain the size of the endowment effect. Investment of the self is the mechanism behind the IKEA effect (Section 29.7): people value products they have assembled themselves more highly (Norton, Mochon, and Ariely 2012). Fuchs, Prandelli, and Schreier (2010) found that consumers empowered to select which products a firm should produce showed stronger demand for those products, with psychological ownership mediating the effect. Jussila et al. (2015) review the marketing literature, and Morewedge et al. (2021) argue that the shift from owning to accessing (streaming, renting, sharing) reduces the routes to psychological ownership, with consequences for how much consumers value and care for what they use.
Designing for “mine”. Retailers and brands use each route. Touch and trial: open displays, in-store demonstrations, test drives, and generous home-trial periods let consumers control and get to know a product before purchase (Peck and Shu 2009). Customisation: configurators such as Nike’s online customisation service let buyers invest the self in a product’s design. Co-creation: LEGO Ideas invites fans to submit and vote on set designs, giving participants a stake in products they did not legally own, consistent with Fuchs, Prandelli, and Schreier (2010). The theory also warns of a cost: customers with strong feelings of ownership can react territorially when a firm changes “their” product or community, as many brand-community backlashes show.
Sample hypotheses.
- H1. Allowing consumers to customise a product will raise willingness to pay, mediated by psychological ownership.
- H2. The effect of touch on valuation will be stronger for products with positive than with neutral sensory properties.
- H3. Access-based consumers (subscribers) will report lower psychological ownership and take less care of products than owners.
Measures. Psychological ownership items adapted from Van Dyne and Pierce (2004) (“I feel this is my product”). Willingness to pay and willingness to accept.
Designs. Touch versus no-touch experiments (Peck and Shu 2009). Empowerment manipulations (Fuchs, Prandelli, and Schreier 2010). Field experiments with trial periods.
Equating psychological ownership with legal ownership or liking. The construct is a feeling of possession, distinct from legal title and from attitude. Studies that infer it from ownership status or brand liking cannot test the theory. Measure the feeling directly and show that it mediates the outcome.
27.10 Variety Seeking
Core claim. Consumers sometimes switch away from a familiar or preferred option not because of a better offer but because variety itself has value, or because they misforecast how much variety they will want (McAlister and Pessemier 1982, Simonson 1990).
Origins. Consumer research and economics of choice. Typology by McAlister and Pessemier (1982). Diversification bias by Simonson (1990) and D. Read and Loewenstein (1995). Choosing less-preferred options for variety by Ratner, Kahn, and Kahneman (1999).
Level of analysis. Individual consumer, product category.
Key constructs. Derived versus direct variety, satiation, stimulation seeking, optimum stimulation level, diversification bias, sensory-specific satiety.
Boundary conditions. Strongest for hedonic, sensory, and frequently purchased categories, for simultaneous choices made for future consumption, and for consumers with a high optimum stimulation level.
Related theories. Hedonic adaptation (Section 25.2), Coolidge effect (Section 29.4), Choice architecture (Section 23.10), Hedonic and utilitarian consumption.
27.10.1 Core logic
McAlister and Pessemier (1982) distinguished derived varied behaviour, which results from external forces (several household members, changing situations, price promotions, new products), from direct variety seeking, in which variety itself is the goal. Direct variety seeking can be intrapersonal (satiation with an attribute, the desire for stimulation) or interpersonal (affiliation with or distinction from others). Table 27.10 summarises the typology.
| Type | Driver | Example | Managerial implication |
|---|---|---|---|
| Derived: multiple needs | Different users or uses in a household | One yoghurt for children, another for adults | Not true variety seeking: target uses |
| Derived: changing constraints | Promotions, stockouts, new products | Switching to whichever brand is on deal | Switching reflects price, not taste |
| Direct: intrapersonal | Satiation with attributes, stimulation seeking | Rotating snack flavours | Offer flavour or format variety within the brand |
| Direct: interpersonal | Affiliation with or distinction from others | Trying what friends drink, or avoiding it | Link to identity signaling and social influence |
Variety seeking is not always a stable preference. Simonson (1990) showed that consumers who choose several items at once for future consumption choose more variety than those who choose one item at a time, a pattern D. Read and Loewenstein (1995) called diversification bias and demonstrated even among children choosing Halloween candy. Ratner, Kahn, and Kahneman (1999) found that people choose less-preferred songs for the sake of variety, even though doing so lowers their enjoyment during consumption. At the attribute level, Inman (2001) showed that variety seeking follows sensory-specific satiety: consumers switch flavours more than brands. Individual differences matter as well: consumers with a high optimum stimulation level engage in more exploratory behaviour, including variety seeking (Raju 1980, Steenkamp and Baumgartner 1992), and category characteristics shape how much true variety seeking occurs (van Trijp, Hoyer, and Inman 1996) (Figure 27.12).
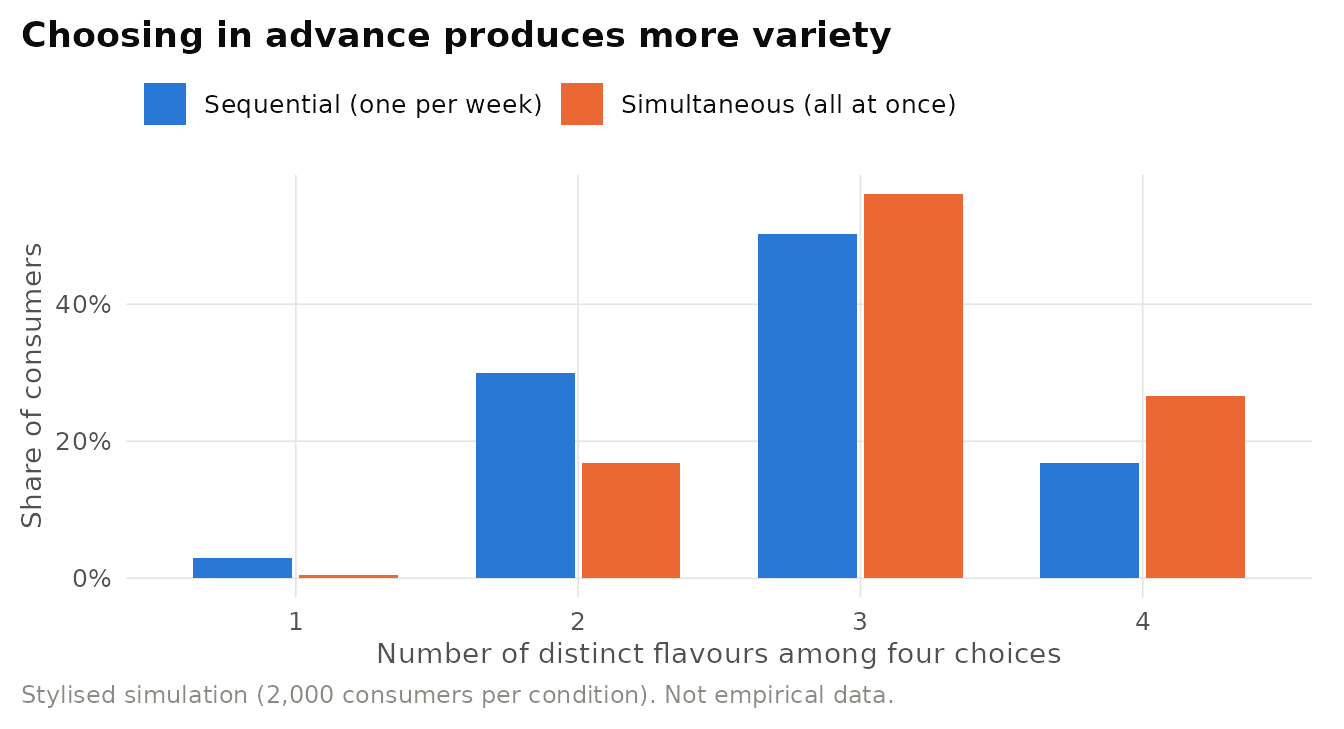
Figure 27.12: Illustrative simulation of diversification bias. Simulated consumers choose four snacks from six flavours either simultaneously (all at once, for the next four weeks) or sequentially (one each week). Simultaneous choosers spread choices across more distinct flavours, the pattern reported by Simonson (1990) and Read and Loewenstein (1995). Stylised parameters.
Illustrative scenario: subscription boxes and flavour rotation. A snack subscription asks customers to choose a month of snacks at once. Diversification bias predicts that they will pick more variety than they will enjoy, which can raise later dissatisfaction with less-preferred items. Two design responses follow from the theory: allow week-by-week swaps (converting simultaneous into sequential choice), or default the box to a mix weighted toward each customer’s revealed favourites. Snack and beverage brands also exploit genuine sensory-specific satiety with rotating limited-edition flavours that keep variety seekers inside the brand rather than switching to a competitor.
Sample hypotheses and designs. H1. Bundled, advance purchases will contain more distinct items than repeated single purchases by the same consumers. H2. Brand switching driven by satiation will occur more at the flavour than at the brand level (Inman 2001). Use scanner panels to separate true variety seeking from promotion-driven switching, choice experiments contrasting simultaneous and sequential choice (Simonson 1990), and optimum stimulation level scales (Raju 1980, Steenkamp and Baumgartner 1992).
Calling every switch variety seeking. Brand switching in panel data often reflects promotions, stockouts, or multiple household users, which McAlister and Pessemier (1982) classify as derived varied behaviour. Control for price and availability before attributing switching to a taste for variety.
27.11 Reference Price Theory
Core claim. Consumers judge a price against a reference price, an internal standard formed from past prices or an external standard supplied by the environment. Prices below the reference are coded as gains and prices above it as losses, and losses affect choice more strongly than equivalent gains (Winer 1986, Kalyanaram and Winer 1995, Mazumdar, Raj, and Sinha 2005).
Origins. Behavioural pricing and marketing science, drawing on adaptation-level theory, Prospect theory (Chapter 24) (Kahneman and Tversky 1979), and transaction utility in Mental accounting (Section 23.5) (R. Thaler 1985). Brand choice models by Winer (1986). Reviews by Kalyanaram and Winer (1995) and Mazumdar, Raj, and Sinha (2005).
Level of analysis. Individual consumer, aggregated to brand demand and retail pricing policy.
Key constructs. Internal reference price, external reference price, price expectation, gain and loss, loss aversion, transaction utility, promotion frequency.
Boundary conditions. Strongest for frequently purchased goods with salient price histories and for consumers who track prices. Reference effects are harder to identify when consumers differ widely in price sensitivity (Bell and Lattin 2000).
Related theories. Prospect theory (Chapter 24), Loss aversion (Section 24.4), Anchoring effect (Section 29.9), Mental accounting (Section 23.5), Decoy effect (Section 29.8).
27.11.1 Core logic and propositions
Classical demand theory predicts that consumers respond to the current price. Reference price theory adds that they respond to the current price relative to a standard. Winer (1986) built this idea into a brand choice model for frequently purchased products, in which the reference price is a consumer’s expectation formed from the brand’s past prices, and choice depends on both the observed price and its deviation from the reference. Mayhew and Winer (1992) showed with scanner data that both internal (memory-based) and external (point-of-purchase) reference prices affect choice.
- P1 (Reference dependence). Holding price constant, purchase probability rises when price is below the reference price and falls when it is above (Winer 1986, Kalyanaram and Winer 1995).
- P2 (Adaptive formation). Internal reference prices are formed largely from the brand’s own past prices. Briesch et al. (1997) compared alternative specifications and found that models based on the brand’s past prices fit best.
- P3 (Asymmetry). Consumers react more to prices above the reference (losses) than to prices below it (gains) (Hardie, Johnson, and Fader 1993, Kalyanaram and Winer 1995), an application of Loss aversion (Section 24.4).
- P4 (External anchors). Advertised regular or “compare at” prices raise perceived value and lower search, even when the reference is exaggerated (Urbany, Bearden, and Weilbaker 1988, Grewal, Monroe, and Krishnan 1998).
- P5 (Promotion erosion). Because reference prices adapt, frequent promotions lower the internal reference price, so that the regular price later feels like a loss.
Figure 27.13 illustrates P5 with an adaptive reference price. Under frequent promotions, the reference price drifts toward the deal price, and every return to the regular price becomes a perceived loss.
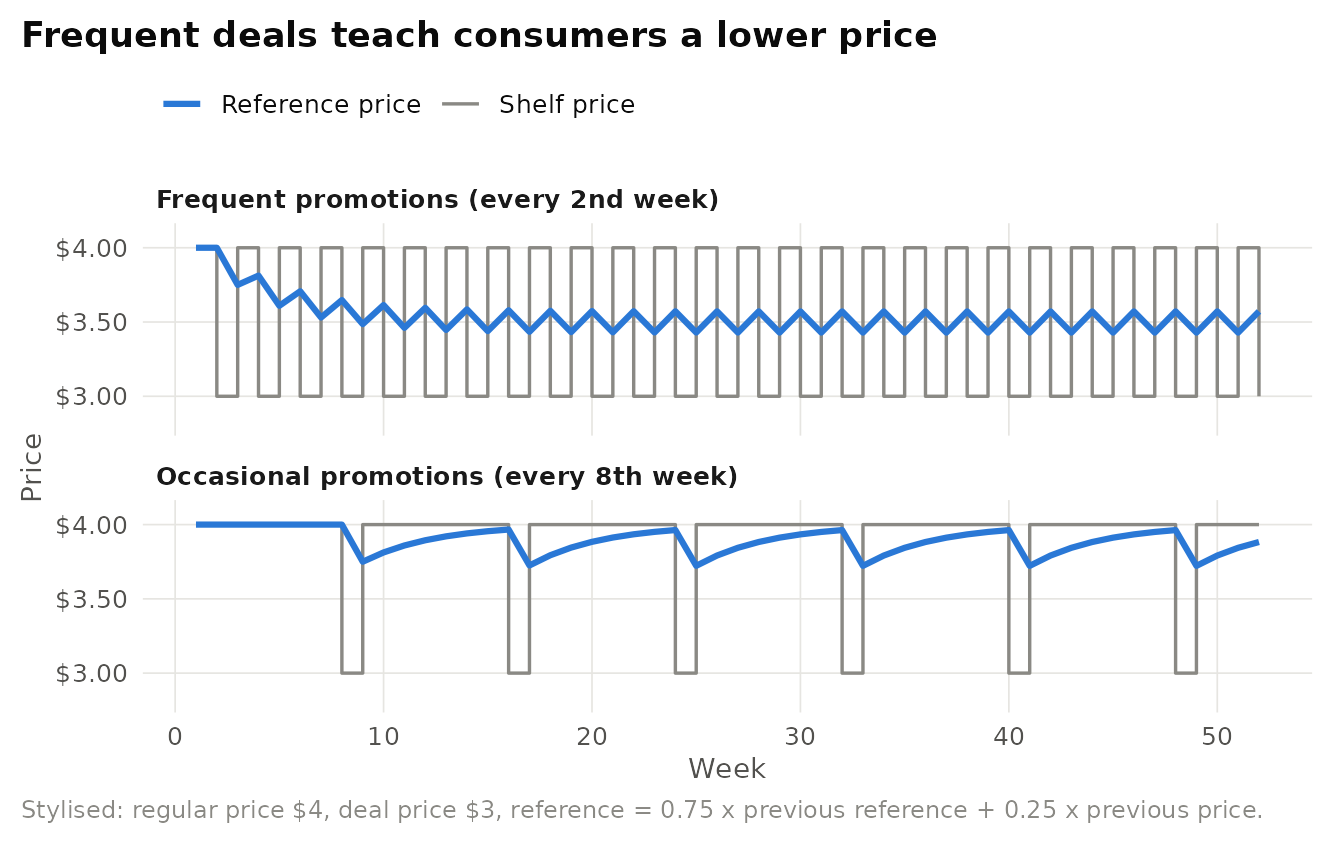
Figure 27.13: Illustrative adaptive reference prices under two promotion policies. The reference price is an exponentially weighted average of past prices. Frequent promotions pull the reference price toward the deal price, so the regular price is increasingly coded as a loss. Stylised simulation.
Table 27.11 presents the internal and external reference prices (organised following Mazumdar, Raj, and Sinha, 2005).
| Feature | Internal reference price | External reference price |
|---|---|---|
| Definition | A price standard held in memory | A price standard presented in the purchase environment |
| Typical sources | Past prices paid or seen, expected price, perceived fair price | Advertised regular price, ‘compare at’ price, competitor prices, price of adjacent items |
| Formation | Adaptive, updated by recent prices | Supplied by the seller or context at the point of purchase |
| Typical measures | Exponentially smoothed past prices, stated expected price | Experimental manipulation of advertised reference prices |
| Managerial lever | Promotion depth and frequency, price consistency | Price-comparison advertising, assortment and display |
| Regulatory concern | Low | High: fictitious former prices can be deceptive |
| Key sources | Winer (1986), Briesch et al. (1997) | Urbany et al. (1988), Grewal et al. (1998) |
27.11.2 Evidence and critique
Kalyanaram and Winer (1995) summarised a set of empirical generalisations: reference prices affect brand choice, past prices are a central input to their formation, and the response to price losses is larger than the response to gains. Mazumdar, Raj, and Sinha (2005) organise the literature around how reference prices are formed, how they are retrieved, and how they affect evaluations and choice, and they offer propositions for future research.
Is loss aversion in scanner data real? Bell and Lattin (2000) showed that heterogeneity in price sensitivity can masquerade as loss aversion. Price-sensitive households tend to buy when prices are low (gains) and price-insensitive households when prices are high (losses), so a pooled model can find asymmetric responses even when no individual is loss averse. Once heterogeneity was accounted for, estimated loss aversion shrank substantially. The debate does not overturn reference dependence, but it means that asymmetry estimates from aggregate data require careful modelling of consumer heterogeneity. A second debate concerns which standard consumers actually use: the brand’s own past prices, the category’s prices, or the external price at the shelf (Briesch et al. 1997, Mayhew and Winer 1992).
27.11.3 Applications in business
Outlet stores and “compare at” prices. Outlet malls allow manufacturers to segment price-sensitive shoppers who will travel and accept less service from consumers who buy at full-price stores (Coughlan and Soberman 2005). Price tags in outlets often display a “compare at” or “original” price alongside the selling price. Reference price theory explains why: an external reference raises perceived transaction value even when consumers discount it (Urbany, Bearden, and Weilbaker 1988, Grewal, Monroe, and Krishnan 1998). The same mechanism creates regulatory risk. The US Federal Trade Commission’s guides against deceptive pricing address former-price comparisons, and in 2014 several members of the US Congress asked the Commission to examine whether outlet pricing and labelling misled shoppers, partly because some outlet goods are made specifically for outlets and were never sold at the reference price. For managers, the lesson is that reference prices create value only while they remain credible.
JCPenney’s “Fair and Square” pricing. In 2012 the US department store chain JCPenney, under a new chief executive, replaced most of its frequent sales and coupons with simpler everyday prices. The strategy assumed that shoppers disliked the promotional game. Sales and store traffic fell steeply, the chief executive was replaced in 2013, and promotions returned. Reference price theory and transaction utility (R. Thaler 1985) suggest why: years of promotions had taught customers low internal reference prices and a habit of enjoying the “deal”. Removing external reference prices eliminated the perceived gain without lowering the price consumers expected to pay.
Sample hypotheses.
- H1. The effect of a price increase on brand choice will be larger than the effect of an equivalent price decrease, after controlling for household heterogeneity in price sensitivity.
- H2. Increasing promotion frequency will lower consumers’ stated expected price for the brand.
- H3. Plausible external reference prices will raise perceived transaction value more than implausible ones, and the effect will be weaker among consumers with high price knowledge.
Measures. Internal reference price from exponentially smoothed past prices (Winer 1986, Briesch et al. 1997). Stated expected and fair prices. Acquisition and transaction value scales (Grewal, Monroe, and Krishnan 1998).
Designs. Brand choice models with reference price terms estimated on scanner panels, with latent-class or random-coefficient heterogeneity (Bell and Lattin 2000). Experiments manipulating advertised reference prices (Urbany, Bearden, and Weilbaker 1988). Field experiments varying promotion schedules.
Estimating loss aversion from pooled data. Asymmetric price responses in aggregate data can arise from heterogeneity, endogenous purchase timing, and stockpiling rather than loss aversion. Model heterogeneity, account for purchase timing, and treat asymmetry as a hypothesis to be tested rather than a parameter to be assumed.
27.12 Consumer Culture Theory
Core claim. Consumption is a cultural practice. Consumers use goods, brands, and services to construct identities, form communities, and negotiate social structures and ideologies, and the meanings of goods are produced and circulated by culture, firms, and consumers together (Arnould and Thompson 2005).
Origins. Interpretive consumer research drawing on anthropology, sociology, and cultural studies (McCracken 1986, Belk, Wallendorf, and Sherry 1989, Holt 2002). The label “consumer culture theory” was introduced by Arnould and Thompson (2005) to name a family of perspectives rather than a single theory.
Level of analysis. Individual, community, market, and society.
Key constructs. Cultural meaning, meaning transfer, consumption rituals, identity projects, marketplace cultures and subcultures, brand communities, cultural capital, marketplace ideologies, authenticity.
Boundary conditions. Best suited to explaining meaning, identity, and practice. It aims at theoretical transferability across contexts rather than statistical generalisation, and it is less suited to predicting the size of effects.
Related theories. Self-congruity, Consumer-brand relationships, Social identity theory (Section 22.2), Institutional theory (Section 7.2), Identity signaling (Section 8.5).
27.12.1 Origins and core logic
McCracken (1986) offered the foundational account of how goods acquire meaning. Cultural meaning resides first in the culturally constituted world, the categories and principles through which a society organises experience. Two institutions, advertising and the fashion system, transfer that meaning into consumer goods. Consumers then draw meaning from goods into their own lives through rituals: possession, exchange (such as gift giving), grooming, and divestment. McCracken (1989) applied the same logic to celebrity endorsement: celebrities carry meanings from their roles, which advertising transfers to products and consumption transfers to consumers. Figure 27.14 shows the model.
Figure 27.14: McCracken’s (1986) model of the movement of cultural meaning. Meaning moves from the culturally constituted world into goods through advertising and the fashion system, and from goods into consumers’ lives through possession, exchange, grooming, and divestment rituals.
Arnould and Thompson (2005) reviewed two decades of interpretive research and organised it into four research programmes (Table 27.12). The common thread is that consumers are not merely choosers among attribute bundles but active producers of meaning who work with, and sometimes against, the meanings that marketers offer. Holt (2002) developed this point into a dialectical theory of branding: consumers increasingly resist brands they perceive as cultural engineering, and brands retain value when they serve as authentic cultural resources for consumers’ own identity projects. In later work, Holt (2004) argued that iconic brands succeed by offering myths that address contradictions in a society’s culture at particular historical moments.
| Research programme | Central question | Illustrative study | Managerial relevance |
|---|---|---|---|
| Consumer identity projects | How do consumers use market resources to construct coherent selves? | Extended self (Belk, 1988) | Positioning brands as identity resources |
| Marketplace cultures | How do consumers forge communities and subcultures around consumption? | Harley-Davidson bikers (Schouten & McAlexander, 1995), brand communities (Muniz & O’Guinn, 2001) | Community management, co-creation |
| Sociohistoric patterning of consumption | How do class, gender, ethnicity, and institutions structure consumption? | Cultural capital and taste (Holt, 1998) | Segmentation beyond demographics |
| Mass-mediated marketplace ideologies | How do consumers interpret, adopt, or resist commercial meanings? | Doppelganger brand images (Thompson et al., 2006) | Monitoring brand meaning and backlash |
27.12.2 Evidence and critique
CCT research has produced influential concepts: the sacred and profane in consumption (Belk, Wallendorf, and Sherry 1989), subcultures of consumption (Schouten and McAlexander 1995), brand communities (Muniz and O’Guinn 2001), the structuring role of cultural capital in taste (Holt 1998), and the doppelganger brand image, a parody of a brand’s image circulated by critics that signals when emotional branding has lost authenticity (C. J. Thompson, Rindfleisch, and Arsel 2006). Methodologically, it introduced ethnography, phenomenological interviewing, and netnography, the ethnographic study of online communities (Kozinets 2002), into marketing.
Theory or label, and how much context? Sceptics from the positivist tradition question whether findings from small, purposive samples generalise, and whether a “family of perspectives” is a theory at all. Defenders respond that CCT seeks analytic rather than statistical generalisation and that its concepts have proved transferable across markets. A critique from within the tradition is equally pointed. Askegaard and Linnet (2011) argue that CCT has focused too heavily on individual consumers’ lived experience and needs to attend to the “context of context”: the social, historical, and institutional structures that shape what consumers can experience in the first place.
Meaning transfer in celebrity endorsement and cultural branding. Nike’s Air Jordan line, launched in 1985 around a then-rookie basketball player, is a textbook case of McCracken’s meaning transfer: the athlete’s cultural meanings (excellence, style, defiance) moved into the product through advertising and into consumers’ lives through use, collecting, and display (McCracken 1989). CCT also explains the limits of such strategies. When consumers perceive a brand’s meanings as manufactured, they produce counter-meanings, the doppelganger images that C. J. Thompson, Rindfleisch, and Arsel (2006) identified around Starbucks. The managerial implication is to monitor not only what the brand says but also what consumers and critics are saying about it, and to ground brand meaning in practices consumers can recognise as authentic (Holt 2002).
Typical research questions and propositions. CCT studies usually build theory rather than test hypotheses, but they generate propositions that other methods can test, for example: P1. Brand communities that share rituals and a sense of moral responsibility will show greater resistance to competitor switching than communities based only on product use. P2. Consumers with high cultural capital will favour brands whose meanings are subtle and require interpretive knowledge.
Designs and data. Ethnography and participant observation (Schouten and McAlexander 1995). Phenomenological interviews. Netnography of online communities (Kozinets 2002). Historical and archival analysis of advertising and media. Mixed methods that pair interpretive discovery with survey or experimental tests.
Using interpretive research as decoration. A handful of quotations does not make a CCT study. The tradition’s contribution comes from sustained engagement with a context, theoretically motivated sampling, and an explicit account of how meanings are produced and contested. Conversely, quantitative researchers should not dismiss CCT findings for lacking statistical generalisation: they are best treated as theoretical mechanisms to be tested and bounded.
27.13 Chapter Summary
- Satisfaction is a relative judgment. Expectations, performance, and their comparison all matter, and shortfalls hurt more than surpluses help (R. L. Oliver 1980, E. W. Anderson and Sullivan 1993).
- Product attributes matter because they lead to consequences and values, and laddering reveals these chains (Gutman 1982, Reynolds and Gutman 1988).
- Brand equity is a differential response to marketing that originates in brand knowledge, and it should be measured against a benchmark (Keller 1993, D. A. Aaker 1991).
- Brands acquire personalities and become relationship partners whose transgressions, norms, and attachment shape loyalty (J. L. Aaker 1997, Fournier 1998, Park et al. 2010).
- Consumers prefer brands that fit their self-concept, and possessions become part of an extended self (Sirgy 1982, Belk 1988).
- Moderate incongruity with a schema can be an advantage, but only when consumers can resolve it and risk is low (Meyers-Levy and Tybout 1989, M. C. Campbell and Goodstein 2001).
- Hedonic consumption requires justification, so effort, prior virtue, and charity tie-ins change choices (Dhar and Wertenbroch 2000, Okada 2005, Khan and Dhar 2006).
- Psychological ownership and variety seeking explain valuation and switching beyond price and quality (Pierce, Kostova, and Dirks 2001, Simonson 1990).
- Prices are judged against reference prices, and promotions reshape those standards (Winer 1986, Mazumdar, Raj, and Sinha 2005).
- Consumer culture theory treats consumption as meaning-making that firms shape but do not control (McCracken 1986, Arnould and Thompson 2005).
Table 27.13 presents the comparison of the chapter’s theories.
| Theory | Key mechanism | Signature prediction | Typical business use |
|---|---|---|---|
| Expectancy-disconfirmation | Comparison with expectations | Shortfalls hurt more than surpluses help | Satisfaction measurement, expectation management |
| Means-end chain | Attribute to consequence to value | Value-level appeals outperform attribute claims for involving products | Positioning, advertising strategy |
| Customer-based brand equity | Brand knowledge in memory | Same marketing works better for the brand than for an unbranded version | Brand tracking, price premiums |
| Brand personality | Trait inference and self-expression | Personality shapes attitudes and relationship dynamics | Brand identity, creative briefs |
| Consumer-brand relationships | Relationship norms and attachment | Transgression effects depend on relationship type | CRM, communities, crisis response |
| Self-congruity | Self-consistency and self-esteem | Preference for brands matching the self | Target user imagery |
| Schema congruity | Incongruity resolution | Inverted U in evaluations | Brand extensions, new product design |
| Hedonic and utilitarian consumption | Guilt and justification | Justification cues raise hedonic choice | Loyalty rewards, cause marketing, framing |
| Psychological ownership | Control, knowledge, self-investment | Touch and customisation raise valuation | Trials, configurators, co-creation |
| Variety seeking | Satiation and anticipated satiation | More variety in simultaneous choices | Assortment, flavour rotation, subscriptions |
| Reference price | Gains and losses against a standard | Frequent deals lower reference prices | Promotion policy, price communication |
| Consumer culture theory | Cultural meaning transfer and resistance | Brands thrive as authentic cultural resources | Cultural branding, community strategy |
27.14 Discussion Questions
- A hotel chain’s satisfaction scores fall after a successful advertising campaign while service quality is unchanged. Use expectancy-disconfirmation theory to explain the pattern and design a study to test your explanation.
- Conduct three short laddering interviews about a product you recently bought. Draw a hierarchical value map. Which level of the ladder offers the best positioning opportunity, and why?
- Keller defines brand equity as a differential response. Design a study that measures brand equity for a national brand of breakfast cereal at the customer-mindset and product-market levels. What benchmark will you use?
- Aaker, Fournier, and Brasel found that sincere and exciting brands respond differently to transgressions. How should a crisis communication plan differ for the two kinds of brands? State a testable hypothesis.
- Choose a brand extension announced in the past five years. Predict its success using schema congruity theory and the drivers identified by Völckner and Sattler. What evidence would falsify your prediction?
- A retailer plans to cut its promotion frequency in half. Using reference price theory, forecast the short-run and long-run effects on sales and perceived value, and explain how you would separate loss aversion from consumer heterogeneity in the data.
27.15 Further Reading
- R. L. Oliver (1980): the classic statement of expectancy-disconfirmation and the starting point for satisfaction research.
- Keller (1993): the foundational definition of customer-based brand equity and its memory-based logic.
- J. L. Aaker (1997): the brand personality scale, best read together with the critique in A. Azoulay and Kapferer (2003).
- Fournier (1998): the paper that legitimised the study of consumer-brand relationships, rich in qualitative detail.
- Meyers-Levy and Tybout (1989): a compact and elegant test of schema congruity with a clear mechanism.
- Mazumdar, Raj, and Sinha (2005): the most comprehensive review of reference price research, with testable propositions.
- Arnould and Thompson (2005): the map of consumer culture theory and its research programmes.
- Alba and Williams (2013): a review of hedonic consumption that connects the hedonic-utilitarian distinction to broader research on pleasure.