31 Models and Frameworks
A product team redesigns its onboarding flow and finds that new users remember less, not more, after a richer tutorial. A strategy team is asked whether to enter an industry with booming demand yet notoriously thin margins. An innovation manager must decide whether to fund the project that combines familiar technologies in a new way or the one that invents a component from scratch. A retailer debates whether slower background music is worth the licence fee. None of these decisions requires a new theory. Each requires a good framework: a structured way of laying out the parts of a problem, the relationships among them, and the questions to ask before acting.
Social scientists use the terms theory, model, and framework loosely, but the distinctions are useful. A theory explains why constructs are related and specifies the boundary conditions of that explanation (Whetten 1989). A model is a simplified representation of a specific system, often formal, such as a multi-store model of memory or a growth model of recombination. A framework is broader and more modest: it names the elements that matter and organizes inquiry, without always committing to a single causal mechanism. Frameworks earn their place in a theory book because they are where theory meets practice: managers rarely apply a theory directly, but they constantly apply frameworks built from theories.
This chapter presents five frameworks that recur across the book and in business practice. The information processing model describes how people encode, store, and retrieve information. The Geneplore model describes the cognitive cycle of creative generation and exploration, and combinatorial creativity scales that logic up to the recombination of knowledge in science, technology, and markets. Porter’s five forces, with its companion the value net, structures the analysis of industries. The stimulus-organism-response (SOR) framework links environments to emotions and behaviour. The chapter ends with a capstone mechanism toolkit that maps the recurring causal mechanisms of this book onto the theories that use them (Table 31.1).
| Framework | Core question | Level of analysis | Key source |
|---|---|---|---|
| Information processing (multi-store) model | How is information encoded, held, and retrieved? | Individual cognition | Atkinson & Shiffrin (1968) |
| Geneplore model | How do people generate and refine creative ideas? | Individual cognition | Finke, Ward & Smith (1992) |
| Combinatorial creativity | How do new ideas arise from recombining old ones? | Individual / team / economy | Weitzman (1998), Uzzi et al. (2013) |
| Five forces and value net | What determines an industry’s profitability? | Industry | Porter (1979, 2008), Brandenburger & Nalebuff (1996) |
| Stimulus-organism-response | How do environments shape emotion and behaviour? | Individual in a setting | Mehrabian & Russell (1974) |
| Mechanism toolkit | Which causal mechanisms recur across theories? | Cross-level | Hedstrom & Swedberg (1998) |
31.1 Information Processing Model
Core claim. Human memory can be described as a flow of information through distinct stores, a sensory register, a limited-capacity short-term store, and a durable long-term store, regulated by control processes such as attention, rehearsal, and retrieval.
Origins. Cognitive psychology. Atkinson and Shiffrin (1968), building on the information-theoretic turn of the 1950s (G. A. Miller 1956). Later revised by the working-memory model (A. D. Baddeley and Hitch 1974) and challenged by the levels-of-processing framework (Craik and Lockhart 1972).
Level of analysis. Individual cognition.
Key constructs. Sensory register, short-term store (working memory), long-term store, capacity, duration, encoding, rehearsal, retrieval, control processes, chunking.
Boundary conditions. The stores are functional distinctions, not anatomical boxes. The model describes deliberate learning well. It captures less well implicit learning, emotion’s influence on memory, and the depth at which information is processed.
Related theories. Processing fluency (Section 23.8), Elaboration likelihood model (Section 26.1), Bounded rationality (Section 23.1), Mere exposure effect (Section 29.1).
31.1.1 Origins and intellectual history
The cognitive revolution of the 1950s recast the mind as an information-processing system with limited capacity. In a celebrated paper, G. A. Miller (1956) observed that the span of immediate memory is limited to roughly seven, plus or minus two, items, but that an “item” can be a chunk: a letter, a word, or a familiar phrase. Capacity is therefore limited in chunks rather than in raw information, and expertise expands effective capacity by building larger chunks.
Atkinson and Shiffrin (1968) integrated such findings into a multi-store model. They distinguished the structural features of memory, permanent stores that do not vary across situations, from control processes that the person chooses to deploy, such as rehearsal, coding strategies, and retrieval search. Information from the environment first enters a sensory register that holds a rich but very brief trace. Sperling (1960) showed, using a partial-report technique, that the visual sensory trace holds more than people can report but fades within a fraction of a second. Attended information passes to the short-term store, which is small and loses information within seconds unless it is rehearsed. Rehearsal both maintains information in the short-term store and transfers it to the long-term store, which is effectively unlimited and durable. Retrieval brings long-term information back into the short-term store, where it is used to guide responses. Figure 31.1 redraws this architecture.
Figure 31.1: The multi-store model of memory. Environmental input passes through a sensory register to a limited short-term store, where control processes determine what is rehearsed, encoded into long-term memory, and retrieved. Information is lost from each store through decay or displacement. Redrawn from the architecture described by Atkinson and Shiffrin (1968).
Table 31.2 summarises the properties typically attributed to each store.
| Store | Capacity | Duration | Main code | How information is lost | Key evidence |
|---|---|---|---|---|---|
| Sensory register | Large | Well under a second (visual) | Sensory (modality-specific) | Rapid decay, masking | Sperling (1960) partial report |
| Short-term store | About 7 +/- 2 chunks, about 4 when chunking is controlled | Seconds without rehearsal | Largely phonological / verbal | Decay and displacement by new items | Miller (1956), Cowan (2001) |
| Long-term store | Effectively unlimited | Minutes to a lifetime | Largely semantic | Interference, retrieval failure | Primacy effect, Glanzer & Cunitz (1966) |
31.1.2 Core logic and propositions
The model generates several testable propositions:
- P1 (Limited capacity). The amount of information that can be held and manipulated at once is small. Cowan (2001) argues that, when rehearsal and chunking are prevented, the limit is closer to four chunks than to seven.
- P2 (Rehearsal and transfer). The more an item is rehearsed in the short-term store, the more likely it is to be transferred to long-term memory.
- P3 (Dissociable stores). Manipulations that affect one store (for example, a short filled delay that empties the short-term store) should leave the other store’s contribution intact.
The classic test of P2 and P3 is the serial-position curve. When people recall a list of words in any order, recall is best for the first items (primacy) and the last items (recency), and worst in the middle (Murdock 1962). The multi-store account attributes primacy to extra rehearsal of early items, which transfers them to long-term memory, and recency to items still held in the short-term store at the time of recall. Glanzer and Cunitz (1966) provided the critical dissociation: a filled delay of about thirty seconds before recall eliminated the recency effect but left primacy intact, whereas slowing the presentation rate improved recall of early and middle items but did not affect recency. Figure 31.2 reproduces the pattern in stylised form.
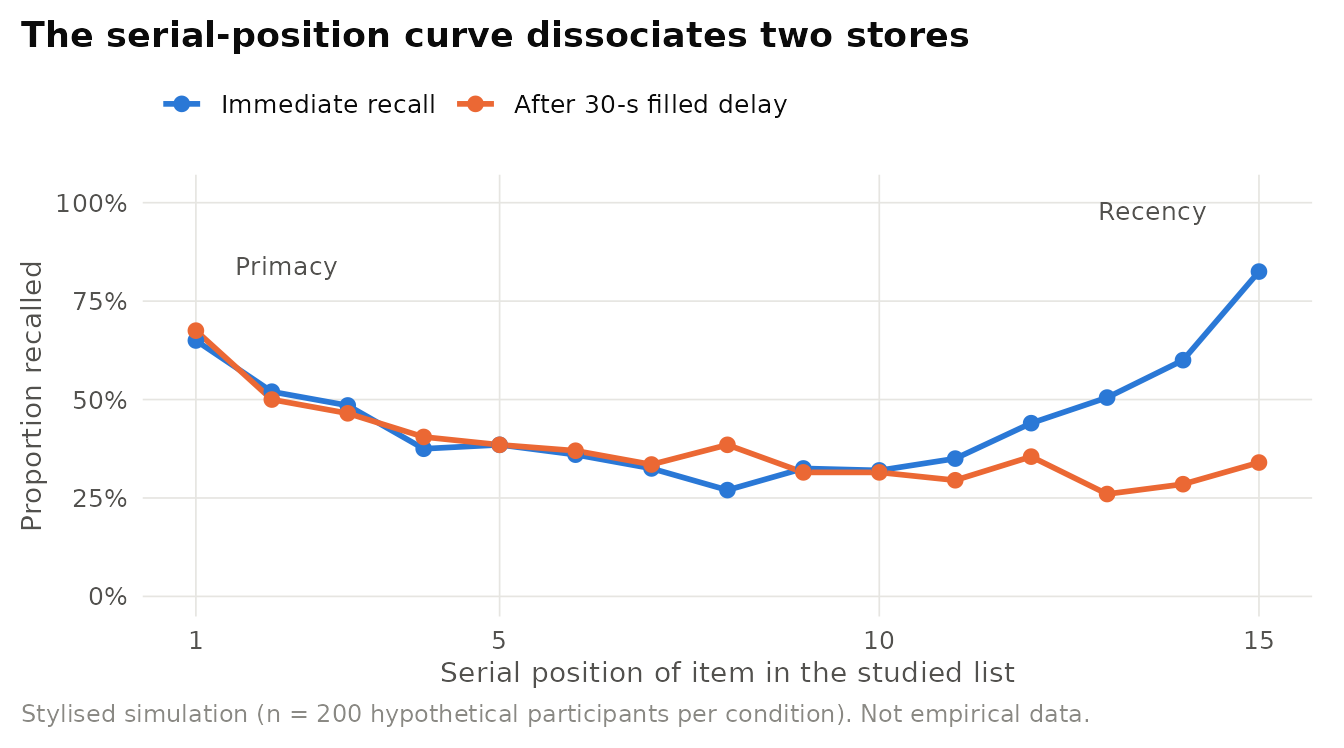
Figure 31.2: Stylised serial-position curves for immediate and delayed free recall of a 15-item list. Primacy (early items) reflects rehearsal-driven transfer to long-term memory. Recency (late items) reflects the short-term store and disappears after a filled delay. Simulated data for 200 hypothetical participants per condition. Pattern consistent with Murdock (1962) and Glanzer and Cunitz (1966).
31.1.3 Evidence and extensions
The multi-store model was enormously generative, and its successors refined rather than discarded it. Two refinements matter most.
Working memory. A. D. Baddeley and Hitch (1974) argued that the short-term store is not a single passive buffer but a working memory system used for reasoning, comprehension, and learning. Their model comprises a central executive that allocates attention, a phonological loop that holds speech-based information, and a visuospatial sketchpad for visual and spatial information. A. Baddeley (2000) later added an episodic buffer that integrates information from the subsystems and long-term memory into coherent episodes. The working-memory view explains why two verbal tasks interfere with each other more than a verbal and a visual task do.
Levels of processing. Craik and Lockhart (1972) challenged the idea that durability depends on which store holds information. They proposed instead that memory is a by-product of perceptual and conceptual analysis, and that retention depends on the depth of processing: meaning-based (semantic) analysis yields more durable memories than analysis of sound or appearance, and mere repetition at a shallow level adds little. The proposal shifted attention from boxes to processes.
Stores or processes? Critics of the multi-store model point out that rehearsal is not one thing: maintenance rehearsal (repeating a phone number) keeps information active but does little for long-term retention, whereas elaborative rehearsal (relating information to what one knows) is highly effective (Craik and Lockhart 1972). Others note that the short-term store is better described as an activated portion of long-term memory with a small focus of attention (Cowan 2001). Most researchers now treat the multi-store model as a useful first approximation: right about capacity limits and the distinction between active and durable memory, incomplete about how encoding works.
31.1.4 Applications in business
The model is the cognitive foundation of much consumer and organizational research. Brand knowledge, for instance, is commonly conceptualised as an associative network in long-term memory, with brand awareness reflecting the strength of the brand node and brand image the associations linked to it (Keller 1993). Advertising aims to get information past attention into long-term memory and to make it retrievable at the moment of choice.
The model’s most direct practical implication concerns cognitive load. Cognitive load theory holds that learning suffers when tasks impose demands that exceed working-memory capacity: for example, when novices must search for a solution rather than study a worked example (Sweller 1988). Mayer and Moreno (2003) distil the research into practical techniques such as segmenting material into learner-paced chunks, pretraining key concepts, and weeding out interesting but extraneous material.
Illustrative scenario: designing memorable onboarding. A software firm’s first-week onboarding consists of a two-hour video tour of every feature. Usage data show that new customers adopt few features and that support tickets cluster around topics the video covered. The information processing model diagnoses the problem: the tour overloads working memory, the middle of the sequence suffers from the serial-position dip, and there is no retrieval practice. A redesign applies four principles: (1) segment the content into short task-based modules released as users need them (Mayer and Moreno 2003). (2) Put the most important actions at the start and end of each module. (3) Replace passive viewing with brief retrieval tasks, since practising recall improves long-term retention more than re-studying (Roediger and Karpicke 2006), and (4) space reminders over days rather than massing them in one session (Cepeda et al. 2006). The same logic applies to employee onboarding, compliance training, and sales enablement.
Sample hypotheses. H1. Advertisements placed in the middle of a commercial break will be recalled less than those placed first or last. H2. Segmented onboarding will increase 30-day feature adoption relative to a single-session tutorial, with larger effects for more complex products.
Designs. Experiments manipulating serial position, presentation rate, and delay, A/B tests of onboarding flows, dual-task paradigms to measure load.
Measures. Free and cued recall, recognition, response times, self-reported mental effort, feature adoption and support-ticket rates as field outcomes.
Citing “seven plus or minus two” as a design rule. Miller’s number described immediate memory span for chunks of varying size, and later work suggests a lower limit for unrehearsed, unchunked material (Cowan 2001). Menus and forms do not need exactly seven items. They need items that users can chunk meaningfully and that do not all have to be held in mind at once.
31.2 Geneplore Model
Core claim. Creative thinking alternates between a generative phase, in which people construct mental representations called preinventive structures, and an exploratory phase, in which they interpret, elaborate, and test those structures. The cycle repeats until a satisfactory creative product emerges.
Origins. Cognitive psychology of creativity. Introduced in Creative Cognition by Ronald Finke, Thomas Ward, and Steven Smith (Finke, Ward, and Smith 1992, see also Finke, Ward, and Smith 1996).
Level of analysis. Individual cognition, extendable to teams.
Key constructs. Generative processes, preinventive structures, preinventive properties, exploratory processes, product constraints.
Boundary conditions. Describes the cognitive processes of idea generation under normal conditions. It does not by itself predict which ideas will succeed socially or commercially.
Related theories. Combinatorial creativity, Exploration and exploitation (Section 5.3), Construal level theory (Section 20.3), Beauty in averageness (Section 29.10).
31.2.1 Core logic
The Geneplore model (“generate” plus “explore”) treats creativity not as a mysterious gift but as the application of ordinary cognitive processes, retrieval, association, combination, and categorisation, in particular sequences (Finke, Ward, and Smith 1992). The key theoretical move is the preinventive structure: an incompletely specified idea, a visual form, a mental blend of two concepts, a novel combination of words, that has creative potential but whose meaning and use are not yet fixed. Generation produces such structures, exploration discovers what they could be. Constraints on the final product can be imposed at either phase. Figure 31.3 shows the cycle, and Table 31.3 lists the processes and structures the model names.
Figure 31.3: The Geneplore cycle. Generative processes produce preinventive structures with emergent properties. Exploratory processes interpret them. People then either focus on a promising concept or expand it, feeding back into a new round of generation. Product constraints can be imposed at any point. Redrawn from the model described in Finke, Ward, and Smith (1992).
| Component | Examples |
|---|---|
| Generative processes | Retrieval of existing structures, association, mental synthesis, mental transformation, analogical transfer, categorical reduction |
| Preinventive structures | Visual patterns, object forms, mental blends, category exemplars, mental models, verbal combinations |
| Preinventive properties | Novelty, ambiguity, meaningfulness, emergence, incongruity, divergence |
| Exploratory processes | Attribute finding, conceptual interpretation, functional inference, contextual shifting, hypothesis testing, searching for limitations |
| Product constraints | Product type, category, features, functions, components, resources |
A characteristic research paradigm illustrates the model. Participants are given a few simple parts, a sphere, a hook, a cylinder, and asked to combine them into an interesting form without knowing its purpose (generation), and then to interpret the form as a useful object in an assigned category such as furniture or tools (exploration). Separating the two phases allows researchers to study how ambiguity in the preinventive form and constraints in the interpretation phase each contribute to creativity (Finke, Ward, and Smith 1992).
31.2.2 Evidence and extensions
Two findings show that generation is shaped, and limited, by existing knowledge. First, imagination is structured. When Ward (1994) asked people to imagine creatures living on other planets, most invented creatures that preserved the core properties of Earth animals, such as bilateral symmetry and familiar sense organs and appendages. New ideas are built from the category knowledge people already have. Second, examples can cause fixation. Design engineers shown an example solution tended to reproduce its features, including flawed ones (Jansson and Smith 1991), and participants in creative generation tasks conformed to the features of examples even when told to produce something different (S. M. Smith, Ward, and Schumacher 1993).
These findings link the Geneplore model to older evolutionary accounts of creativity, in which ideas arise through variation and are then selectively retained (D. T. Campbell 1960), and forward to research on recombination in teams and organizations, discussed in the next section.
Illustrative scenario: an ideation workshop built on Geneplore. A consumer goods firm runs innovation workshops that typically yield incremental line extensions. Applying the model, facilitators split each session into two phases. In the generation phase, teams combine randomly drawn ingredients, formats, and usage occasions into rough concepts without evaluating them, which increases the ambiguity and novelty of preinventive structures. In the exploration phase, teams interpret each concept for a specific target customer, search for its limitations, and either focus it or send it back for regeneration. To reduce fixation, facilitators avoid showing competitor products before generation and introduce examples only during exploration (S. M. Smith, Ward, and Schumacher 1993, Jansson and Smith 1991).
Equating creativity with unconstrained brainstorming. The Geneplore model treats constraints as tools, not enemies: constraints imposed at the right phase can direct exploration and make ideas usable. The common error is to impose evaluative constraints during generation, which kills ambiguity, or to impose none at all, which yields ideas that cannot be implemented.
31.3 Combinatorial Creativity
Core claim. New ideas, technologies, and products are largely new combinations of existing components. The most valuable innovations tend to balance familiar combinations with a small dose of atypical ones.
Origins. Economics of innovation, from Schumpeter’s “new combinations” (Schumpeter 1934) to recombinant growth theory (Weitzman 1998). Empirical work on patents (Fleming 2001, Youn et al. 2015), science (Uzzi et al. 2013), ideation networks (Stephen, Zubcsek, and Goldenberg 2016), and films (Wei 2020).
Level of analysis. Individual inventor, team, firm, and economy.
Key constructs. Components, combinations, novelty (atypicality), conventionality, recombinant uncertainty, knowledge brokering.
Boundary conditions. Strongest where knowledge is modular and can be recombined (technology, science, content). The value of novelty depends on the audience’s capacity to make sense of it.
Related theories. Geneplore model, Absorptive capacity (Section 5.2), Structural holes (Section 9.4), Knowledge-based view (Section 4.3), Beauty in averageness (Section 29.10).
31.3.1 Core logic
Schumpeter (1934) defined economic development as the carrying out of “new combinations”: of goods, methods of production, markets, sources of supply, and forms of organization. Weitzman (1998) formalised the idea in a model of recombinant growth, in which new ideas are produced by combining old ones. Because the number of possible combinations grows much faster than the number of ideas, the model implies that, in the long run, growth is limited not by a shortage of potential ideas but by the capacity to process them: to test, develop, and select among the explosion of possible combinations. Figure 31.4 illustrates the arithmetic.
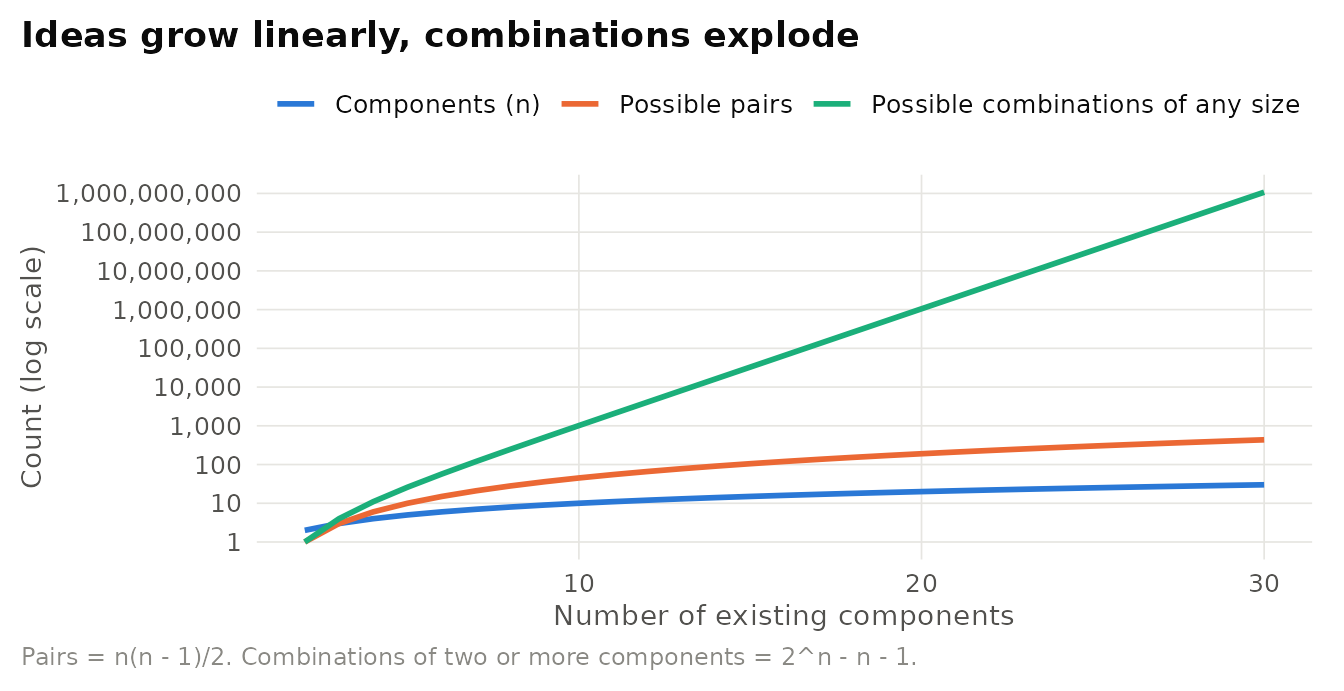
Figure 31.4: The combinatorial explosion behind recombinant growth. The number of possible pairs grows quadratically with the number of components, and the number of possible subsets of any size grows exponentially. Deterministic counts, not data.
If combinations are abundant, the strategic question becomes which combinations to try. Fleming (2001) studied this question with patent data, treating each patent’s technology subclasses as its components. He found that experimenting with new components and new combinations lowered the average usefulness of inventions, as measured by later citations, but increased their variability: producing more failures and also the occasional breakthrough. Search over familiar components, by contrast, is reliable but exhausts its potential. Recombination is thus a portfolio problem: novelty buys upside at the cost of predictability.
31.3.2 Evidence and extensions
Table 31.4 summarises influential empirical studies.
| Study | Context | Unit of recombination | Key insight |
|---|---|---|---|
| Fleming (2001) | U.S. patents | Technology subclasses | Novel combinations lower mean usefulness but raise variance (breakthrough potential) |
| Uzzi et al. (2013) | Scientific papers | Pairs of journals cited together | High-impact papers pair highly conventional combinations with a tail of atypical ones |
| Youn et al. (2015) | U.S. patents | Technology codes | Invention is predominantly the combination of existing codes rather than the creation of new ones |
| Stephen et al. (2016) | Networked ideation tasks | Ideas seen from network neighbours | Lower network connectivity reduces redundant inspiration and raises innovativeness |
| Wei (2020) | Motion pictures | Film attributes in a similarity network | A film’s position relative to prior films relates to its market performance |
| Hargadon & Sutton (1997) | Product design firm (IDEO) | Solutions from different industries | Brokering knowledge across industries is a systematic source of new combinations |
Uzzi et al. (2013) analysed the reference lists of millions of scientific papers, scoring each pair of cited journals by how typical or atypical it was relative to chance. The papers most likely to become highly cited were those that combined a high degree of conventionality, mostly familiar pairings that anchor the work in established knowledge, with a tail of novelty: a few highly unusual pairings. Papers that were purely conventional or purely novel were less likely to be hits, and teams were more likely than solo authors to insert novel combinations. Youn et al. (2015) found a similar combinatorial structure in U.S. patents: most invention consists of combining existing technology codes, often in new ways, rather than introducing wholly new codes. Stephen, Zubcsek, and Goldenberg (2016) show that the social structure of idea generation matters: in interdependent ideation tasks, denser networks exposed participants to redundant ideas and reduced the innovativeness of their output. And Wei (2020) constructs a similarity network among motion pictures, illustrating how the recombinant logic extends to cultural products, where a new film’s relationship to existing films can be measured and related to its commercial performance.
Together, these studies suggest an inverted-U relationship between novelty and expected impact, combined with rising variance as novelty increases. Figure 31.5 illustrates this pattern with stylised data: average impact peaks at moderate novelty, while the upper tail of outcomes (the chance of an extreme hit) keeps rising further into the novel range.
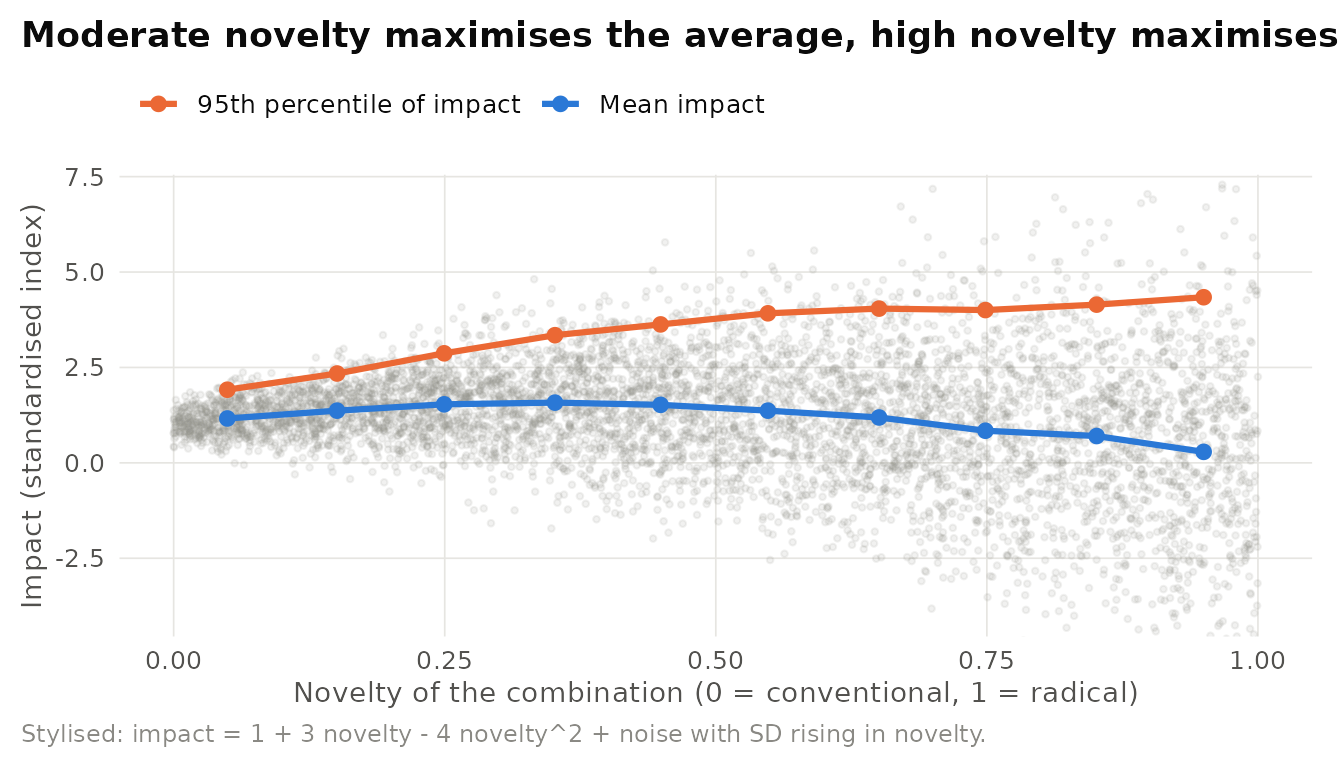
Figure 31.5: Stylised relationship between novelty and impact. Mean impact follows an inverted U (familiar combinations are reliable but unremarkable. Radical ones often fail), while the 95th percentile peaks at higher novelty because novel combinations have higher variance. Illustrative simulation of 6,000 hypothetical projects, not empirical data.
How should novelty be measured? Combinatorial measures depend on how components are defined, patent subclasses, journal pairs, keywords, or film attributes, and on the baseline against which a combination counts as atypical. Different operationalisations can rank the same work differently. A second debate concerns causality: atypical combinations may be associated with impact because more talented teams both attempt and succeed at them. Researchers address these concerns with alternative baselines, author or team fixed effects, and experiments that manipulate exposure to diverse components.
Knowledge brokering at IDEO and an innovation portfolio via recombination. Hargadon and Sutton (1997) studied the product design firm IDEO and showed how it innovated by acting as a technology broker: because it worked for clients in many industries, designers encountered solutions in one industry that could be recombined into products for another. The firm supported this with routines for capturing, storing, and retrieving design knowledge: brainstorming sessions, collections of physical objects, and a culture of asking colleagues for help. A portfolio manager can apply the same logic deliberately. Illustrative scenario: classify each funded project by how conventional its core components are and how many atypical pairings it contains. Allocate most of the budget to projects with a conventional core and a few novel pairings, the region where average returns peak in Figure 31.5, and a smaller share to radical combinations, judged not on average return but on their contribution to the portfolio’s upside. Staff the radical projects with people who span domains, and keep ideation networks loosely connected to avoid redundant inspiration (Stephen, Zubcsek, and Goldenberg 2016).
Sample hypotheses. H1. Products that combine a conventional platform with a small number of atypical features will achieve higher average sales than either purely conventional or highly atypical products. H2. The variance of commercial outcomes will increase with the atypicality of feature combinations.
Designs. Archival studies of patents, papers, products, or media with combination-based novelty scores. Quantile regression to capture variance effects. Field experiments in idea contests that randomise exposure to others’ ideas.
Measures. Pairwise atypicality z-scores relative to a randomised baseline (Uzzi et al. 2013). First appearance of a component pair (Fleming 2001). Similarity to prior products in an embedding space (Wei 2020). Citations, sales, or awards.
31.4 Porter’s Five Forces
Core claim. An industry’s long-run profitability is determined by five competitive forces: rivalry among existing competitors, the threat of new entrants, the bargaining power of buyers, the bargaining power of suppliers, and the threat of substitutes. The collectively strongest forces set the ceiling on returns.
Origins. Industrial organization economics, especially the structure-conduct-performance (Section @ref(structure-conduct-performance (Section 11.1))) tradition and research on entry barriers (Bain 1956). Translated into a managerial framework by Michael E. Porter (1979) and Michael E. Porter (1980b), with a companion article for financial analysts (Michael E. Porter 1980a). Restated in Michael E. Porter (2008).
Level of analysis. Industry (and the firm’s position within it).
Key constructs. Entry barriers, supplier and buyer concentration, switching costs, substitutes’ price-performance, rivalry intensity, industry structure.
Boundary conditions. Assumes a definable industry with reasonably stable boundaries. It is less informative where boundaries shift rapidly, where complementors and ecosystems dominate value creation, or where firm-specific resources matter more than industry structure.
Related theories. Resource-based theory (Section 4.1), Dynamic capabilities (Section 5.1), Resource dependence theory (Section 7.1), Transaction cost economics (Section 6.3).
31.4.1 Origins and intellectual history
In the structure-conduct-performance paradigm of industrial organization, industry structure (concentration, entry barriers, product differentiation) shapes firm conduct, which determines industry performance. Bain (1956) showed that barriers to entry such as economies of scale, product differentiation, and absolute cost advantages allow incumbents to sustain prices above competitive levels. Economists traditionally viewed such barriers as a problem for public policy. Michael E. Porter (1979) inverted the perspective: what is a barrier to competition from society’s point of view is, from the firm’s point of view, a source of profitability to be understood and, where possible, shaped. Michael E. Porter (1980b) developed the framework into a full method for industry and competitor analysis and paired it with the generic strategies of cost leadership, differentiation, and focus.
Teece, Pisano, and Shuen (1997) later placed the five forces within a map of strategy paradigms. The competitive forces approach and the game-theoretic strategic conflict approach (Shapiro 1989) locate advantage in market position and the exploitation of market power. The resource-based and dynamic capabilities approaches locate it in firm-specific assets and the capacity to renew them. The five forces is thus one of two broad answers to the question of why firms differ in performance: because they compete in different industries, or because they bring different resources to the same industry.
31.4.2 Core logic
Figure 31.6 shows the framework. Each force captures a way in which the value created in an industry can be competed away or captured by someone other than the incumbents: by new entrants, by powerful buyers and suppliers, by substitutes that cap prices, or by rivals through price wars and costly competition.
Figure 31.6: Porter’s five competitive forces. Rivalry among existing competitors sits at the centre. The threat of entry, the threat of substitutes, and the bargaining power of suppliers and buyers jointly determine how much of the value an industry creates its incumbents can capture. Redrawn from Porter (1979, 2008).
Table 31.5 lists, for each force, the structural drivers that make it strong and typical strategic responses, following Michael E. Porter (2008).
| Force | Strong when… | Typical strategic responses |
|---|---|---|
| Threat of entry | Low scale economies, weak network effects, low switching costs, low capital needs, open distribution, permissive regulation | Build scale and network effects, raise switching costs, secure channels, signal retaliation |
| Supplier power | Suppliers more concentrated than the industry, differentiated inputs, high switching costs, supplier can integrate forward | Multi-source, standardise inputs, develop alternatives, integrate backward |
| Buyer power | Few, large buyers, standardised products, low buyer switching costs, buyers can integrate backward, price-sensitive buyers | Differentiate, serve less powerful segments, create switching costs |
| Threat of substitutes | Attractive price-performance trade-off of substitutes, low cost of switching to them | Improve value relative to substitutes, reposition, bundle |
| Rivalry | Many or equally sized rivals, slow growth, high exit barriers, high fixed costs, perishable products, undifferentiated offerings | Differentiate, compete on non-price dimensions, avoid zero-sum price wars |
Michael E. Porter (2008) also clarified what the framework is not. Industry growth, technology and innovation, government, and complementary products are better understood as factors that affect industry structure through the five forces than as additional forces in their own right. Rapid growth, for example, does not guarantee profitability if it attracts entry or empowers suppliers.
How much does industry matter? If industry structure determines profits, industry should explain much of the variation in firm performance. Early variance-decomposition work found sizeable industry effects (Schmalensee 1985). Rumelt (1991), using multi-year data, found that stable business-unit effects dwarfed industry effects, a result widely read as support for the resource-based view. McGahan and Porter (1997) found that industry effects were meaningful and persistent, though business-specific effects remained larger. The emerging consensus is that both industry and firm matter, in proportions that vary across sectors, which is why the five forces is typically paired with resource-based analysis rather than used alone.
31.4.3 The value net: complements and co-opetition
A frequent criticism of the five forces is that it treats every other player as a threat to profits. Brandenburger and Nalebuff (1996) proposed the value net, which adds complementors, players whose products make customers value yours more (or make it more attractive for suppliers to supply you), and emphasises that the same player can be both competitor and complementor. Airlines compete for passengers yet cooperate in demanding aircraft that manufacturers can produce at scale. Hardware and software firms compete for margin while making each other’s products more valuable. Figure 31.7 shows the structure.
Figure 31.7: The value net. A firm interacts vertically with customers and suppliers and horizontally with competitors and complementors. The same player can occupy more than one role. Redrawn from Brandenburger and Nalebuff (1996).
Brandenburger and Nalebuff also offer a checklist for changing the game rather than merely playing it, summarised by the acronym PARTS: change the players, the added values each brings, the rules, the tactics that shape perceptions, and the scope of the game (Brandenburger and Nalebuff 1996). The value net and the five forces are complements: the five forces asks how value is captured and competed away. The value net asks how it is created and shared.
31.4.4 Applications in business
Illustrative scenario: industry attractiveness assessment. A diversified firm is choosing between entering a regional meal-kit delivery market and an industrial testing-equipment niche. Demand for meal kits is growing faster, and the board initially favours that option. A five-forces assessment, summarised in Table 31.6, tells a different story. Meal kits face low entry barriers, low customer switching costs, close substitutes (grocery delivery, restaurants, cooking from scratch), and intense rivalry. Testing equipment benefits from certification requirements, high switching costs, and a fragmented customer base. Growth, a factor rather than a force, does not offset an unattractive structure (Michael E. Porter 2008). The analysis does not end the conversation, a firm with unusual resources could still win in meal kits, but it shifts the burden of proof to identifying those resources.
| Force | Meal-kit delivery (score) | Testing equipment (score) | Rationale (stylised) |
|---|---|---|---|
| Threat of entry | High (1) | Low (4) | Meal kits need little capital. Testing equipment requires certification and installed base |
| Supplier power | Moderate (3) | Moderate (3) | Both rely on commodity inputs plus a few specialised suppliers |
| Buyer power | High (2) | Low (4) | Consumers switch easily. Equipment buyers face retraining and recertification costs |
| Threat of substitutes | High (1) | Low (4) | Many alternatives to meal kits, few substitutes for certified testing |
| Rivalry | High (1) | Moderate (3) | Many funded rivals and heavy promotion versus a few specialised incumbents |
| Overall (mean, 1 = unattractive, 5 = attractive) | 1.6 | 3.6 | Structure favours the slower-growing niche |
Mis-defining the industry. The most common error is drawing industry boundaries too broadly or too narrowly. Define the industry by product scope and geographic scope, asking where substitutes and rivals actually constrain pricing. A second error is treating the analysis as a static checklist. Forces change, and the value of the framework lies in anticipating how a technological, regulatory, or entry event will shift them (Michael E. Porter 2008).
31.5 Stimulus-Organism-Response Framework
Core claim. Environmental stimuli affect behaviour through the internal states they produce in the person, principally emotional states of pleasure and arousal, which in turn lead to approach or avoidance behaviours.
Origins. Environmental psychology, Mehrabian and Russell (1974). Applied to retailing by Donovan and Rossiter (1982) and to services by Bitner (1992). Rooted in a longer tradition that interposed the organism between stimulus and response (J. Jacoby 2002).
Level of analysis. Individual in a physical or digital environment.
Key constructs. Stimulus (environmental cues), organism (pleasure, arousal, dominance, cognitive and physiological states), response (approach versus avoidance).
Boundary conditions. Effects depend on the person’s goals (task-oriented versus recreational shopping), personality, and culture, and on the congruence of cues with each other and with the setting.
Related theories. Affect circumplex (Section 25.3), Feelings as information (Section 23.7), Scent and emotion (Section 30.12), Processing fluency (Section 23.8).
31.5.1 Core logic
Mehrabian and Russell (1974) proposed that people respond to environments along three emotional dimensions, pleasure, arousal, and dominance (PAD), and that these states mediate the effect of environmental features on approach behaviours (desire to stay, explore, affiliate, and perform) or avoidance behaviours (desire to leave). The pleasure and arousal dimensions later became the axes of the influential circumplex model of affect (Russell 1980). Figure 31.8 presents the framework.
Figure 31.8: The stimulus-organism-response framework. Environmental cues produce emotional (and cognitive) states that mediate approach or avoidance responses. Shopping goals and individual differences moderate the links. Based on Mehrabian and Russell (1974) and Donovan and Rossiter (1982).
31.5.2 Evidence and extensions
Donovan and Rossiter (1982) brought the framework into retailing. Using the PAD measures in retail settings, they found that store-induced pleasure was a strong predictor of approach behaviours such as enjoyment of shopping, time spent browsing, and willingness to spend more than planned, and that arousal increased approach behaviours in environments that were already pleasant. Dominance added little. Earlier, Kotler (1973) had coined the term atmospherics for the deliberate design of buying environments to produce emotional effects that increase purchase probability. Bitner (1992) extended the logic to services in the servicescape model, which identifies ambient conditions, spatial layout and functionality, and signs, symbols, and artefacts as environmental dimensions that affect both customers and employees through cognitive, emotional, and physiological responses.
Field experiments have confirmed specific links. Milliman (1982) varied the tempo of background music in a supermarket and found that slower music was associated with a slower pace of in-store traffic and higher sales volume than faster music. Research on ambient scent, reviewed in the previous chapter (Section 30.12), shows similar effects of pleasant, congruent odours. Table 31.7 organizes the framework’s elements.
| Element | Examples | Typical measures |
|---|---|---|
| Stimulus: ambient | Music tempo and volume, scent, lighting, temperature | Experimental manipulation, sensor logs |
| Stimulus: design | Layout, colour, materials, signage, website design | Store or interface audits, A/B variants |
| Stimulus: social | Crowding, staff presence and behaviour, other customers | Footfall counts, observation |
| Organism: emotional | Pleasure, arousal, dominance | PAD semantic-differential scales, physiological measures |
| Organism: cognitive | Perceived quality, perceived waiting time, fluency | Survey ratings, response times |
| Response: approach | Dwell time, exploration, spending, return visits | Transaction and loyalty data, path tracking |
| Response: avoidance | Early exit, abandonment, complaints | Bounce and exit rates, complaint logs |
A framework or a theory? Critics note that SOR specifies where to look, stimuli, internal states, responses, more than why particular stimuli produce particular states, and that almost any mediator can be labelled an “organism” variable. J. Jacoby (2002) argues for a richer treatment of the organism, including stored knowledge and goals. In practice, SOR is most powerful when paired with a specific theory of the internal state, such as the circumplex model of affect (Russell 1980) or processing fluency (Section 23.8).
Retail atmospherics. A specialty retailer wants to increase dwell time and basket size without discounting. SOR suggests designing for pleasure first and calibrating arousal to the format: a calm, pleasant environment for considered purchases (furniture, wine) and a more energetic one for impulse-driven formats. Concrete levers follow from the evidence: slower music tempo where browsing is valuable (Milliman 1982). Pleasant, category-congruent scent. Lighting and layout that reduce perceived crowding, and staff behaviour that supports a sense of control. Because the servicescape also affects employees (Bitner 1992), changes should be evaluated on staff well-being and service quality as well as on sales. The firm should test levers one at a time across matched stores or time slots, as atmospheric cues interact and their effects depend on shopping goals.
31.6 A Mechanism Toolkit for Social Science Theory
The frameworks in this chapter organize problems. Theories explain them by specifying mechanisms. A mechanism is a set of entities and activities organized so that they produce a regular outcome: the cogs and wheels that connect cause and effect (Hedström and Swedberg 1998, Hedström and Ylikoski 2010). Mechanism-based explanation answers Whetten’s “why” question (Whetten 1989): it is not enough to show that X and Y are correlated. A theory must say how X brings about Y.
Mechanism-based thinking is also the best way to see the unity behind the many theories in this book. Theories that look unrelated often share a mechanism: signaling theory (Section 8.2), screening theory (Section 8.3), and pack journalism (Section 30.7) all turn on information. Agency theory (Section 6.1), social loafing (Section 30.9), and the tragedy of the commons (Section 30.11) all turn on incentives when contributions and rewards are decoupled. Recognising the shared mechanism lets researchers transfer designs across literatures and lets managers transfer remedies across problems.
Hedström and Swedberg (1998) organize social mechanisms into three types, which correspond to the three links in a macro-micro-macro explanation (Figure 31.9). Situational mechanisms describe how social conditions shape individuals’ beliefs, desires, and opportunities. Action-formation mechanisms describe how individuals combine these into action, and transformational mechanisms describe how individual actions aggregate into collective outcomes.
Figure 31.9: Three types of social mechanisms in a macro-micro-macro explanation. Macro conditions shape individuals’ situations (situational mechanisms), individuals act (action-formation mechanisms), and actions aggregate into macro outcomes (transformational mechanisms). The dotted arrow is the macro-level correlation that mechanism-based theory seeks to explain. Based on Hedstrom and Swedberg (1998).
Table 31.8 is the capstone of the book’s theoretical apparatus. It identifies ten recurring mechanisms, states the core logic of each, lists representative theories from earlier chapters, and names the managerial levers each mechanism implies.
| Mechanism | Core logic | Representative theories in this book | Typical managerial levers |
|---|---|---|---|
| Information | Behaviour responds to what actors know and infer. Asymmetries create adverse selection, signals, and cascades | Information asymmetry, signaling, screening, countersignaling, wisdom of the crowd, pack journalism | Disclosure, certification, warranties, aggregation of independent judgements |
| Incentives | Actors respond to the pay-offs of their choices. Misaligned or diluted pay-offs produce shirking and overuse | Agency theory, transaction cost economics, expectancy theory, social loafing, tragedy of the commons | Contracts, monitoring, identifiable contributions, rules for shared resources |
| Identity | People act to express and protect who they are and the groups they belong to | Social identity theory, optimal distinctiveness, identity signaling, snob effect, social magnet | Brand communities, positioning between belonging and distinctiveness |
| Social comparison and influence | People calibrate beliefs and behaviour by observing others | Social comparison, conformity, social norms, social facilitation, spiral of silence, bystander effect, groupthink | Descriptive norms, feedback relative to peers, structured dissent |
| Cognition and fluency | Bounded capacity and heuristics shape attention, memory, and judgement | Bounded rationality, heuristics and biases, prospect theory, processing fluency, similarity asymmetry, information processing model | Choice architecture, framing, reducing cognitive load |
| Emotion and affect | Feelings colour judgement and drive approach or avoidance | Broaden-and-build, affect circumplex, feelings as information, emotion and virality, SOR framework, scent and emotion | Atmospherics, emotional content, experience design |
| Power and dependence | Control over critical resources creates power and shapes bargaining | Resource dependence, social exchange, network exchange, power distance, five forces | Diversify dependencies, build switching costs, coalitions |
| Legitimacy | Organizations conform to institutional expectations to gain acceptance and resources | Institutional theory, legitimacy, stakeholder theory, organizational ecology | Certification, isomorphic practices, stakeholder engagement |
| Learning and capabilities | Accumulated knowledge and routines shape what firms and people can do next | Resource-based theory, knowledge-based view, dynamic capabilities, absorptive capacity, exploration-exploitation, Geneplore, combinatorial creativity | Capability building, recombination portfolios, ambidextrous structures |
| Networks and diffusion | Position in social structure governs access to information and the spread of behaviour | Weak ties, structural holes, social capital, diffusion of innovations, Bass model, homophily, Matthew effect | Seeding, brokerage, referral programmes, exposure design |
The theories listed in the table can be found in the following sections:
- Information: Information asymmetry (Section 8.1), Signaling theory (Section 8.2), Screening theory (Section 8.3), Countersignaling (Section 8.6), Wisdom of the crowd (Section 30.5), Pack journalism (Section 30.7).
- Incentives: Agency theory (Section 6.1), Transaction cost economics (Section 6.3), Expectancy theory (Section 19.2), Social loafing (Section 30.9), Tragedy of the commons (Section 30.11).
- Identity: Social identity theory (Section 22.2), Optimal distinctiveness (Section 22.3), Identity signaling (Section 8.5), Snob effect (Section 29.5), Social magnet (Section 30.4).
- Social comparison and influence: Social comparison theory (Section 22.1), Conformity (Section 22.4), Social norms (Section 22.5), Social facilitation (Section 22.6), Spiral of silence (Section 22.8), Bystander effect (Section 30.10), Groupthink (Section 30.6).
- Cognition and fluency: Bounded rationality (Section 23.1), Heuristics and biases (Section 23.2), Prospect theory (Chapter 24), Processing fluency (Section 23.8), Similarity asymmetry (Section 30.1), Information processing model.
- Emotion and affect: Broaden-and-build theory (Section 25.1), Affect circumplex (Section 25.3), Feelings as information (Section 23.7), Emotion and virality (Section 25.4), SOR framework, Scent and emotion (Section 30.12).
- Power and dependence: Resource dependence theory (Section 7.1), Social exchange theory (Section 9.1), Network exchange theory (Section 9.2), Power distance (Section 18.3), Five forces.
- Legitimacy (Section @ref(legitimacy (Section 7.3))): Institutional theory (Section 7.2), Legitimacy (Section 7.3), Stakeholder theory (Section 7.4), Organizational ecology (Section 7.5).
- Learning and capabilities: Resource-based theory (Section 4.1), Knowledge-based view (Section 4.3), Dynamic capabilities (Section 5.1), Absorptive capacity (Section 5.2), Exploration and exploitation (Section 5.3), Geneplore model, Combinatorial creativity.
- Networks and diffusion: Weak ties (Section 9.3), Structural holes (Section 9.4), Social capital (Section 9.5), Diffusion of innovations (Section 10.1), Bass model (Section 10.2), Homophily (Section 30.2), Matthew effect (Section 30.8).
Many theories draw on more than one mechanism, and these bridging theories are often the most generative. Figure 31.10 plots a selection of theories as a network in which each theory is linked to its primary mechanism (solid) and, where relevant, to a secondary mechanism (dashed). Theories cluster around their primary mechanisms, while bridging theories, such as identity signaling (identity and information), the wisdom of the crowd (information and social influence), and the five forces (power and incentives), sit between clusters.
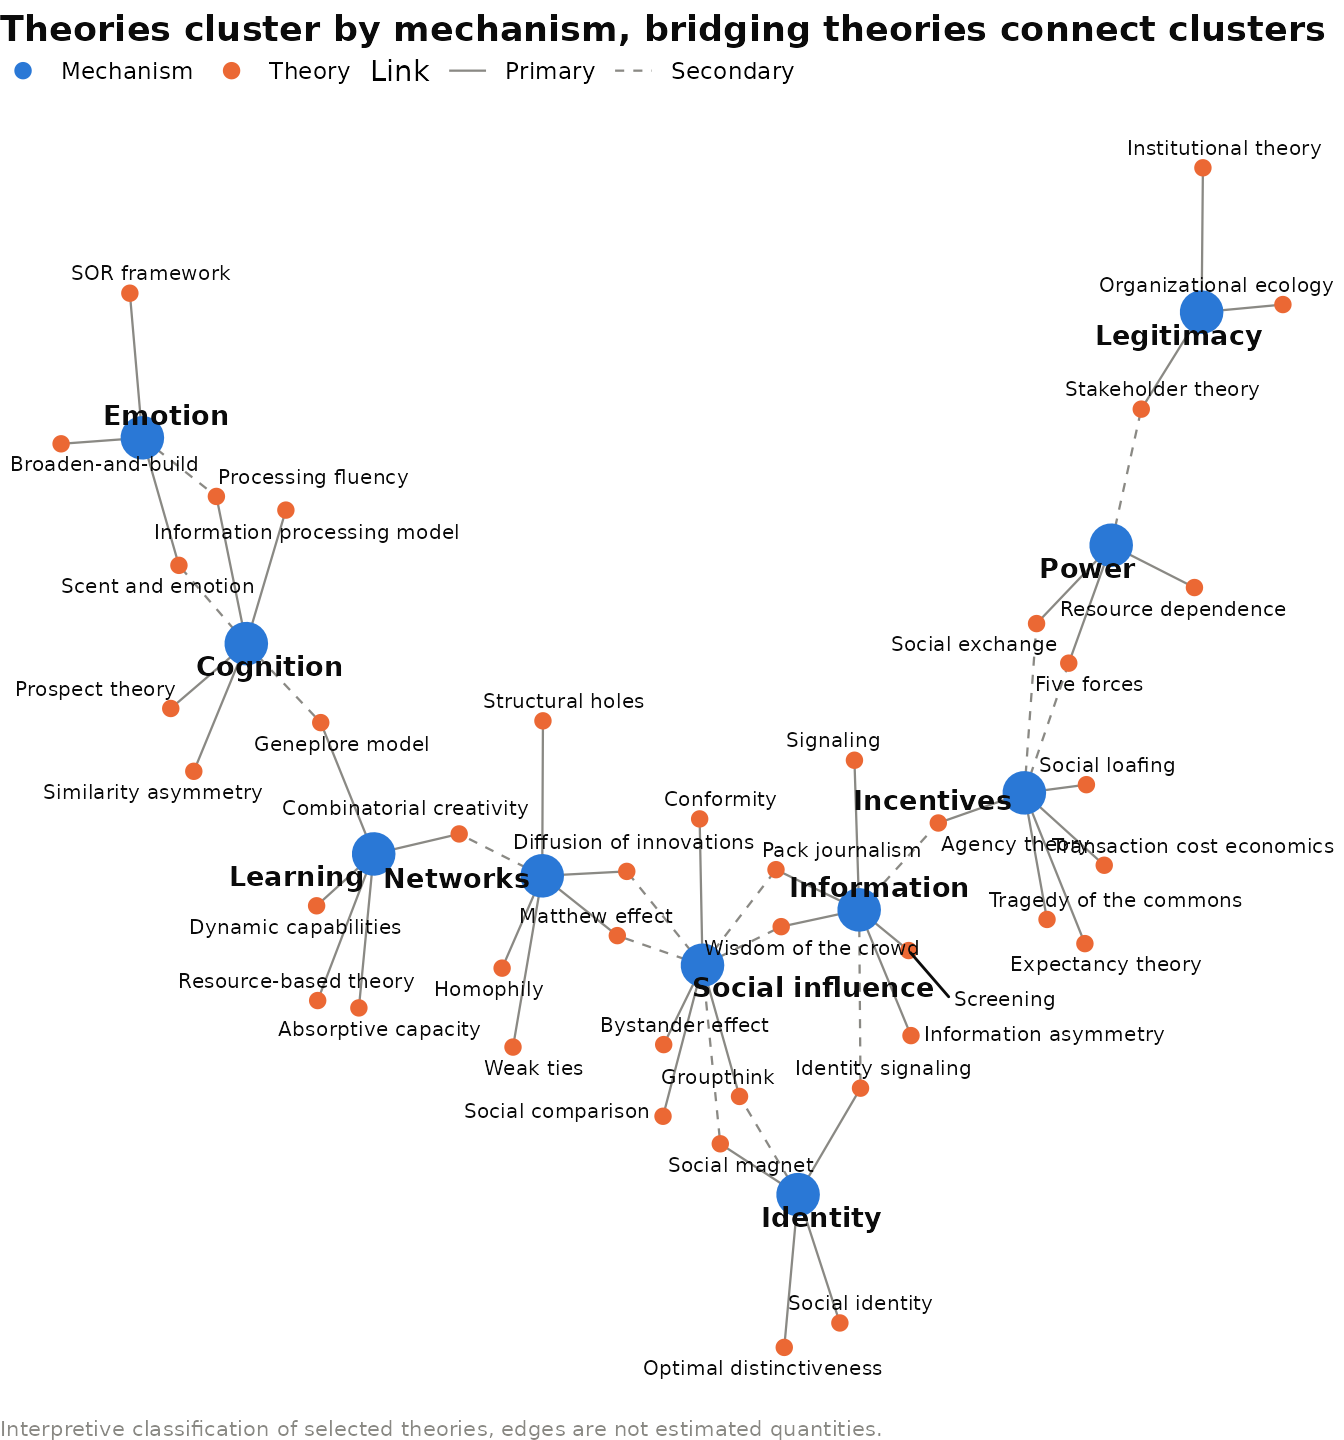
Figure 31.10: A map of selected theories by mechanism. Large nodes are mechanisms. Small nodes are theories from this book. Solid edges link a theory to its primary mechanism. Dashed edges to a secondary mechanism. The classification is the author’s interpretive synthesis, not an empirical estimate.
Using the toolkit in research. (1) Name the mechanism. For any hypothesised X-Y relationship, state which of the ten mechanisms links them and what intervening variable you could measure (beliefs for information, pay-offs for incentives, identification for identity). (2) Look for rival mechanisms. The same correlation often admits several mechanisms, peer adoption can reflect information, social influence, or homophily, and a design that separates them is a stronger contribution than one that merely documents the correlation. (3) Borrow designs across literatures. A remedy or identification strategy that works for one theory often transfers to others that share its mechanism. (4) Specify the level. Indicate whether the mechanism is situational, action- forming, or transformational (Hedström and Swedberg 1998), and measure it at that level.
Pick a business problem you know well: declining customer retention, slow adoption of a new internal tool, or rising supplier prices. Identify the two mechanisms from Table 31.8 most likely to be at work. For each, name one theory from this book that uses the mechanism, one observable indicator that the mechanism is operating, and one intervention it suggests. Where the two mechanisms imply different interventions, design a small test that would tell you which one dominates.
31.7 Chapter Summary
- Frameworks organize problems. Theories explain them by specifying mechanisms and boundary conditions (Whetten 1989).
- The multi-store model describes memory as a flow through sensory, short-term, and long-term stores governed by control processes. Capacity limits and the serial-position curve are its signature evidence (Atkinson and Shiffrin 1968, G. A. Miller 1956, Glanzer and Cunitz 1966). Working memory and levels of processing refine it (A. D. Baddeley and Hitch 1974, Craik and Lockhart 1972).
- The Geneplore model treats creativity as a cycle of generating preinventive structures and exploring them, shaped by existing knowledge and vulnerable to fixation (Finke, Ward, and Smith 1992, Ward 1994).
- Combinatorial creativity holds that innovation is recombination. The most impactful work blends conventional combinations with a tail of novelty, and novel combinations raise variance as well as potential (Weitzman 1998, Fleming 2001, Uzzi et al. 2013).
- The five forces explain industry profitability through entry, supplier and buyer power, substitutes, and rivalry. The value net adds complementors and co-opetition (Michael E. Porter 2008, Brandenburger and Nalebuff 1996).
- The SOR framework links environmental cues to approach or avoidance through emotional states, with direct applications in retail atmospherics (Mehrabian and Russell 1974, Donovan and Rossiter 1982).
- A small set of recurring mechanisms, information, incentives, identity, social influence, cognition, emotion, power, legitimacy, learning, and networks, underlies the theories in this book (Hedström and Swedberg 1998).
Table 31.9 presents the comparison of the chapter’s models and frameworks.
| Framework | Core elements | Central mechanism | Signature evidence or tool | Typical business use |
|---|---|---|---|---|
| Information processing model | Sensory register, short-term store, long-term store, control processes | Cognition (capacity limits) | Serial-position curve | Onboarding, training, advertising recall |
| Geneplore model | Generation, preinventive structures, exploration, constraints | Cognition and learning | Creative invention tasks, fixation studies | Ideation workshops, design processes |
| Combinatorial creativity | Components, combinations, novelty, conventionality | Learning and networks | Patent and citation atypicality | Innovation portfolios, R&D search |
| Five forces / value net | Entry, suppliers, buyers, substitutes, rivalry, complementors | Power and incentives | Industry analysis, variance decomposition | Entry, exit, and positioning decisions |
| SOR framework | Stimulus, organism (PAD), response | Emotion | PAD scales, atmospheric experiments | Store, service, and digital experience design |
| Mechanism toolkit | Situational, action-formation, transformational mechanisms | All ten mechanisms | Synthesis table and map | Diagnosing problems, transferring remedies |
31.8 Discussion Questions
- The levels-of-processing framework argues that depth of processing, not the store in which information resides, determines retention. Design an advertising experiment that would discriminate between the multi-store and levels-of-processing accounts of brand recall.
- Using the Geneplore model, explain why showing a team competitors’ products at the start of an ideation session might reduce the novelty of its ideas. How would you test this in a field setting?
- Uzzi et al. (2013) find that high-impact papers combine conventional and novel pairings. Propose an analogous measure for new consumer products and a hypothesis about its relationship to sales variance.
- Apply the five forces and the value net to the same industry. Where do the two frameworks lead to different strategic recommendations, and why?
- The SOR framework is sometimes criticised as a framework rather than a theory. Which specific theory of the “organism” would you pair it with to explain the effect of music tempo on spending, and what would that pairing predict?
- Choose two theories from different chapters that share a mechanism in Table 31.8. Describe a research design or managerial remedy from one literature that could be transferred to the other.
31.9 Further Reading
- Atkinson and Shiffrin (1968): the original statement of the multi-store model, with a careful distinction between memory structures and control processes.
- A. D. Baddeley and Hitch (1974): the working-memory model that reshaped research on short-term memory. Read alongside Craik and Lockhart (1972) for the main alternative.
- Finke, Ward, and Smith (1992): the book that introduced the Geneplore model and the creative cognition approach.
- Uzzi et al. (2013): a landmark large-scale study of how conventional and atypical combinations shape scientific impact. Pair it with Fleming (2001).
- Michael E. Porter (2008): Porter’s own restatement of the five forces, including common errors in applying them.
- Brandenburger and Nalebuff (1996): the value net and the logic of co-opetition, written for managers.
- Donovan and Rossiter (1982): the study that brought environmental psychology and the SOR framework into retailing.
- Hedström and Swedberg (1998): the foundational collection on mechanism-based explanation in the social sciences.