29 Named Effects in Behavioral Science
A software company adds a “Pro” plan that almost no one buys, and sales of its “Business” plan rise. A furniture retailer sells flat-packed products that customers must assemble themselves, and customers seem to like them more for the trouble. A soft-drink brand that has advertised the same slogan for years worries that its campaign has “worn out”, while a challenger worries that no one has heard of it at all. A board appoints its first female chief executive just as the firm enters a crisis. Behavioural scientists have a name for each of these patterns, the decoy effect, the IKEA effect, mere exposure and wear-out, the glass cliff, and much of applied behavioural science consists of recognising such patterns and knowing when they will and will not appear.
This chapter is a field guide to named effects that recur in management, marketing, and organisational research. A named effect is not the same thing as a theory. An effect is a reliable empirical regularity: a pattern linking a manipulation or condition to an outcome. A theory explains why the regularity occurs and therefore predicts when it will occur. Many effects in this chapter have several candidate explanations, and part of the craft of using them is connecting each effect to the mechanisms developed elsewhere in the book: processing fluency (Section 23.8), prospect theory (Chapter 24), signaling (Section 8.2), and social identity (Section 22.2). Social facilitation (Section 22.6), a close relative of several effects here, is covered with social influence in Social facilitation (Section 22.6) (Table 29.1).
| Effect | One-line definition | Key source | Business use | Evidence strength |
|---|---|---|---|---|
| Mere exposure | Repeated exposure to a stimulus increases liking for it | Zajonc (1968), Bornstein (1989) | Ad frequency, brand familiarity | Strong (meta-analytic) |
| Warm-glow heuristic | Positive stimuli feel more familiar, even without prior exposure | Monin (2003) | Brand familiarity judgments, recognition research | Moderate (focused programme) |
| Goldilocks (inverted-U) | Liking peaks at moderate novelty or complexity | Berlyne (1970), McCall & McGhee (1977) | Product and ad design, innovation newness | Moderate, shape depends on measure |
| Coolidge | Renewed sexual interest with a novel partner (non-human animals) | Wilson, Kuehn & Beach (1963), Dewsbury (1981) | Analogy for variety seeking and novelty in product lines | Strong in animals, analogical for consumers |
| Bandwagon / snob / Veblen | Demand rises or falls with others’ consumption or with price itself | Leibenstein (1950) | Luxury pricing, scarcity, network goods | Strong theoretical basis, mixed measurement |
| Glass cliff | Women and minorities are disproportionately appointed to precarious leadership roles | Ryan & Haslam (2005) | Succession and board decisions | Moderate, context-dependent |
| IKEA effect | Labour invested in creating a product increases its valuation | Norton, Mochon & Ariely (2012) | Self-assembly, co-creation, customisation | Moderate |
| Decoy (attraction) | Adding a dominated option increases choice of the option that dominates it | Huber, Payne & Puto (1982) | Pricing tiers and product line design | Contested, strongest with numeric attributes |
| Anchoring | Estimates are biased toward an initially considered number | Tversky & Kahneman (1974) | Reference prices, negotiation, forecasting | Strong (multi-lab replication) |
| Beauty in averageness | Averaged or prototypical stimuli are judged attractive | Langlois & Roggman (1990) | Product design typicality | Strong for faces, moderate for products |
| Pratfall | A minor blunder makes a highly competent person more likeable | Aronson, Willerman & Floyd (1966) | Brand candour, leader communication | Limited, moderated by observer and context |
The evidence-strength column is a summary judgment, not a formal rating. It reflects the size and consistency of the literature, the existence of meta-analyses or multi-laboratory replications, and known disputes about robustness. Section 29.12 returns to the question of how much confidence to place in named effects.
29.1 Mere Exposure Effect
Core claim. Repeated exposure to a stimulus, without any reinforcement, increases liking for it.
Origins. Social psychology, Zajonc (1968), meta-analysed by Bornstein (1989) and, with a focus on the shape of the exposure-liking curve, by Montoya et al. (2017).
Level of analysis. Individual perceiver.
Key constructs. Exposure frequency, stimulus complexity, exposure duration, recognition, familiarity, liking, boredom (tedium).
Boundary conditions. Strongest for initially neutral or unfamiliar stimuli, brief exposures, and complex stimuli. Weak or reversed for initially disliked stimuli and after many exposures, when tedium sets in.
Related theories. Processing fluency (Section 23.8), Warm-glow heuristic, Goldilocks effect, Elaboration likelihood model (Section 26.1).
29.1.1 Core logic and evidence
Zajonc (1968) proposed that “mere repeated exposure” of an individual to a stimulus is a sufficient condition for enhancing his or her attitude toward it. He combined correlational evidence, words that appear more frequently in natural language tend to have more positive meanings, with experiments in which participants saw nonsense words, Chinese-like characters, or photographs of faces between zero and 25 times and then rated how much they liked them or how “good” their meaning was. Ratings rose with frequency of exposure. The finding was striking because it required no reward, no persuasive argument, and no conscious evaluation: frequency alone was enough.
Later work showed that the effect does not require conscious recognition. Kunst-Wilson and Zajonc (1980) presented irregular polygons so briefly that participants could not recognise them above chance later. Nonetheless, when asked which of two polygons they liked more, participants tended to prefer the ones they had seen before. Bornstein (1989) reviewed the first two decades of research and concluded that the effect is robust across stimuli and settings. His meta-analysis also identified moderators that remain central to applied work: the effect is stronger for brief exposures and for stimuli that are not consciously recognised, stronger for complex than for simple stimuli, and tends to level off after a moderate number of exposures, with very long exposure sequences producing smaller effects.
29.1.2 Mechanism
Two broad explanations dominate. The fluency account holds that prior exposure makes a stimulus easier to perceive and process, and that this ease is experienced as a mildly positive feeling that is attributed to the stimulus itself (Reber, Schwarz, and Winkielman 2004). The account explains why the effect is stronger when people do not recognise the stimulus: if people realise that a stimulus feels easy because they have seen it before, they discount the feeling. The two-factor account adds a second process. Exposure produces positive habituation (reduced uncertainty and increasing fluency) but also tedium: boredom that accumulates with repetition. Liking is the net of the two, so it first rises and then falls. Cacioppo and Petty (1979) documented the pattern for persuasive messages: agreement with a message rose from one to three presentations and then fell at five, while counter-arguments followed the opposite pattern. Figure 29.1 illustrates the two-factor logic.
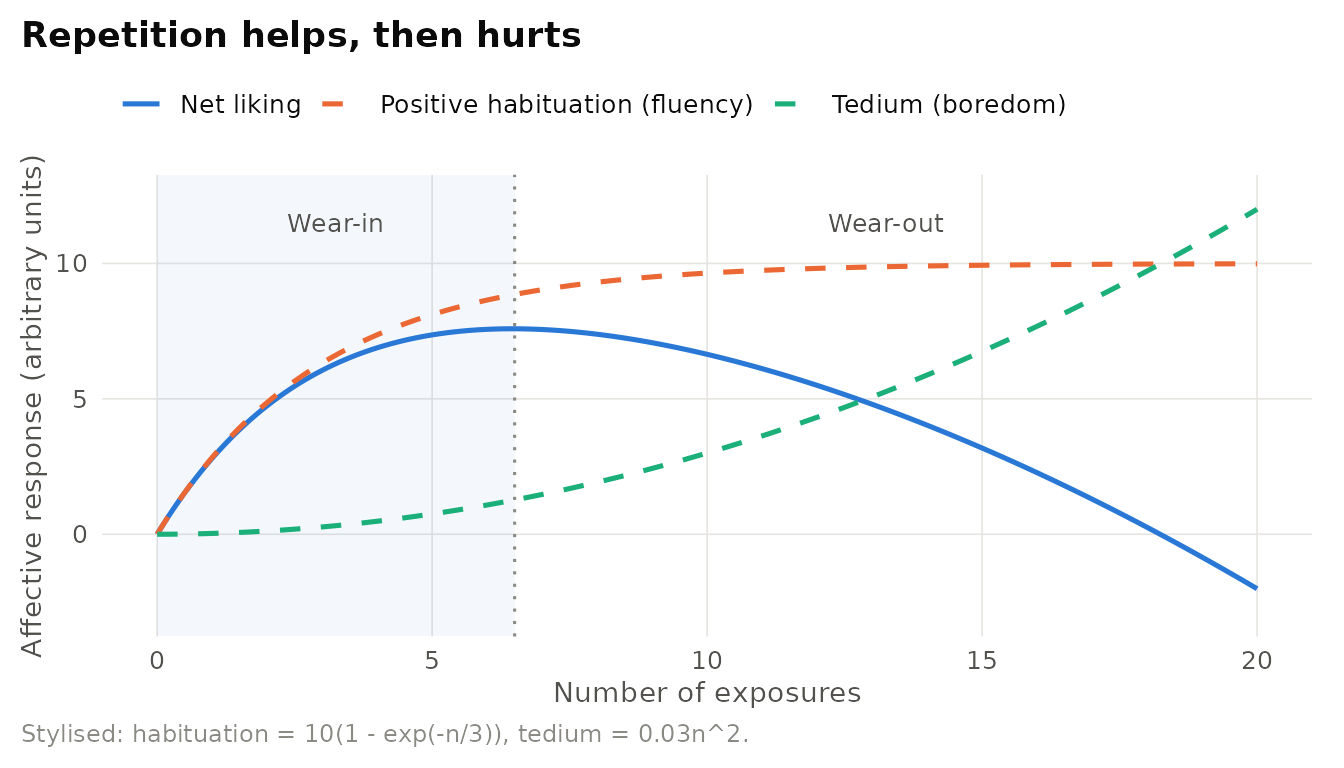
Figure 29.1: Stylised two-factor model of repetition. Positive habituation rises quickly and saturates, tedium accumulates with repetition. Net liking first rises (wear-in) and then declines (wear-out). Curves are illustrative functions, not estimates.
Table 29.2 summarises the moderators most relevant to practice.
| Moderator | Direction of effect | Likely mechanism | Managerial implication |
|---|---|---|---|
| Number of exposures | Rises, then levels off or declines | Habituation versus tedium | Plan frequency caps, monitor wear-out |
| Stimulus complexity | Larger effect for complex stimuli | Complex stimuli take longer to become boring | Richer creative executions sustain repetition |
| Exposure duration / awareness | Larger for brief, unrecognised exposures | Fluency is misattributed when its source is not noticed | Background placements can build familiarity |
| Initial valence | Weak or reversed for initially disliked stimuli | Repetition can intensify an existing reaction | Do not repeat a disliked execution |
| Variation across exposures | Varied executions delay wear-out | Reduces tedium while preserving the core stimulus | Rotate creative around a constant brand cue |
Brand familiarity and ad repetition: wear-in and wear-out. Media planners work with the two-factor curve every day, even when they do not call it that. A new brand needs wear-in: enough exposures for consumers to recognise the brand and to process its logo and packaging fluently. An established campaign risks wear-out: after many exposures, the same execution bores or irritates, and consumers begin to counter-argue. Practitioners respond in three ways that follow directly from the moderators above. They set frequency caps in digital campaigns to limit how often one person sees an advertisement. They rotate creative executions that vary the surface while holding constant the brand cues that should become familiar, and they invest in distinctive brand assets, colours, shapes, sonic logos, that accumulate familiarity across many different executions. The mere exposure effect also cautions against a naive reading of brand-tracking data: familiarity can raise liking without any change in beliefs about the product, so rising preference is not necessarily evidence that the message was understood.
Sample hypotheses.
- H1. Liking for a new package design will increase over the first several exposures and decline thereafter, with the peak occurring later for more complex designs.
- H2. Varying advertising executions while holding the brand cue constant will delay wear-out relative to repeating a single execution.
Designs. Repeated-exposure experiments with incidental exposure tasks. Field data linking advertising frequency to brand metrics with exposure-level variation. Response-latency measures of fluency.
Measures. Liking ratings, implicit preference measures, recognition, processing speed, brand-tracking familiarity and favourability.
29.2 Warm-Glow Heuristic
Core claim. The positive valence of a stimulus increases its perceived familiarity, even when the person has never encountered it before. Familiarity breeds liking, but liking also breeds a feeling of familiarity.
Origins. Social cognition, Monin (2003).
Level of analysis. Individual perceiver.
Key constructs. Stimulus valence (attractiveness, positivity), perceived familiarity, recognition judgments, misattribution of affect.
Boundary conditions. Most pronounced when people have little diagnostic memory information and must rely on feelings to judge whether something is familiar.
Related theories. Mere exposure, Discrepancy attribution hypothesis (Section 23.9), Feelings-as-information theory (Section 23.7), Processing fluency (Section 23.8).
29.2.1 Core logic and evidence
The mere exposure effect runs from familiarity to liking. Monin (2003) asked whether the arrow can also run in the opposite direction. In a series of studies he found that attractive faces were judged more familiar than less attractive faces, and positive words were more likely than neutral or negative words to be mistakenly “recognised” as having appeared earlier, even when none of the stimuli had been shown before. He called this the warm-glow heuristic: people experience a positive affective glow and use it, among other cues, to infer that a stimulus is familiar. The account is a form of misattribution: a feeling that arises from one source (the stimulus’s positivity) is attributed to another (past exposure).
The warm-glow heuristic completes a loop. Familiar things feel easy to process and are liked. Liked things feel familiar. Each process can reinforce the other, which helps explain why well-liked brands are often over-estimated in familiarity and why it is difficult to disentangle familiarity from liking in survey measures.
Confusing the warm-glow heuristic with warm-glow giving. The phrase “warm glow” is used for two unrelated ideas. Monin (2003)’s warm-glow heuristic is a cognitive effect in which positive stimuli feel familiar. Andreoni (1990)’s warm-glow giving is an economic model of charitable behaviour in which donors derive utility from the act of giving itself, not only from the total amount of the public good provided: a form of impure altruism. Andreoni’s model explains, for example, why government contributions to a public good do not fully crowd out private donations. Citing one when the argument requires the other is a common error in student and practitioner writing. Table 29.3 distinguishes them.
| Feature | Warm-glow heuristic | Warm-glow giving |
|---|---|---|
| Discipline | Social cognition / psychology | Public economics |
| Key source | Monin (2003) | Andreoni (1990) |
| Phenomenon | Positive stimuli are judged more familiar | People enjoy the act of giving itself |
| Mechanism | Misattribution of positive affect to familiarity | Utility from one’s own contribution (impure altruism) |
| Typical outcome | Familiarity and recognition judgments | Donations, crowding-out of private giving |
| Business application | Interpreting brand-familiarity and recognition data | Designing donation appeals and cause marketing |
Measuring brand awareness. Brand-tracking surveys often ask respondents whether they have heard of a brand (aided awareness) and how they feel about it. The warm-glow heuristic implies that the two answers are not independent: respondents who like a brand’s name, logo, or category may report familiarity with it even without prior exposure. One practical safeguard is to include foil brands, plausible but fictitious names, in awareness questions. The rate of “recognition” of foils estimates the false-alarm rate, and positive-sounding foils are likely to attract more false recognition than neutral ones. Comparing real brands against valence-matched foils yields a cleaner awareness estimate.
29.3 Goldilocks Effect
Core claim. Many affective and attentional responses follow an inverted-U: people prefer stimuli that are moderately novel, complex, or discrepant from what they know, not too familiar, not too strange, but “just right”.
Origins. Experimental aesthetics (Berlyne 1970, 1971), developmental psychology (R. B. McCall and McGhee 1977, Kidd, Piantadosi, and Aslin 2012), the “just right” label was popularised in consumer behaviour by Berger (2016).
Level of analysis. Individual perceiver.
Key constructs. Novelty, complexity, arousal potential, schema discrepancy, familiarity, optimal level of stimulation.
Boundary conditions. The location of the peak depends on the perceiver’s expertise and prior exposure. Some measures (such as typicality-based preference) show monotonic rather than inverted-U patterns.
Related theories. Mere exposure, Beauty in averageness, Optimal distinctiveness theory (Section 22.3), Hedonic adaptation (Section 25.2).
29.3.1 Origins and core logic
The idea that hedonic value peaks at intermediate stimulation is old, it is often represented as the Wundt curve, but its modern form owes most to Daniel Berlyne’s psychobiological aesthetics. Berlyne (1971) argued that stimulus properties such as novelty, complexity, surprisingness, and ambiguity jointly determine a stimulus’s arousal potential, and that hedonic value is highest at moderate arousal potential. Berlyne (1970) examined how novelty and complexity interact with exposure: repeated exposure tended to make simpler patterns less pleasing while more complex patterns retained or gained appeal, because complex patterns take longer to become fully familiar.
Developmental psychologists reached a similar conclusion about attention. The discrepancy hypothesis holds that infants attend most to stimuli that are moderately discrepant from their existing schemas. Stimuli that match a schema exactly are uninteresting, and stimuli that are wildly discrepant cannot be assimilated (R. B. McCall and McGhee 1977). Kidd, Piantadosi, and Aslin (2012) provided a modern test using an information-theoretic measure of how predictable each event in a visual sequence was. Infants were least likely to look away from sequences of intermediate predictability, and more likely to look away when events were either highly predictable or highly surprising: a “Goldilocks effect” in attention.
In consumer research, Meyers-Levy and Tybout (1989) found an analogous pattern for product evaluation: products that were moderately incongruent with their category schema were evaluated more favourably than products that were fully congruent or extremely incongruent, because moderate incongruity can be resolved and the resolution is itself rewarding. Berger (2016) summarises the general lesson for social influence: things that are too novel feel unfamiliar and uneasy. Things that are too familiar feel boring. Optimal appeal lies in between (Figure 29.2).
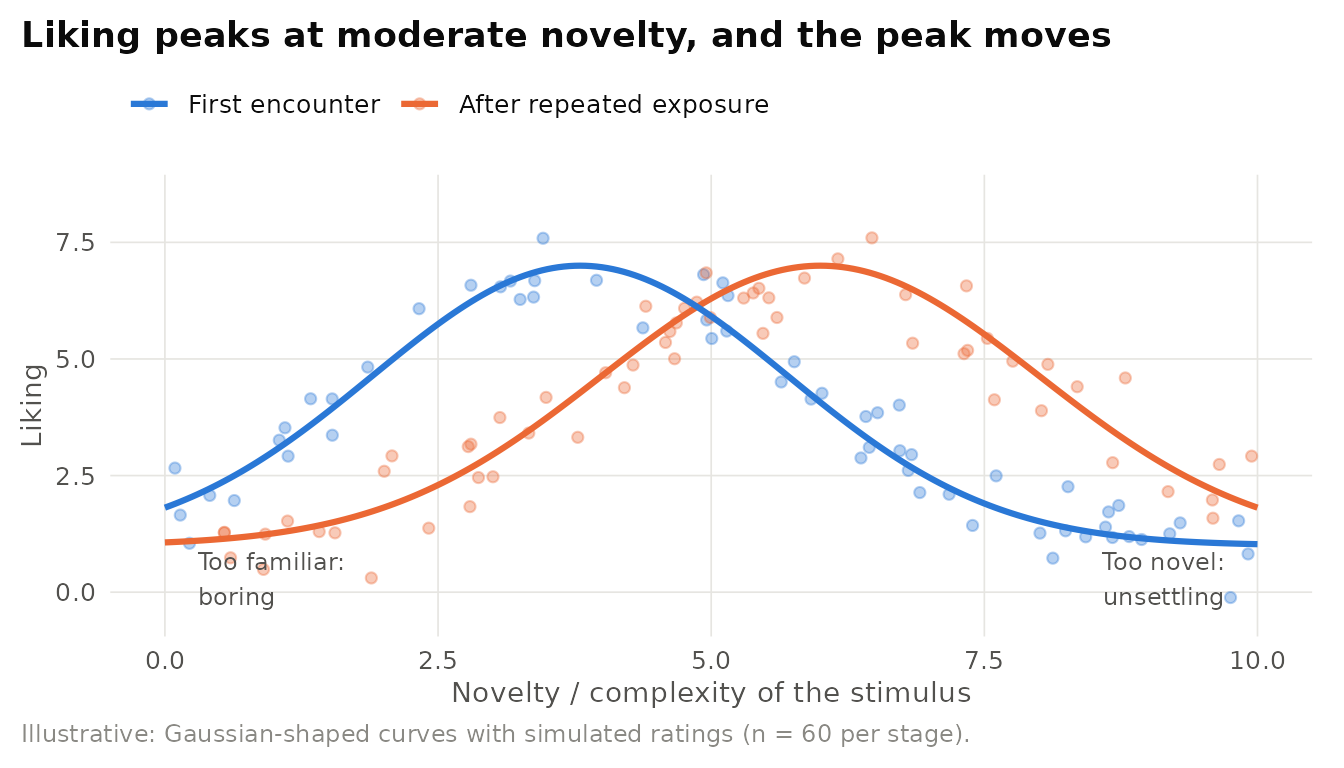
Figure 29.2: Illustrative inverted-U between novelty and liking. With repeated exposure, simple stimuli become boring and the preferred level of novelty shifts upward. Curves are stylised functions, points are simulated ratings.
Inverted-U or monotonic typicality? Berlyne’s framework predicts that moderately novel or complex stimuli are preferred. Yet studies by Martindale and colleagues found that typicality, how representative a stimulus is of its category, often predicted aesthetic preference better than novelty or complexity, a result they described as anomalous for Berlyne’s theory (Martindale, Moore, and West 1988, Martindale, Moore, and Borkum 1990). The finding links directly to the beauty-in-averageness effect. One reconciliation is that typicality and novelty are not opposite ends of one dimension: a design can be both recognisably typical and fresh in its details. Hekkert, Snelders, and Wieringen (2003) found that typicality and novelty were both positively related to preference for industrial designs once their negative correlation with each other was taken into account: the “most advanced, yet acceptable” principle. For researchers, the lesson is to measure typicality and novelty separately rather than assuming they are mirror images.
Product design and innovation newness. Firms launching new products face a Goldilocks trade-off. A design that is too close to existing products fails to attract attention or justify a premium. A design that is too radical can confuse consumers and depress adoption until the market catches up. Automotive design is a frequently discussed case: manufacturers typically evolve the appearance of established models gradually, preserving recognisable cues while refreshing details, and reserve radical departures for concept cars that test consumer reactions. The inverted-U also implies that the optimal level of novelty differs by segment. Experts and enthusiasts, who have seen many variants, tend to prefer higher novelty than novices, so a product line may include a mainstream variant for the broad market and a more adventurous variant for enthusiasts.
29.4 Coolidge Effect
Core claim. In many mammalian species, a male that has reached sexual satiety with one partner shows renewed sexual behaviour when a novel receptive partner is introduced.
Origins. Comparative psychology, J. R. Wilson, Kuehn, and Beach (1963), reviewed by Dewsbury (1981), the name refers to an anecdote about US President Calvin Coolidge reported in R. N. Johnson (1972).
Level of analysis. Individual organism.
Key constructs. Sexual satiety, stimulus novelty, recovery of responding.
Boundary conditions. Documented primarily in non-human animals. The extent and form of the effect vary across species and between sexes. Applications to human consumption are analogies, not direct applications.
Related theories. Goldilocks effect, Hedonic adaptation (Section 25.2), Mere exposure.
The name comes from a story that has been retold many times. As reported by R. N. Johnson (1972):
“… The President and Mrs. Coolidge were being shown (separately) around an experimental government farm. When [Mrs. Coolidge] came to the chicken yard she noticed that a rooster was mating very frequently. She asked the attendant how often that happened and was told, ‘Dozens of times each day.’ Mrs. Coolidge said, ‘Tell that to the President when he comes by.’ Upon being told, the President asked, ‘Same hen every time?’ The reply was, ‘Oh, no, Mr. President, a different hen every time.’ President: ‘Tell that to Mrs. Coolidge.’”
The anecdote is almost certainly apocryphal, but the phenomenon is well documented. J. R. Wilson, Kuehn, and Beach (1963) showed that male rats that had stopped copulating with one female resumed sexual activity when a new female was introduced. Dewsbury (1981) reviewed evidence across many species, showing that novelty effects on copulatory behaviour are widespread but vary in form. Effects in females have been studied less and appear in some species but are generally weaker or different in form.
29.4.1 The business analogue: satiation and variety seeking
The underlying principle, that responding to a stimulus declines with repetition and recovers when the stimulus changes, has close parallels in consumer behaviour that do not depend on any claim about sexuality. Sensory-specific satiety is the decline in the pleasantness of a food as it is eaten, relative to foods that have not been eaten. B. J. Rolls et al. (1981) showed that the decline is specific to the eaten food, which helps explain why people eat more when offered variety. Variety seeking, switching among options for the sake of change, has been studied extensively in marketing (McAlister and Pessemier 1982). Ratner, Kahn, and Kahneman (1999) found that people sometimes choose less-preferred items for the sake of variety, and that this can reduce moment-to-moment enjoyment even when people remember the varied sequence favourably.
Novelty in product lines. Food and beverage companies, quick-service restaurants, and consumer-goods firms manage satiation through rotating flavours, limited-time offers, and seasonal menus. These tactics address a real problem: consumers who are satiated on one variant may switch brands rather than stop buying the category. Offering variety within the brand captures that switching. Media and entertainment platforms do the same through recommendation algorithms that balance familiar content with new content. The research also warns of costs: excessive variety increases complexity and inventory costs, and, as Ratner, Kahn, and Kahneman (1999) suggest, variety chosen for its own sake does not always improve experienced satisfaction.
29.5 Bandwagon, Snob, and Veblen Effects
Core claim. An individual’s demand for a good can depend on how many others consume it and on its price as such. Under a bandwagon effect, demand rises because others consume the good. Under a snob effect, demand falls because others consume it. Under a Veblen effect, demand rises with the price itself, because a high price displays wealth.
Origins. Economics, Leibenstein (1950), building on Veblen (1899), extended in Bagwell and Bernheim (1996).
Level of analysis. Individual consumer and market demand.
Key constructs. Functional versus non-functional demand, external consumption effects, conspicuous price, exclusivity, status.
Boundary conditions. Requires that consumption be observable or that its price be known to relevant others. Strongest for status goods, fashion, and goods whose value depends on network size.
Related theories. Costly signaling (Section 8.4), Identity signaling (Section 8.5), Countersignaling (Section 8.6), Optimal distinctiveness (Section 22.3).
29.5.1 Core logic
Standard demand theory assumes that a consumer’s demand for a good depends on its price, the consumer’s income, and the prices of other goods, but not on what other people buy. Leibenstein (1950) relaxed that assumption. He distinguished functional demand, which depends on the qualities inherent in the good, from non-functional demand arising from external effects on utility. Among the latter, he identified three (Table 29.4):
| Effect | Demand depends on | Direction | Consequence for market demand | Business example |
|---|---|---|---|---|
| Bandwagon | Number of others consuming | Positive: more adopters, more demand | Demand is more price-elastic than functional demand | Fashion trends, social platforms, best-seller lists |
| Snob | Number of others consuming | Negative: more adopters, less demand | Demand is less price-elastic than functional demand | Limited editions, niche luxury, exclusive clubs |
| Veblen | Price itself (conspicuous price) | Positive: higher price, more demand over some range | Demand curve can slope upward over a range | Prestige watches, luxury handbags, premium spirits |
The snob effect connects to the identity-signaling literature reviewed in Chapter 8: people avoid goods that have become too common because the goods no longer signal distinction (Berger and Heath 2007). The Veblen effect connects to costly signaling: a good whose price is high and known can function as a credible display of wealth (Veblen 1899, Bagwell and Bernheim 1996). When many people adopt a status good, early adopters may abandon it, and marketers respond by cultivating an illusion of distinction: emphasising the ways in which offerings differ, even when they are similar at the core. Figure 29.3 sketches the implications for demand curves.
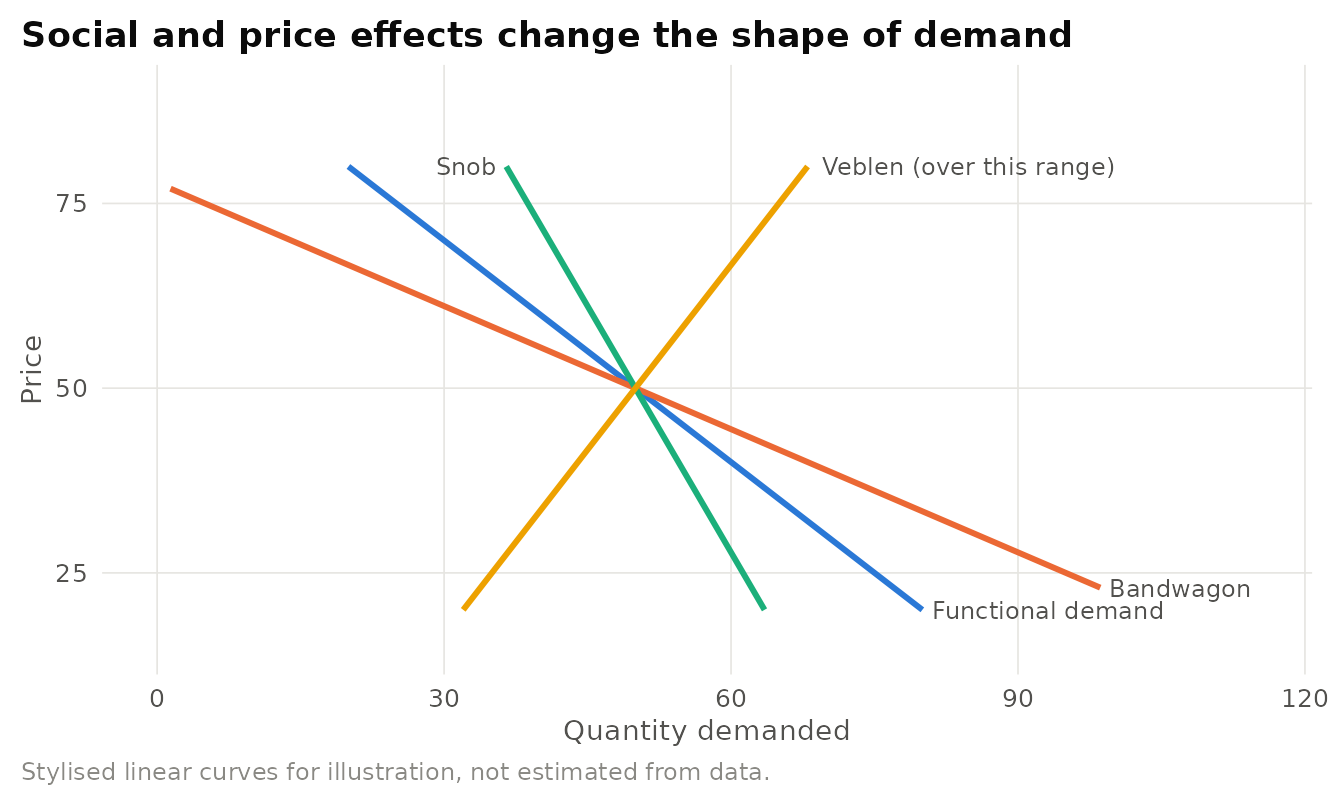
Figure 29.3: Stylised market demand curves. Relative to functional demand, a bandwagon effect makes demand more price-elastic, a snob effect makes it less elastic, and a Veblen effect can produce an upward-sloping segment over a range of prices. All curves pass through a common point for comparison.
Luxury scarcity versus mass adoption. Luxury houses manage the snob and Veblen effects deliberately. They restrict distribution to owned boutiques and selected retailers, limit production of iconic items, avoid frequent discounting, and sometimes allocate the most desirable products to established clients rather than selling them to anyone who walks in. Each practice preserves exclusivity and keeps price conspicuous. The tension with growth is real: expanding into accessible “masstige” lines, outlet stores, or heavy discounting can attract new customers while diluting the brand’s value to existing ones. The controversy in 2018, when Burberry disclosed that it had been destroying unsold stock to protect its brand and then announced it would end the practice, illustrates the costs of defending exclusivity in an era of sustainability scrutiny. By contrast, products with strong bandwagon or network effects (Section 17.6), social platforms, messaging apps, marketplaces, benefit from rapid mass adoption, and their managers subsidise early users to reach critical mass. Diagnosing which effect dominates in a category is therefore a strategic decision with opposite implications for pricing and distribution.
Mistaking a quality inference for a Veblen effect. Demand that rises with price is not necessarily a Veblen effect. Consumers may infer quality from price when quality is hard to observe, which is an information effect (see Signaling theory (Section 8.2)), not a desire to display price to others. Distinguishing the two requires variation in observability: a Veblen effect should be stronger for publicly consumed goods, whereas price-quality inference should operate for private goods as well.
29.6 Glass Cliff Effect
Core claim. Women, and, in later research, members of racial and ethnic minority groups, are more likely than white men to be appointed to leadership positions that are precarious: roles in organisations that are performing poorly or are in crisis, where the risk of failure and criticism is high.
Origins. Organisational and social psychology, M. K. Ryan and Haslam (2005), reviewed in M. K. Ryan et al. (2016) and meta-analysed in Morgenroth et al. (2020).
Level of analysis. Individual appointment decisions within organisations, board and organisational level.
Key constructs. Precariousness (prior performance, crisis), leader gender and ethnicity, leadership stereotypes (“think manager-think male”, “think crisis-think female”), signalling change, scapegoating.
Boundary conditions. Depends on how precariousness is measured (share-price versus accounting performance), on the history of leadership in the organisation, and on the country and industry context.
Related theories. Upper echelons theory (Section 6.4), Social identity theory (Section 22.2), Signaling (Section 8.2), Agency theory (Section 6.1).
29.6.1 Origins and evidence
The glass cliff was identified as a response to a public claim. In 2003, a newspaper article argued that companies with more women on their boards performed worse. M. K. Ryan and Haslam (2005) examined the timing of board appointments in FTSE 100 companies and found the reverse causal story: companies that appointed women to their boards had typically experienced consistently poor share-price performance in the months before the appointment, whereas companies that appointed men had relatively stable performance. Women were not causing poor performance. They were more likely to be appointed when performance was already poor. The authors coined the term glass cliff to complement the familiar “glass ceiling”: even when women break through to leadership, they may be placed in positions where failure is more likely.
Subsequent research, reviewed in M. K. Ryan et al. (2016), used both archival and experimental designs. In experiments, participants, including business and law students and managers, choose between equally qualified male and female candidates for a leadership role or high-risk assignment that is described as either going well or going badly. Female candidates are more often chosen when the situation is described as precarious. M. K. Ryan et al. (2011) found that the stereotype of the ideal manager shifts in crisis: people associate the characteristics needed to manage a failing company with stereotypically female traits more than they do for a successful company (“think crisis-think female”). Bruckmüller and Branscombe (2010) found that preference for a female leader in crisis depended on the organisation’s leadership history: when a company had been led by men, a crisis increased the preference for a woman, in part because appointing a woman signalled change.
The pattern is not limited to gender. Studying chief executives of Fortune 500 firms, A. Cook and Glass (2014) found that women and racial and ethnic minorities were more likely than white men to be promoted to CEO of weakly performing firms, and that when firm performance declined during their tenure, they were more likely to be replaced by white men: a pattern the authors described as a “saviour effect” (Figure 29.4).
Figure 29.4: Mechanisms proposed for the glass cliff. Organisational precariousness activates beliefs about what a crisis requires and a desire to signal change. These shape appointments of women and minorities to risky roles, whose higher failure risk can feed back into stereotypes about their leadership.
Table 29.5 presents the explanations for the glass cliff.
| Explanation | Core argument | Representative evidence |
|---|---|---|
| Think crisis-think female | Stereotypically female traits are seen as fitting crisis management | Ryan et al. (2011) |
| Signalling change | Appointing a non-traditional leader signals that the organisation is changing course | Bruckmuller & Branscombe (2010) |
| Scapegoating | Leaders appointed in crisis can be blamed if recovery fails | Discussed in Ryan et al. (2016) |
| Limited alternatives | Candidates with fewer opportunities may accept riskier roles | Discussed in Ryan et al. (2016) |
| In-group protection | Decision makers shield members of their own group from risky roles | Discussed in Ryan et al. (2016) |
| Saviour effect | Minority leaders are replaced by white men when performance declines | Cook & Glass (2014) |
How general is the glass cliff? Archival evidence is sensitive to measurement choices. Using US data and several performance measures, S. M. Adams, Gupta, and Leeth (2009) did not find that female executives were systematically appointed to firms with poorer prior performance, suggesting that the original pattern might depend on the performance measure, the market, or the period. Experimental evidence is more consistent, but experiments abstract from real selection processes. A meta-analysis by Morgenroth et al. (2020) found evidence for the glass cliff while documenting substantial variation across study designs, samples, and contexts. A balanced reading is that the glass cliff is a real tendency whose strength depends on context: in particular, on the organisation’s leadership history and on how precariousness is defined and observed by decision makers.
Leadership appointments in crisis firms. Consider an illustrative scenario: a retailer’s board must replace a chief executive after a year of falling sales and a data breach. The board’s shortlist contains an internal female executive and an external male candidate. Glass cliff research does not say which candidate to choose. It identifies risks in how the decision is made and implemented. First, boards should ask whether the appointment is driven by a desire to signal change rather than by an assessment of fit, because signalling motives can coexist with under-investment in the new leader’s success. Second, boards should equip leaders appointed to turnarounds with the resources a turnaround requires, authority to restructure, board support, time, and set performance expectations that reflect the starting position rather than the industry average. Third, evaluation should be benchmarked against the counterfactual trajectory of the firm, so that a leader who slows a decline is not judged a failure. These practices protect the firm as well as the leader: an under-supported turnaround is costly regardless of who leads it.
Sample hypotheses.
- H1. The probability that a newly appointed CEO is a woman increases with the firm’s negative performance in the preceding year.
- H2. This relationship is stronger for firms with a history of exclusively male leadership (Bruckmüller and Branscombe 2010).
- H3. Conditional on performance during tenure, women and minority CEOs face a higher hazard of dismissal than white male CEOs (A. Cook and Glass 2014).
Designs. Archival panels of executive and board appointments with lagged performance measures. Event-history models of tenure. Vignette experiments manipulating precariousness and leadership history.
Measures. Prior share-price and accounting performance, analyst downgrades, crisis events, leader demographics, tenure and exit.
29.7 IKEA Effect
Core claim. People value products that they have created or assembled themselves more than equivalent products created by others: labour leads to love.
Origins. Consumer psychology, Norton, Mochon, and Ariely (2012), related to the “I designed it myself” effect in mass customisation (Franke, Schreier, and Kaiser 2010) and to effort justification (Aronson and Mills 1959).
Level of analysis. Individual consumer.
Key constructs. Self-created product, labour or effort, task completion, feelings of competence and accomplishment, willingness to pay.
Boundary conditions. The effect depends on successful completion. It disappears when people fail to complete the task or when their creation is destroyed, and very frustrating tasks may reduce rather than increase valuation.
Related theories. Endowment effect (Section 23.4), Self-determination theory (Section 19.6), Decoy effect (another lever in product-line design).
29.7.1 Core logic and evidence
Norton, Mochon, and Ariely (2012) named the effect after the Swedish furniture retailer whose flat-pack products require customers to assemble them. In their experiments, participants who assembled a simple storage box were willing to pay more for it than participants who inspected an identical, pre-assembled box. Participants who folded origami valued their own amateur creations far above how other people valued them, and close to the value they placed on origami made by experts, and they expected others to share their valuation. Crucially, the effect depended on completion: when participants built and then destroyed their creations, or did not complete them, the increase in valuation disappeared.
The effect has three candidate mechanisms that are not mutually exclusive. The first is effort justification: people value outcomes for which they have suffered, as in the classic finding that a severe initiation increased liking for a group (Aronson and Mills 1959). The second is competence: successfully completing a task signals to oneself that one is capable, and the product becomes a symbol of that competence. The third is ownership and self-extension: a self-made product is more closely linked to the self, which connects the IKEA effect to the endowment effect (Section 23.4). Franke, Schreier, and Kaiser (2010) found a related pattern in mass customisation: consumers were willing to pay more for products they had designed themselves, beyond what the better fit to their preferences could explain, and this “I designed it myself” effect was associated with a feeling of accomplishment (Figure 29.5).
Figure 29.5: Mechanism of the IKEA effect. Labour that culminates in successful completion produces feelings of competence and ownership, which raise the creator’s valuation. Failure to complete eliminates the effect (Norton, Mochon, & Ariely, 2012).
Co-creation and self-assembly products. The IKEA effect is visible in many business models that ask customers to do part of the work: flat-pack furniture, meal kits that require cooking, build-your-own toys, and online configurators for shoes, computers, and cars. The research suggests three design principles. First, calibrate effort: the task must be demanding enough to feel like an accomplishment but easy enough to complete. Instructions, pre-drilled parts, and modular design reduce the risk of failure that would eliminate the effect. Second, make completion visible: a finished product, a shareable design, or a personalised element ensures that the customer’s contribution is salient. Third, beware the creator’s bias: just as participants expected others to value their origami, customers and employees overvalue their own creations. In product development, this means that teams can become attached to features they built. In co-creation programmes, it means that participants’ enthusiasm is not a reliable guide to the market’s.
29.8 Decoy Effect
Core claim. Adding an option that is clearly inferior to one existing option (the target) but not to another (the competitor) increases the share of choices going to the target. The effect is also called the attraction effect or asymmetric dominance effect.
Origins. Consumer research, J. Huber, Payne, and Puto (1982), extended by Simonson (1989) and Simonson and Tversky (1992), robustness debated in a 2014 Journal of Marketing Research exchange (Frederick, Lee, and Baskin 2014, J. Huber, Payne, and Puto 2014, Yang and Lynn 2014).
Level of analysis. Individual choice, market shares.
Key constructs. Target, competitor, decoy, asymmetric dominance, regularity, compromise effect, justification.
Boundary conditions. Strongest when options are described by a small number of numeric attributes, when the dominance relation is easy to see, and when people expect to justify their choice. Weak or absent with perceptual or holistic stimuli.
Related theories. Screening theory (Section 8.3), Heuristics and biases (Section 23.2), Anchoring, Prospect theory (Chapter 24).
29.8.1 Core logic
Most models of rational choice imply regularity: adding a new option to a choice set cannot increase the probability of choosing any option already in the set. The new option can only take share away. J. Huber, Payne, and Puto (1982) showed that this principle can be violated. When they added an option that was dominated by one alternative (worse on both attributes) but not by the other, the share of the dominating alternative increased. Figure 29.6 illustrates the geometry: the decoy sits in the region that the target dominates but the competitor does not.
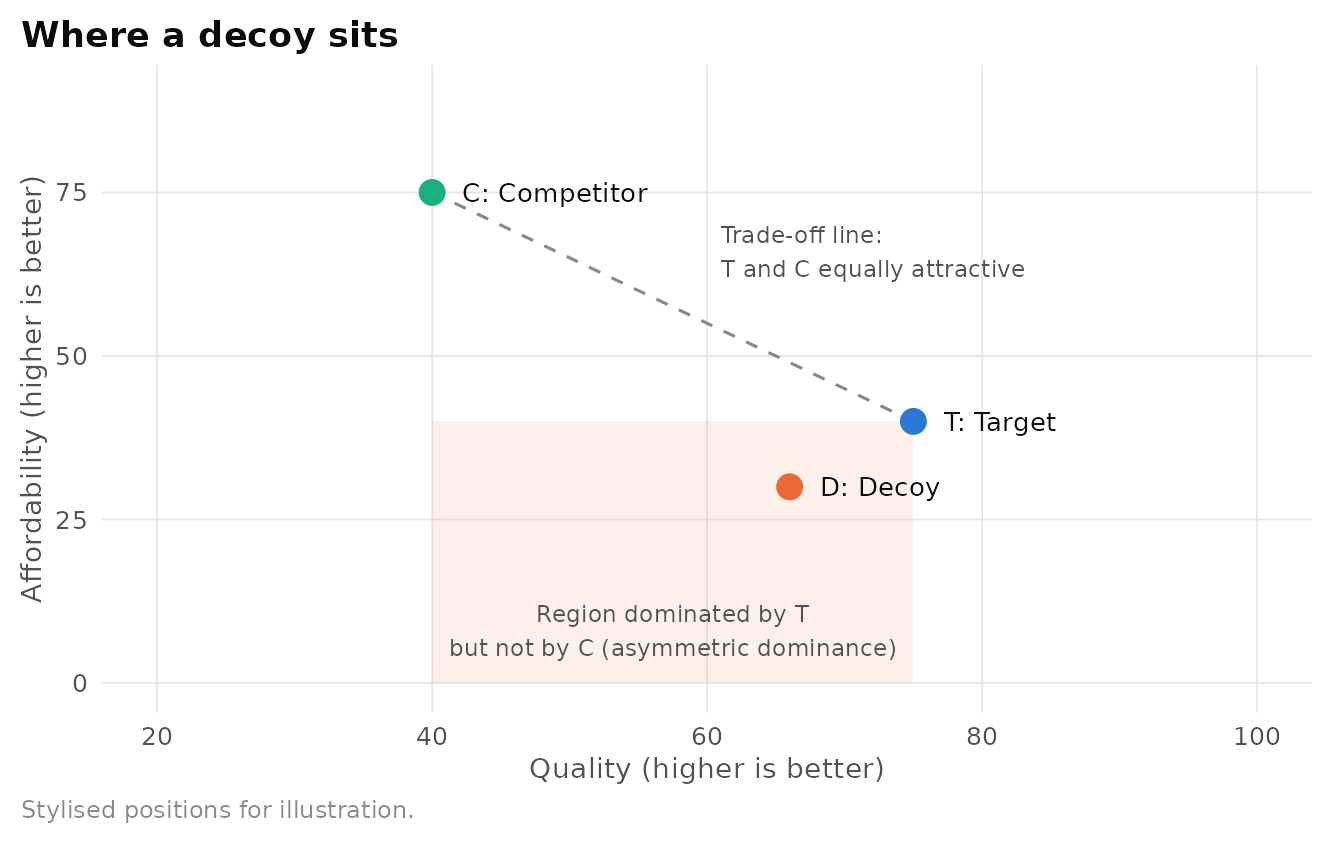
Figure 29.6: Stylised attribute space for the decoy effect. The decoy (D) is worse than the target (T) on both quality and affordability but is not dominated by the competitor (C). Its presence makes T look better by comparison. Positions are illustrative.
Several context effects are related. The compromise effect describes the tendency for an option to gain share when it becomes the intermediate option in a set, because extreme options are less attractive than moderate ones: an aspect of extremeness aversion (Simonson and Tversky 1992). Simonson (1989) proposed that both attraction and compromise effects reflect choice based on reasons: a dominated decoy gives the chooser an easy justification for the target (“it is clearly better than D”), and the effects are stronger when people expect to be evaluated on their choice. Table 29.6 summarises the main variants.
| Context effect | Position of the added option | Predicted shift | Proposed mechanism | Key source |
|---|---|---|---|---|
| Attraction (asymmetric dominance) | Dominated by the target only | Toward the target | Dominance provides a reason, relative advantage | Huber, Payne & Puto (1982) |
| Compromise | Makes the target the middle option | Toward the middle option | Extremeness aversion, ease of justification | Simonson (1989), Simonson & Tversky (1992) |
| Similarity (substitution) | Very similar to one existing option | Away from the similar option | New option draws share from close substitutes | Discussed in Huber, Payne & Puto (1982) |
How robust is the attraction effect? Frederick, Lee, and Baskin (2014) reported a series of studies in which the attraction effect was frequently absent when options were described perceptually or qualitatively, for example, with pictures rather than numeric tables, and in some studies the effect reversed. They argued that the effect is much narrower than the literature implied. Yang and Lynn (2014) likewise reported difficulty obtaining the effect with realistic stimuli. In reply, J. Huber, Payne, and Puto (2014) accepted that the effect has limits but argued that it is robust where its conditions are met: when decision makers recognise the dominance relation, when attributes are commensurable, and when the decoy is plausible rather than absurd. The exchange is a model of productive debate. It moved the field from asking whether the effect exists to asking when it occurs, and it cautions practitioners against assuming that a decoy that worked in a numeric laboratory task will work in a visually rich storefront.
Pricing tiers and decoys. Subscription and software pricing pages commonly present three or four plans. Some plans may exist primarily to shape choice among the others. Ariely (2008) popularised the example of a magazine subscription offer that included a print-only option priced the same as a combined print-and-web option. Few would choose print-only, but its presence made the combined offer look like a bargain, and removing it shifted choices toward the cheaper web-only option in his classroom demonstrations. Restaurants use a similar logic when an expensive wine on the menu makes the second-most-expensive bottle look reasonable, and cinemas when a medium popcorn is priced close to the large. The decoy literature suggests guidelines for practice: decoys work best when the comparison with the target is easy to see (shared attributes, numeric presentation, adjacent placement), when customers are comparing rather than choosing by gut feeling, and when the decoy is credible. It also suggests caution. Customers who recognise a decoy as manipulative may lose trust (see the persuasion knowledge model (Section 26.2)), and a decoy that customers actually choose is simply a poorly priced product.
Find a pricing page for a subscription service with at least three tiers. For each pair of tiers, ask whether one dominates the other on price and features. Is any tier asymmetrically dominated? Is any tier positioned as a compromise? Predict how choice shares would change if that tier were removed.
29.9 Anchoring Effect
Core claim. Numeric estimates are biased toward a value that was considered beforehand, the anchor, even when the anchor is obviously irrelevant.
Origins. Judgment and decision making, Tversky and Kahneman (1974), extended to valuation by Ariely, Loewenstein, and Prelec (2003), reviewed by Furnham and Boo (2011).
Level of analysis. Individual judgment, dyadic negotiation.
Key constructs. Anchor (externally provided or self-generated), adjustment, selective accessibility, plausibility of the anchor.
Boundary conditions. Robust across domains and expertise levels. Effects are larger when the target quantity is uncertain and the anchor is plausible, and can be reduced by generating reasons why the anchor is inappropriate.
Related theories. Heuristics and biases (Section 23.2), Framing (Section 26.6), Decoy effect, Prospect theory (Chapter 24).
29.9.1 Core logic and evidence
In the best-known demonstration, Tversky and Kahneman (1974) spun a wheel of fortune that was rigged to stop at either 10 or 65 in front of participants, who then estimated the percentage of African countries in the United Nations. The arbitrary number influenced the estimates: median estimates were 25 among participants who saw 10 and 45 among those who saw 65 (Figure 29.7). Tversky and Kahneman attributed the effect to insufficient adjustment: people start from the anchor and adjust toward a plausible value, but stop too soon.
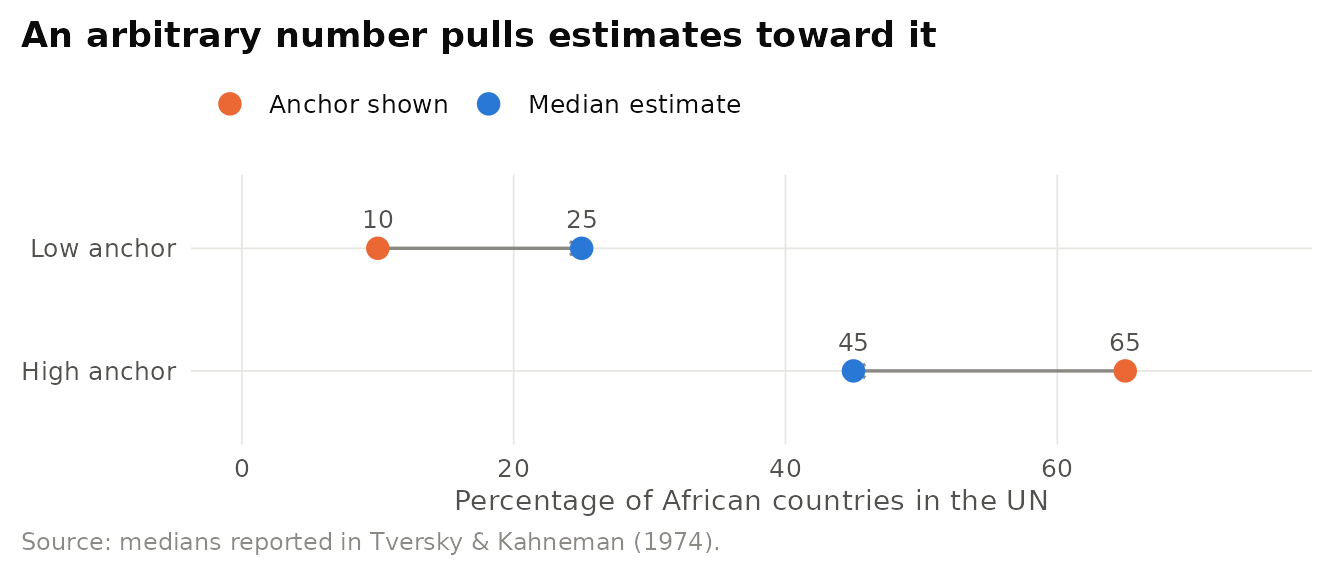
Figure 29.7: Anchoring with an arbitrary number. Median estimates of the percentage of African countries in the United Nations after participants saw a wheel of fortune stop at 10 or 65, as reported by Tversky & Kahneman (1974).
Anchoring extends to valuation. Ariely, Loewenstein, and Prelec (2003) asked participants to write down the last two digits of their social security number and to state whether they would pay that amount, in dollars, for various products such as wine and computer accessories. Participants then stated their maximum willingness to pay. Valuations were strongly correlated with the arbitrary digits. Yet the relative valuations of different products were sensible: participants valued items that should be worth more at higher prices. The authors described this pattern as coherent arbitrariness: preferences are internally consistent but anchored to arbitrary starting points.
Expertise does not eliminate anchoring. Northcraft and Neale (1987) gave real estate agents and amateurs identical information about a house, varying only the listing price. Both groups’ appraisals were influenced by the listing price, and the agents tended to deny that it had influenced them. In negotiations, first offers act as anchors: Galinsky and Mussweiler (2001) found that the party making the first offer tended to obtain better outcomes, and that the effect was reduced when the recipient focused on information inconsistent with the anchor, such as the offerer’s alternatives.
29.9.2 Mechanism
Two mechanisms have been proposed, and they appear to apply to different kinds of anchors. The adjustment account fits self-generated anchors: values people produce themselves as starting points, such as the known boiling point of water when estimating it at altitude. Epley and Gilovich (2006) found that people adjust from such anchors until they reach a plausible value and then stop, producing estimates biased toward the anchor. The selective accessibility account fits externally provided anchors. Strack and Mussweiler (1997) argued that considering whether the target quantity is higher or lower than the anchor makes anchor-consistent information more accessible, and that this information then shapes the final estimate. Anchoring is also among the most replicable effects in psychology: it replicated robustly in the multi-laboratory Many Labs project (R. A. Klein et al. 2014) (Table 29.7).
| Paradigm | Anchor type | Typical finding | Business setting | Source |
|---|---|---|---|---|
| Wheel of fortune | Arbitrary, externally provided | Estimates move toward the random number | Survey and forecasting design | Tversky & Kahneman (1974) |
| Social security digits | Arbitrary, self-relevant | Willingness to pay tracks the digits (coherent arbitrariness) | Reference prices, price recommendations | Ariely, Loewenstein & Prelec (2003) |
| Listing price | Informative but biased | Expert appraisals follow the listing price | Real estate, procurement | Northcraft & Neale (1987) |
| First offer | Strategic, from counterpart | First mover obtains better outcomes | Negotiation, salary setting | Galinsky & Mussweiler (2001) |
| Self-generated | Known value adjusted from | Adjustment stops too early | Budgeting from last year’s figures | Epley & Gilovich (2006) |
Reference prices and negotiation. Retailers display “was” prices, manufacturers publish suggested retail prices, and software firms list an annual price beside a discounted monthly equivalent. Each provides an anchor against which the actual price is judged. Regulators in many jurisdictions restrict fictitious reference prices precisely because anchors influence perceived value. In business-to-business negotiation, the anchoring literature recommends that well-prepared parties consider making the first offer, and that recipients of an aggressive first offer counter its influence by focusing on their own alternatives and target rather than on the counterpart’s number (Galinsky and Mussweiler 2001). Inside organisations, last year’s budget is a self-generated anchor. Zero-based budgeting is, in part, an attempt to remove it.
Treating every reference point as an anchor. A displayed price can affect judgments because it is an anchor, because it is informative (a high list price may truthfully signal quality), or because it changes the reference point against which gains and losses are evaluated (Prospect theory (Chapter 24)). Demonstrating anchoring requires showing that an uninformative or randomly assigned number shifts judgments.
29.10 Beauty in Averageness
Core claim. Stimuli that are close to the average or prototype of their category , faces, designs, musical performances, tend to be judged attractive.
Origins. Perception and evolutionary psychology, Langlois and Roggman (1990), extended to non-face categories by Halberstadt and Rhodes (2003) and to products by Veryzer, Jr. and Hutchinson (1998) and Landwehr, Labroo, and Herrmann (2011).
Level of analysis. Individual perceiver.
Key constructs. Averageness, prototypicality (typicality), symmetry, processing fluency, aesthetic preference.
Boundary conditions. Averageness is attractive but not maximally attractive: some non-average features can be preferred, and in some categories distinctiveness adds value. The effect is weaker when typicality is confounded with boredom.
Related theories. Goldilocks effect, Processing fluency (Section 23.8), Mere exposure, Wisdom of the crowd (Section 30.5).
29.10.1 Core logic and evidence
Langlois and Roggman (1990) created composite faces by digitally averaging photographs of individuals. Composite faces were judged more attractive than most of the individual faces from which they were created, and attractiveness tended to increase as more faces were included in the composite (see also Strzalko and Kaszycka (1992) on how attractiveness assessments vary within and between raters). The pattern is not specific to faces. Halberstadt and Rhodes (2003) found that computer-averaged images of birds, fish, and automobiles were also judged attractive. In music, Repp (1997) found that a performance constructed by averaging the expressive timing and dynamics of many pianists’ performances was judged aesthetically pleasing: in some respects more so than most individual performances. In experimental aesthetics, Martindale and colleagues found that typicality was a strong predictor of preference for many kinds of stimuli (Martindale, Moore, and West 1988, Martindale, Moore, and Borkum 1990).
The effect has clear business relevance. Veryzer, Jr. and Hutchinson (1998) found that prototypicality and unity increased aesthetic responses to new product designs. Landwehr, Labroo, and Herrmann (2011) showed that a measure of design fluency, capturing how typical and how complex a car’s design was, improved forecasts of automobile sales beyond conventional predictors, suggesting that the ease with which consumers process a design is commercially consequential.
29.10.2 Explanations
Three families of explanation have been proposed, summarised in Table 29.8.
| Explanation | Core argument | Key sources | Prediction that distinguishes it |
|---|---|---|---|
| Evolutionary (good genes) | Average and symmetric faces signal developmental stability and genetic diversity | Thornhill & Gangestad (1993), Grammer & Thornhill (1994), Langlois & Roggman (1990), Rhodes (2006) | Effect should be strongest for faces and mates |
| Processing fluency | Prototypes are easy to process, and ease is experienced as pleasure | Winkielman et al. (2006), Reber (2011), Reber, Schwarz & Winkielman (2004), Landwehr et al. (2011) | Effect should extend to any category with a prototype, including novel ones |
| Wisdom of crowds (error cancellation) | Averaging cancels idiosyncratic deviations, moving the result closer to an optimum | Surowiecki (2005), Halberstadt & Rhodes (2003), Repp (1997) | Averages of skilled performances should beat most individuals |
The evolutionary account holds that averageness and symmetry in faces are cues to health and genetic quality, so preferences for them would have been favoured by selection (Thornhill and Gangestad 1993, Grammer and Thornhill 1994, Rhodes 2006). The fluency account holds that prototypes are processed easily, and that the resulting fluency is experienced as positive affect. Winkielman et al. (2006) found that prototypical patterns were classified faster and liked more, consistent with fluency, and Reber (2011) develops the argument that fluency underlies culturally shared taste. Because the fluency account predicts the effect for any category with a prototype, including categories with no evolutionary significance, such as cars or dot patterns, findings such as those of Halberstadt and Rhodes (2003) are often read as favouring it. The wisdom-of-crowds account draws on the statistical point that averaging independent estimates cancels their errors (Surowiecki 2005): an averaged face or performance smooths out idiosyncratic deviations, moving the result toward an optimum (Halberstadt and Rhodes 2003, Repp 1997).
Typicality in product design. The beauty-in-averageness effect explains why many successful designs look “right” at first sight: they are close to the category prototype. It also explains a frequent tension between designers, who value originality, and market research, which often favours familiar forms. The Goldilocks effect and the “most advanced, yet acceptable” principle suggest a resolution: keep the overall form typical, the silhouette of a car, the layout of a website, the shape of a bottle, and innovate in details that distinguish the brand. Landwehr, Labroo, and Herrmann (2011)’s results suggest that design properties such as typicality and complexity can be measured during development and used to forecast sales, allowing firms to treat design not purely as a matter of taste but as a measurable predictor of market performance.
29.11 Pratfall Effect
Core claim. A minor blunder can make a highly competent person more likeable, whereas the same blunder makes a person of average competence less likeable.
Origins. Social psychology, Aronson, Willerman, and Floyd (1966), qualified by R. Helmreich, Aronson, and LeFan (1970).
Level of analysis. Individual perceiver evaluating a target person (and, by extension, a brand).
Key constructs. Competence, blunder (pratfall), likeability, perceiver self-esteem, blemishing.
Boundary conditions. Requires that the target’s competence already be established and that the blunder be minor and unrelated to core competence. Effects depend on characteristics of the perceiver.
Related theories. Persuasion knowledge model (Section 26.2), Social comparison theory (Section 22.1), Signaling theory (Section 8.2).
Aronson, Willerman, and Floyd (1966) had participants listen to a tape recording of a student who was supposedly trying out for a college quiz team. In one version, the candidate answered almost all questions correctly and described an impressive record. In another, he performed at an average level. In half of the recordings, the candidate clumsily spilled coffee over himself near the end. The blunder increased the attractiveness of the superior candidate and decreased the attractiveness of the average candidate. The interpretation was that a minor flaw makes a highly competent person seem more human and approachable, whereas for a person of average ability it simply adds to an impression of mediocrity.
The effect is less general than its popularity suggests. R. Helmreich, Aronson, and LeFan (1970) found that the effect of a pratfall depended on the self-esteem of the observer, so that the blundering superior person was not uniformly preferred. Related research in consumer behaviour points to a broader principle. Ein-Gar, Shiv, and Tormala (2012) documented a blemishing effect: adding a small piece of negative information to an otherwise positive description of a product can increase evaluations, especially when people process information with little effort, because the weak negative information makes the positive information stand out by contrast.
Brand candour and leader communication. Brands sometimes admit a minor weakness to make their strengths more credible. Avis’s long-running campaign built around being “No. 2” in car rentals, created by the agency Doyle Dane Bernbach in the 1960s, is a widely cited example of turning an admitted limitation into a reason to believe the brand’s promise to “try harder”. In product reviews, research on blemishing suggests that a mostly positive review profile with a few mild criticisms can be more persuasive than uniformly glowing reviews. For leaders, the pratfall effect suggests that acknowledging a minor error can increase warmth, but only when competence is already established and the error does not touch the core of the role. A chief financial officer who misspeaks a statistic in a speech may seem human. One who misstates earnings does not.
29.12 Using Named Effects Responsibly
Named effects are attractive because they are memorable, specific, and easy to apply. The same features make them easy to misuse. Three cautions follow from the evidence reviewed in this chapter.
First, effects vary in robustness. Anchoring replicated robustly across many laboratories (R. A. Klein et al. 2014), and mere exposure rests on a large meta-analytic base (Bornstein 1989, Montoya et al. 2017). By contrast, the attraction effect is sensitive to how options are presented (Frederick, Lee, and Baskin 2014), the glass cliff depends on context (Morgenroth et al. 2020), and the pratfall effect depends on the observer (R. Helmreich, Aronson, and LeFan 1970). The catalogue at the start of this chapter rates evidence strength for this reason. See the discussion of the replication crisis (Section 3.7) for general principles.
Second, effects need mechanisms. An effect tells us that something happens. A mechanism tells us when it will happen. The mere exposure effect is useful to a media planner only together with the two-factor account that predicts wear-out. The decoy effect is useful to a pricing manager only with the boundary conditions that determine whether customers will notice dominance. Linking each effect to a theory , fluency, prospect theory, signaling, social identity, is what turns a list of curiosities into a toolkit.
Third, effects interact and sometimes conflict. Familiarity breeds liking (mere exposure), but too much familiarity breeds boredom (Goldilocks, Coolidge). Typical designs are attractive (beauty in averageness), but distinctiveness signals status (snob effect). The resolution is rarely to choose one effect over another. It is to specify the conditions, the stage of exposure, the consumer segment, the observability of consumption, under which each dominates.
29.13 Chapter Summary
- A named effect is an empirical regularity. Its value depends on the mechanism that explains it and the boundary conditions that limit it.
- Mere exposure increases liking, but repetition eventually produces tedium. The two-factor curve underlies wear-in and wear-out in advertising (Zajonc 1968, Bornstein 1989, Cacioppo and Petty 1979).
- The warm-glow heuristic runs the other way, liking increases perceived familiarity (Monin 2003), and must not be confused with Andreoni’s warm-glow giving (Andreoni 1990).
- Goldilocks (inverted-U) patterns describe preference for moderate novelty and complexity (Berlyne 1970, R. B. McCall and McGhee 1977, Kidd, Piantadosi, and Aslin 2012), while beauty in averageness shows that typical stimuli are attractive (Langlois and Roggman 1990). The two are reconciled by treating typicality and novelty as separate dimensions (Hekkert, Snelders, and Wieringen 2003).
- Bandwagon, snob, and Veblen effects make demand depend on others’ consumption and on price itself (Leibenstein 1950), with opposite implications for scarcity and mass-market strategies.
- The glass cliff describes the disproportionate appointment of women and minorities to precarious leadership roles (M. K. Ryan and Haslam 2005, M. K. Ryan et al. 2016, A. Cook and Glass 2014).
- The IKEA effect, decoy effect, anchoring, and pratfall effect offer practical levers for product design, pricing, negotiation, and communication: each with documented limits (Norton, Mochon, and Ariely 2012, J. Huber, Payne, and Puto 1982, Frederick, Lee, and Baskin 2014, Tversky and Kahneman 1974, Aronson, Willerman, and Floyd 1966).
Table 29.9 presents the comparison of the chapter’s effects.
| Effect | Primary mechanism | Key moderator | Main business lever | Main risk of misuse |
|---|---|---|---|---|
| Mere exposure | Fluency, habituation vs. tedium | Number of exposures, complexity | Frequency planning | Ignoring wear-out |
| Warm-glow heuristic | Misattribution of affect to familiarity | Diagnosticity of memory | Awareness measurement | Confusing with warm-glow giving |
| Goldilocks | Optimal arousal, schema discrepancy | Expertise, prior exposure | Calibrating novelty | Assuming one peak for all segments |
| Coolidge | Satiation and recovery with novelty | Species, domain | Variety in product lines | Over-extending an animal finding |
| Bandwagon / snob / Veblen | Social and price externalities in demand | Observability of consumption | Scarcity vs. mass adoption | Confusing Veblen with price-quality inference |
| Glass cliff | Crisis stereotypes, signalling change | Leadership history, performance measure | Succession governance | Over-generalising across contexts |
| IKEA effect | Competence, effort justification, ownership | Task completion | Co-creation and self-assembly | Creator’s overvaluation |
| Decoy | Reasons for choice, relative advantage | Numeric vs. perceptual presentation | Pricing tiers | Assuming lab robustness in the field |
| Anchoring | Adjustment, selective accessibility | Uncertainty, anchor plausibility | Reference prices, first offers | Confusing anchors with information |
| Beauty in averageness | Fluency, evolutionary cues, error cancellation | Category, distinctiveness value | Typical design forms | Ignoring the value of distinctiveness |
| Pratfall | Humanising a competent target | Established competence, observer | Brand candour | Generalising from a single study |
29.14 Discussion Questions
- The mere exposure effect and the Goldilocks effect make apparently opposite predictions about the effect of familiarity. Specify the conditions under which each should dominate, and design an advertising experiment to test them.
- A brand-tracking survey shows that a brand’s familiarity and favourability have both risen. Using the warm-glow heuristic and mere exposure, explain why the causal direction is ambiguous. How would you design a study to separate the two?
- A luxury fashion brand is considering launching a lower-priced line. Use Leibenstein’s framework to predict the effects on existing and new customers. What evidence would tell you whether the snob or the Veblen effect is more important for this brand?
- Archival and experimental studies of the glass cliff do not always agree. What are the strengths and weaknesses of each design, and what data would provide the most convincing test?
- Following the 2014 debate about the attraction effect, what conditions would you check before recommending a decoy pricing tier to a client? How would you test the recommendation in the field?
- Choose two effects from this chapter that could be explained by processing fluency. Explain how fluency accounts for each, and identify one finding that a fluency account cannot easily explain.
29.15 Further Reading
- Zajonc (1968): the original monograph on mere exposure, combining correlational and experimental evidence.
- Bornstein (1989): the classic meta-analysis that identifies the moderators of the exposure effect.
- Leibenstein (1950): a short, clear treatment of bandwagon, snob, and Veblen effects that remains the starting point for social effects in demand.
- M. K. Ryan et al. (2016): a review of a decade of glass cliff research, its explanations, and its impact.
- Norton, Mochon, and Ariely (2012): the experiments that named the IKEA effect and identified completion as a boundary condition.
- Frederick, Lee, and Baskin (2014): a careful challenge to the robustness of the attraction effect, best read together with J. Huber, Payne, and Puto (2014).
- Ariely, Loewenstein, and Prelec (2003): an elegant demonstration that preferences can be coherent yet arbitrary.
- Langlois and Roggman (1990): the composite-face studies that launched research on beauty in averageness.