11 Strategy, Competition, and Industries
Why do pharmaceutical companies and soft-drink makers earn persistently higher returns than airlines and steel producers? Why did U.S. airlines that met each other on many routes charge higher fares than airlines that met only occasionally, and why did the rest of the U.S. wireless industry follow when T-Mobile abandoned two-year service contracts in 2013? Why do some pioneers, such as eBay in online auctions, keep their lead for decades while others, such as Friendster and MySpace in social networking, are overtaken by later entrants? And why do managers invest in small pilot projects that, judged one at a time, fail the standard net-present-value test?
Each question concerns competitive strategy: how firms position themselves within industries, anticipate rivals, and decide when and how much to commit. We begin with the industrial-organization tradition, the structure-conduct-performance paradigm and the theory of strategic groups. We then examine rivalry through the empirical lens of competitive dynamics and the formal lens of game theory. Two theories address the timing and staging of commitments: first-mover advantage and real options theory. The chapter closes with two behavioural theories of the firm’s decision process, the behavioral theory of the firm and the attention-based view. Together they span the classic tension in strategy between models of rational rivals and models of boundedly rational organizations (Table 11.1).
| Theory | Core question | Level of analysis | Key source |
|---|---|---|---|
| Structure-conduct-performance | Why do some industries earn higher profits than others? | Industry | Mason (1939), Bain (1956) |
| Strategic groups | Why do clusters of firms within one industry follow similar strategies and earn different returns? | Group within industry | Caves & Porter (1977) |
| Competitive dynamics | Who attacks whom, and who responds, how fast, and how strongly? | Firm dyad | Chen (1996) |
| Game theory | What should a firm do when its payoff depends on what rivals do? | Interacting firms | von Neumann & Morgenstern (1944), Nash (1950) |
| First-mover advantage | When does entering a market first pay off? | Firm within market | Lieberman & Montgomery (1988) |
| Real options theory | How should firms invest when the future is uncertain and investments are irreversible? | Investment project, firm | Myers (1977), Bowman & Hurry (1993) |
| Behavioral theory of the firm | How do performance relative to aspirations, search, and slack shape organizational decisions? | Organization | Cyert & March (1963) |
| Attention-based view | How does the allocation of managerial attention shape what firms do? | Organization, decision maker | Ocasio (1997) |
11.1 Structure-Conduct-Performance
Core claim. The structure of an industry (concentration, barriers to entry, product differentiation) shapes the conduct of the firms within it (pricing, advertising, investment), and conduct determines industry performance (profitability and efficiency). Industry is the primary unit for explaining why profits differ.
Origins. Industrial organization economics. Edward Mason’s Harvard program of industry studies (E. S. Mason 1939) and Joe Bain’s work on concentration and entry barriers (Bain 1951, 1956). Brought into strategic management by Michael E. Porter (1980b) and Michael E. Porter (1981).
Level of analysis. Industry (market), with firms treated as largely similar within it.
Key constructs. Seller concentration, barriers to entry (economies of scale, product differentiation, absolute cost advantages, capital requirements), the condition of entry, conduct, industry profitability.
Boundary conditions. Industry boundaries must be definable. Structure must be relatively stable and exogenous to any single firm’s conduct. The theory is weakest when firm-level efficiency differences are large or when industries are reshaped quickly by technology.
Related theories. Five forces (Section 31.4), Strategic groups, Resource-based theory (Section 4.1), Organizational ecology (Section 7.5).
11.1.1 Origins and intellectual history
The structure-conduct-performance (SCP) paradigm grew out of the Harvard industrial organization program of the 1930s. E. S. Mason (1939) argued that the policies of large firms could not be understood through perfect competition alone and called for industry-by-industry study of how market structure conditions business behaviour. Joe Bain, trained in the same Harvard tradition, turned the program into a testable agenda: in U.S. manufacturing of the late 1930s, profit rates were higher in the most concentrated industries (Bain 1951).
Concentration alone, however, cannot sustain high profits if outsiders can enter freely. Bain (1956) therefore introduced the concept of the condition of entry: the extent to which established firms can raise prices above the competitive level without attracting new entrants. He identified the structural sources of barriers to entry, which Table 11.2 summarises alongside later additions. The welfare logic of the paradigm was clear: high barriers and high concentration enable collusive or tacitly coordinated conduct, which produces high profits at the expense of consumers. SCP research therefore became the intellectual foundation of mid-century antitrust policy.
| Barrier | Why it deters entry | Business example |
|---|---|---|
| Economies of scale | An entrant must either enter at large scale (and depress prices) or accept a cost disadvantage | Commercial aircraft manufacturing, semiconductor fabrication |
| Product differentiation | Buyers prefer established brands, so entrants must spend more on advertising or accept lower prices | Carbonated soft drinks, cigarettes, breakfast cereals |
| Absolute cost advantages | Incumbents control superior inputs, technology, or locations at any scale | Patented drugs, scarce airport slots, mineral deposits |
| Capital requirements | Large up-front investment raises financing costs and risk for entrants | Wireless spectrum and networks, steel mills |
| Switching costs (later addition) | Buyers incur costs to change suppliers, locking in installed bases | Enterprise software, banking relationships |
| Network effects (later addition) | The value of joining rises with the number of existing users | Payment networks, marketplaces, social platforms |
11.1.2 Core logic and propositions
The paradigm runs from structure to conduct to performance, with basic conditions of supply and demand (technology, demand elasticity, growth) at the start of the chain. Figure 11.1 shows the logic, including the feedback loops that later critics emphasised.
Figure 11.1: The structure-conduct-performance paradigm. Basic conditions shape market structure, which shapes firm conduct and, in turn, industry performance. Dashed arrows show the feedback effects (conduct reshaping structure, and performance attracting entry) stressed by later work.
The paradigm can be stated as four propositions:
- P1 (Concentration). Industries with higher seller concentration earn higher average profits, because fewer sellers find it easier to coordinate, tacitly or explicitly (Bain 1951).
- P2 (Entry barriers). High concentration translates into persistent profits only when barriers to entry are high (Bain 1956).
- P3 (Industry primacy). Because structure constrains conduct, industry membership explains a substantial share of the variance in firm profitability.
- P4 (Strategic inversion). For a firm, the attractive course is to enter industries with favourable structure or to reshape structure in its favour, the inversion of the paradigm’s welfare logic that Michael E. Porter (1981) made the basis of competitive strategy.
That inversion is the paradigm’s most consequential legacy for business. Where the antitrust economist saw high barriers as a social cost, Michael E. Porter (1980b) saw them as a source of protected returns, and organized industry analysis into the five forces (Section 31.4) framework: rivalry, threat of entry, threat of substitutes, and the bargaining power of buyers and suppliers (Michael E. Porter 1979).
11.1.3 Evidence and extensions
The SCP paradigm met two major challenges. The first came from the Chicago school. Demsetz (1973) argued that the correlation between concentration and profits might reflect efficiency rather than collusion: if a few firms are genuinely better, they will grow large, the industry will become concentrated, and their superior profits will raise the industry average. Market power predicts that all firms in a concentrated industry gain. Efficiency predicts that mainly the large, efficient firms do. Demsetz reported evidence more consistent with the second view, opening a debate about whether profits reflect market power or superior capability that continues in resource-based theory (Section 4.1).
The second challenge came from variance decomposition. If structure drives profitability, industry membership should explain much of the variation in business-unit returns. Schmalensee (1985), using a single year of U.S. Federal Trade Commission line-of-business data, found that industry effects accounted for about a fifth of that variance, whereas corporate and market share effects were negligible or small. Rumelt (1991) used several years of the same data, which allowed him to separate stable business-unit effects from industry effects. Business-unit effects were several times larger than stable industry effects, a result widely read as evidence that firm-specific resources and strategies matter more than industry. McGahan and Porter (1997) and Hawawini, Subramanian, and Verdin (2003) qualified the conclusion, as Table 11.3 summarises, and Figure 11.2 stylises the contrast between the two research designs.
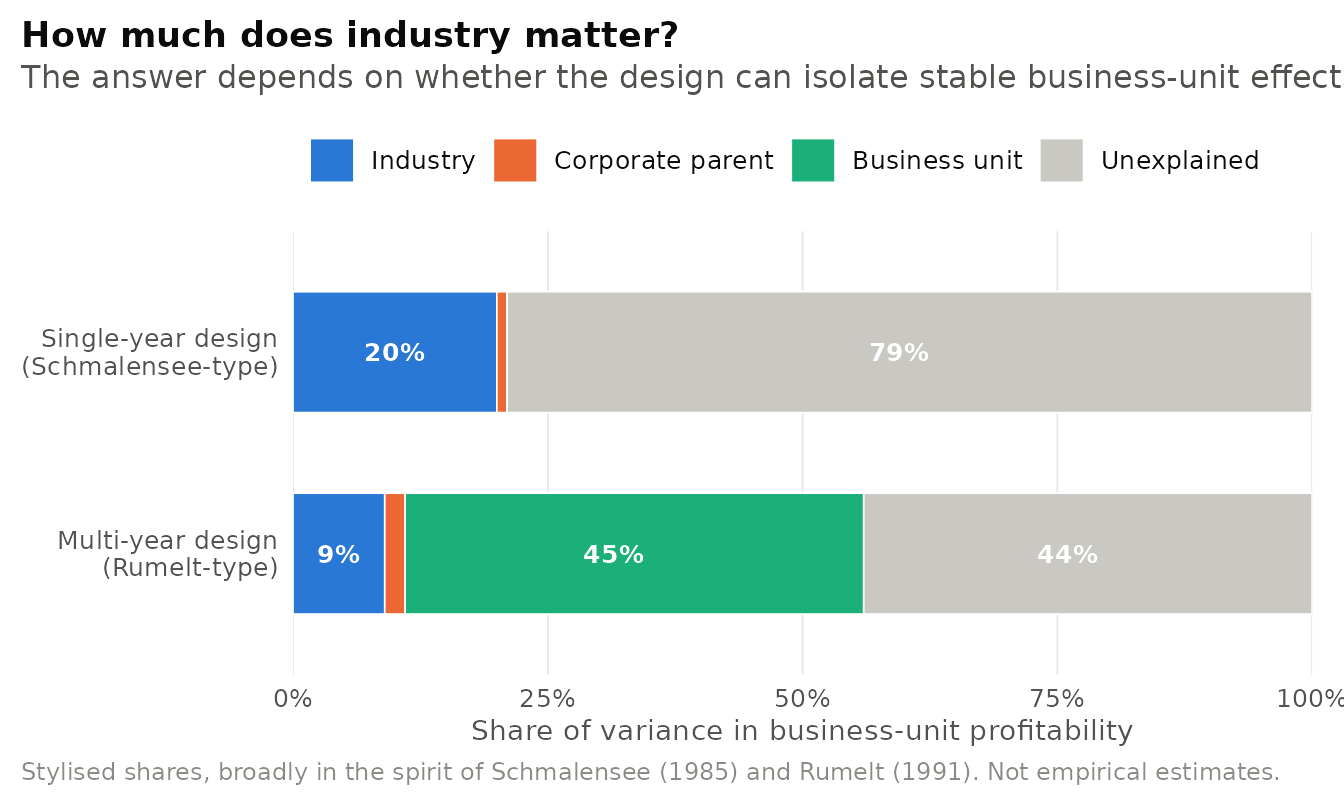
Figure 11.2: Stylised variance decomposition of business-unit profitability. A single-year design cannot separate business-unit effects from noise, so industry appears to be the main systematic source of profit differences. A multi-year design isolates stable business-unit effects, which then dominate. Shares are illustrative and are not the published estimates of any one study.
| Study | Data | Headline finding | Interpretation |
|---|---|---|---|
| Schmalensee (1985) | FTC line-of-business data, single year | Industry effects explain about a fifth of the variance, corporate effects negligible | Supports the industry focus of SCP |
| Rumelt (1991) | FTC line-of-business data, several years | Stable business-unit effects are far larger than stable industry effects | Firm-specific strategy and resources matter most |
| McGahan & Porter (1997) | Compustat business segments, 1981-1994 | Industry about 19 percent, business-specific about 32 percent, corporate about 4 percent | Industry still matters, and its importance varies by sector |
| Hawawini, Subramanian & Verdin (2003) | Value-based performance measures such as economic profit | Firm effects dominate for leaders and laggards, industry effects matter more for average firms | The answer depends on where a firm sits in its industry |
Market power or efficiency? The SCP paradigm treats structure as exogenous, but efficient firms grow and make industries concentrated (Demsetz 1973). Variance-decomposition results depend on the sample, the performance measure, and whether stable and transient effects are separated (Rumelt 1991, McGahan and Porter 1997, Hawawini, Subramanian, and Verdin 2003). Moreover, decomposing variance says nothing about causal mechanisms: a large business-unit effect is a residual that could reflect resources, skill, luck, or a favourable niche. Most scholars now treat industry and firm effects as complementary explanations.
11.1.4 Applications in business
Why airlines struggle and soft drinks thrive. The U.S. airline industry is a classic case of unfavourable structure. Aircraft and airport access can be leased, so capital barriers are lower than they appear, fixed costs are high and marginal costs per seat are low, products are hard to differentiate, and buyers compare fares instantly. The industry’s long history of bankruptcies and consolidation is what SCP would predict. Carbonated soft drinks show the opposite configuration: strong brands built over a century, bottler networks, and shelf and fountain contracts create formidable barriers, and the industry is dominated by two firms. The same paradigm explains why airlines have pursued consolidation, loyalty programmes, and control of hub airports: each is an attempt to change structure rather than merely to compete within it.
11.1.5 Using the theory in research
Sample hypotheses.
- H1. Industry concentration will be positively associated with price-cost margins, and the association will be stronger when entry barriers (measured by minimum efficient scale relative to market size) are high.
- H2. The share of variance in business-unit returns explained by industry effects will be larger in regulated and capital-intensive industries than in fragmented service industries.
Measures. Concentration ratios (CR4, CR8) and the Herfindahl-Hirschman Index, minimum efficient scale, advertising and R&D intensity, price-cost margins, return on assets, Tobin’s q.
Designs. Variance decomposition with random-effects or multilevel models (Compustat segments, census concentration data), and within-industry natural experiments such as deregulation, patent expiries, and entry shocks.
Treating industry definitions as given. Industry codes are administrative categories, not markets. A four-digit code may lump together firms that do not compete (luxury and economy hotels) and separate firms that do (streaming services and cable television). Concentration measured at the wrong boundary is meaningless. Define the relevant market by substitution patterns before computing structure, and test the sensitivity of results to alternative definitions.
11.2 Strategic Groups
Core claim. Within an industry, firms cluster into strategic groups that follow similar strategies along key dimensions. Groups are protected from one another by mobility barriers, which can sustain profit differences between groups within the same industry.
Origins. Industrial organization and strategic management. The term originated in doctoral research on the U.S. home-appliance industry in the early 1970s. The theory of mobility barriers was developed by Caves and Porter (1977) and Michael E. Porter (1980b). Empirical and cognitive extensions by K. O. Cool and Schendel (1987), Porac, Thomas, and Baden-Fuller (1989), and Reger and Huff (1993).
Level of analysis. Groups of firms within an industry.
Key constructs. Strategic dimensions (scope, resource commitments), strategic group, mobility barriers, within-group rivalry, between-group rivalry, cognitive groups.
Boundary conditions. Firms must differ systematically along a small number of costly-to-change strategic dimensions. If strategies are easy to imitate, groups dissolve and mobility barriers vanish.
Related theories. Structure-conduct-performance, Competitive dynamics, Resource-based theory (Section 4.1), Institutional theory (Section 7.2).
11.2.1 Origins and core logic
The SCP paradigm treated firms in an industry as similar, but in home appliances full-line national brands, private-label suppliers, and narrow specialists faced the same structure yet behaved and performed differently. Caves and Porter (1977) generalised Bain’s entry barriers into mobility barriers, which deter firms from moving between strategic groups as well as from entering the industry. A national brand, a dealer network, or a patent portfolio protects its owners from both outsiders and insiders in other groups. Because firms invest deliberately in such barriers, they are partly a product of strategy rather than a fixed feature of structure.
The theory yields four propositions:
- P1 (Clustering). Firms cluster along a few strategic dimensions, such as product scope, vertical integration, brand investment, and geographic reach.
- P2 (Mobility barriers). Moving between groups requires costly, slow, or uncertain investments, so membership persists (Caves and Porter 1977).
- P3 (Performance differences). Groups protected by higher mobility barriers earn higher returns.
- P4 (Rivalry structure). Rivalry is usually most intense within groups, and rivalry between groups depends on how much their markets overlap.
Figure 11.3 shows an illustrative strategic group map for a stylised airline industry.
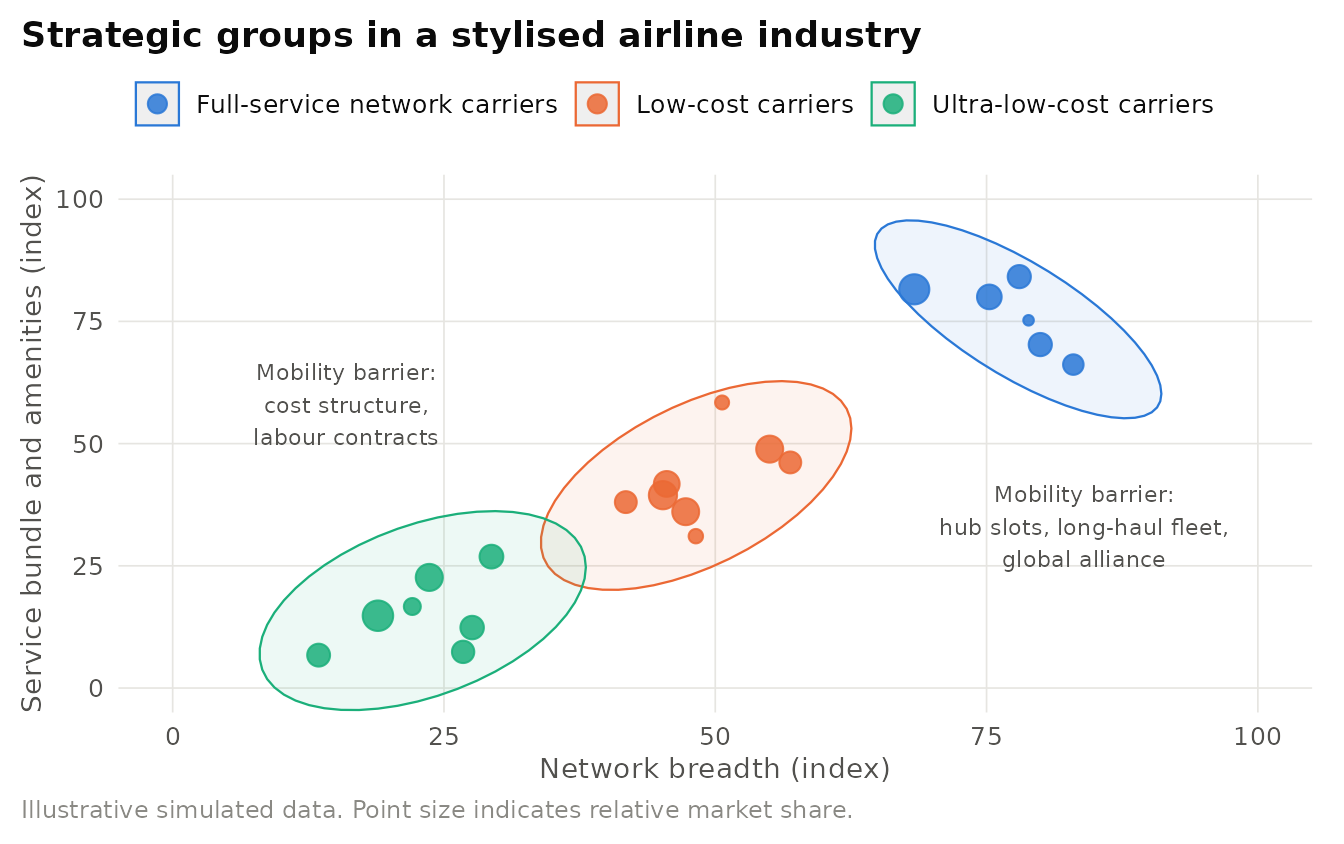
Figure 11.3: Illustrative strategic group map of a stylised airline industry. Firms cluster on network breadth and service bundle. Mobility barriers, such as hub slots and long-haul fleets, separate full-service network carriers from low-cost and ultra-low-cost carriers. Simulated data.
11.2.2 Evidence and extensions
Strategic groups are easy to find with cluster analysis but harder to validate. K. O. Cool and Schendel (1987) studied the U.S. pharmaceutical industry from 1963 to 1982, defining groups by scope and resource commitments and identifying periods of stable group structure. Their results, like much subsequent work, suggested that performance differences between groups were less systematic than the mobility-barrier argument implied, and they later examined performance differences within groups (K. Cool and Schendel 1988). J. B. Barney and Hoskisson (1990) argued that the literature rested on two untested assertions: that groups exist as more than statistical artefacts, and that performance depends on group membership.
A productive response came from the cognitive tradition. Porac, Thomas, and Baden-Fuller (1989) showed that Scottish knitwear manufacturers defined their rivals narrowly, as other high-end classic knitwear producers in their region, and largely ignored the mass-market producers who dominated global volume. Reger and Huff (1993) found that bank executives perceived consistent cognitive groupings of their rivals. Cognitive groups explain why firms watch some rivals closely and ignore others, linking the theory to the attention-based view.
Real structures or analyst constructs? Cluster algorithms will always produce clusters, so the existence of groups cannot be inferred from clustering alone (J. B. Barney and Hoskisson 1990). Critics also note that groups are defined on strategic choices and then used to explain performance, which invites circularity when the choices themselves respond to performance. Defenders reply that groups are useful when they are defined ex ante on theoretically motivated dimensions, validated against managers’ own perceptions (Reger and Huff 1993), and used to predict behaviour such as rivalry and response patterns rather than only profits.
11.2.3 Applications in business
Airline strategic groups. U.S. aviation offers a well-documented example of strategic groups. Legacy network carriers operate hub-and-spoke systems, long-haul international fleets, global alliances, and multi-class cabins. Low-cost carriers historically offered point-to-point service, a single aircraft type, and a simpler product, while ultra-low-cost carriers unbundle almost everything beyond the seat. Mobility barriers run in both directions: low-cost carriers cannot easily acquire congested hub slots or long-haul networks, and network carriers cannot easily replicate low-cost labour contracts and simplified operations. The network carriers’ introduction of “basic economy” fares in the 2010s can be read as an attempt to compete with the lower groups without crossing the mobility barrier.
11.2.4 Using the theory in research
Sample hypotheses.
- H1. Firms will respond more quickly to competitive moves by members of their own strategic group than to moves by firms in other groups.
- H2. The performance gap between strategic groups will be larger in industries where the investments that define groups are less reversible.
- H3. Managers’ cognitive groupings of rivals will predict competitive responses better than groupings derived from cluster analysis of financial data.
Measures. Strategic dimensions (product scope, advertising intensity, R&D intensity, vertical integration, geographic scope), mobility barrier proxies (sunk investments, regulatory licences), cognitive maps elicited from managers through repertory grids or rival-naming tasks.
Designs. Cluster analysis with ex ante dimensions and stability tests, multilevel models of performance (firm within group within industry), event studies of group entry and exit, and text analysis of annual reports to recover self-defined competitor sets.
11.3 Competitive Dynamics
Core claim. Competition is a sequence of actions and responses between specific rivals. Whether a firm attacks a rival, and whether and how a rival responds, depends on the pair’s market commonality and resource similarity, which shape each firm’s awareness, motivation, and capability to act. Firms that meet in many markets often compete less aggressively because of mutual forbearance.
Origins. Strategic management, building on Austrian economics and industrial organization. M.-J. Chen, Smith, and Grimm (1992), M.-J. Chen (1996), and the review by M.-J. Chen and Miller (2012). Multimarket contact and mutual forbearance: Karnani and Wernerfelt (1985), Bernheim and Whinston (1990), Gimeno and Woo (1996).
Level of analysis. The competitive dyad (a pair of rivals), and the actions and responses between them.
Key constructs. Competitive action and response, market commonality, resource similarity, competitor asymmetry, awareness, motivation, capability (AMC), multimarket contact, mutual forbearance, spheres of influence.
Boundary conditions. Rivals must be able to observe each other’s actions and to respond. The theory is most informative in industries with frequent, identifiable moves (price changes, product launches, route entries).
Related theories. Game theory, Strategic groups, Attention-based view, Resource-based theory (Section 4.1).
11.3.1 Origins and intellectual history
Classic industry analysis treats competition as a property of markets. Competitive dynamics research, which emerged in the late 1980s, treats it as a series of concrete moves (a price cut, a new route, a product launch) and the replies they provoke, often coded from trade publications on U.S. airlines. M.-J. Chen, Smith, and Grimm (1992) found that actions affecting many competitors drew more responses, whereas strategic actions (large, hard-to-reverse commitments) drew fewer and slower responses than tactical actions such as price changes. D. Miller and Chen (1994) linked past success to competitive inertia, a narrower and less changeable competitive repertoire.
11.3.2 Core logic and propositions
M.-J. Chen (1996) integrated this work into a theory of competitor analysis built on two dyad-level constructs. Market commonality is the degree to which a competitor is present in the markets that matter to the focal firm. Resource similarity is the extent to which a competitor’s strategic endowments resemble the focal firm’s in type and amount. Because each firm’s market portfolio differs, the two constructs are asymmetric: Firm A may be Firm B’s main rival while B is a minor concern for A. These constructs operate through three behavioural drivers, known as the awareness-motivation-capability (AMC) perspective (M.-J. Chen 1996, M.-J. Chen and Miller 2012). A firm attacks or responds only if it is aware of the rival or the move, motivated to act (because the stakes are high), and capable of acting (because it has the resources).
Figure 11.4 summarises the mechanism.
Figure 11.4: Competitive dynamics mechanism. Market commonality and resource similarity shape a firm’s awareness of, motivation toward, and capability against a rival. These drivers determine the likelihood of attack and the likelihood, speed, and strength of response. Multimarket contact can temper rivalry through mutual forbearance.
The central propositions are:
- P1 (Attack deterrence). A firm is less likely to attack a rival with high market commonality, because the rival is highly motivated to retaliate across the many markets they share (M.-J. Chen 1996).
- P2 (Response likelihood). A firm is more likely to respond to an attack by a rival with high market commonality, because the attack threatens markets that matter to it.
- P3 (Capability). Resource similarity raises the rival’s capability to respond in kind, which makes attack less attractive and response more feasible.
- P4 (Action characteristics). Responses are more likely and faster for visible, easily reversed, tactical actions than for complex, irreversible, strategic actions (M.-J. Chen, Smith, and Grimm 1992).
- P5 (Mutual forbearance). Firms that meet in many markets compete less aggressively in each, because aggression in one market invites retaliation in others (Karnani and Wernerfelt 1985, Bernheim and Whinston 1990).
Table 11.4 translates the constructs into measures.
| Construct | Definition | Typical measure |
|---|---|---|
| Market commonality | Overlap of a rival in markets that matter to the focal firm, weighted by importance | Share of focal firm’s revenue earned in markets where the rival is present |
| Resource similarity | Comparability of strategic endowments in type and amount | Distance in resource profiles (fleet, assets, capabilities) |
| Awareness | Degree to which a firm notices a rival or its move | Visibility of the action, analyst or media coverage, managerial mentions |
| Motivation | Perceived stakes of acting or responding | Revenue at risk in the attacked market |
| Capability | Resources available to act or respond | Slack, scale, product breadth |
| Multimarket contact | Number of markets in which two firms meet | Count or share of overlapping routes, regions, or product markets |
| Response | A counter-move aimed at the attacker | Coded from trade press, response lag in days, number of responders |
11.3.3 Evidence and extensions
The theory has strong empirical support in industries where moves can be observed. In airlines, W. N. Evans and Kessides (1994) found that fares were higher on routes served by carriers that met each other in many other markets, consistent with mutual forbearance. Gimeno (1999) showed that airlines with dominant positions in each other’s hubs tended to respect one another’s spheres of influence, and Gimeno and Woo (1996) found that multimarket contact de-escalated rivalry, whereas strategic similarity intensified it. Baum and Korn (1996) showed that market domain overlap and multimarket contact jointly shaped entry and exit among California commuter airlines. The formal foundation came from Bernheim and Whinston (1990), who showed that multimarket contact helps sustain collusion by pooling incentive constraints across markets: when markets or firms differ, slack in one market’s incentive to cooperate can be transferred to another. When all markets and firms are identical, multimarket contact adds nothing. That result is an important boundary condition.
Forbearance or collusion? Mutual forbearance raises a normative question that matters for merger review: is it efficient coexistence or tacit collusion that harms customers? Measurement is also contested, because actions coded from trade publications over-represent visible, newsworthy moves. Finally, the dyadic focus can neglect the wider network of rivals, who also observe every response (M.-J. Chen and Miller 2012).
11.3.4 Applications in business
Fare wars and spheres of influence in airlines. Airline competition offers a textbook record of action and response. In the spring of 1992, American Airlines introduced a simplified “Value Pricing” fare structure. Rivals answered with promotions of their own, and by the summer the industry was locked in a broad fare war that deepened losses across the sector. The episode illustrates P2 and P4: fare changes are visible, easy to reverse, and threaten rivals in many shared markets, so responses come quickly. By contrast, carriers have generally avoided head-on attacks on each other’s fortress hubs, consistent with the spheres of influence documented by Gimeno (1999).
The Un-carrier and wireless rivalry. In 2013, T-Mobile US, then the fourth-largest U.S. wireless carrier, launched its “Un-carrier” strategy, beginning with the elimination of two-year service contracts and continuing with a sequence of publicly announced moves on pricing and plan features. The AMC perspective explains both the attack and the responses. As the smallest national carrier, T-Mobile had little to lose from disrupting industry pricing norms. Its moves were highly visible and threatened larger rivals’ core subscriber bases, and those rivals also moved away from traditional contracts over the following years. Verizon reintroduced an unlimited data plan in early 2017.
11.3.5 Using the theory in research
Sample hypotheses.
- H1. The likelihood that a firm responds to a rival’s price cut will increase with the rival’s market commonality with the focal firm.
- H2. Multimarket contact between two firms will be negatively associated with the frequency of price cuts in their shared markets, and the association will be stronger when the firms differ in market positions (asymmetric spheres of influence).
Measures. Structured content analysis of trade press for actions and responses, response lag, number of responders, market commonality and resource similarity indices, multimarket contact counts at the dyad level.
Designs. Dyad-level panel models, hazard models of response timing, and natural experiments from mergers that change multimarket overlap, using sources such as airline route and fare data, wireless plan histories, and retail price scrapes.
Ignoring asymmetry. A frequent error is to treat rivalry as symmetric, for example by computing a single overlap measure for a pair of firms. Market commonality and resource similarity are directional: what matters for the focal firm’s behaviour is how much of its business the rival touches, not the reverse. Use directed dyads and test whether predictions hold separately for each direction.
11.4 Game Theory
Core claim. When the payoff of each actor depends on the choices of others, rational strategy requires anticipating rivals’ responses. Outcomes can be predicted as equilibria, combinations of strategies from which no player gains by deviating unilaterally.
Origins. Mathematics and economics. Neumann and Morgenstern (1944) founded the field. J. F. Nash (1950) and J. Nash (1951) defined the equilibrium concept that bears his name. Applications to business strategy include Schelling (1960) on commitment, A. Dixit (1980) on entry deterrence, Tirole (1988) on industrial organization, and Brandenburger and Nalebuff (1996) on co-opetition.
Level of analysis. Interacting decision makers: firms in an oligopoly, negotiating parties, platform and complementors.
Key constructs. Players, strategies, payoffs, information, Nash equilibrium, dominant strategy, prisoner’s dilemma, Cournot and Bertrand competition, sequential moves, commitment, credibility, repeated games, reputation, added value.
Boundary conditions. The number of relevant players is small enough that interdependence is recognised. Players are assumed to understand the game and to reason strategically. Predictions are sensitive to the timing of moves, the information structure, and the equilibrium concept chosen.
Related theories. Competitive dynamics, Collective action (Section 17.2), Auction theory (Section 17.8), Two-sided markets (Section 17.7), Signaling theory (Section 8.2).
11.4.1 Origins and intellectual history
Neumann and Morgenstern (1944) established game theory as a formal discipline, solving two-person zero-sum games. Most business situations, however, are not zero-sum: firms can both gain from restraint or both lose from a price war. J. F. Nash (1950) proved that every finite game has at least one equilibrium (possibly in mixed strategies) in which each player’s strategy is a best response to the others’, opening the analysis of non-cooperative games (J. Nash 1951). Older oligopoly models, Cournot’s (1838) firms choosing quantities and Bertrand’s (1883) firms undercutting each other’s prices down to marginal cost, were recast as Nash equilibria and extended to sequential moves, incomplete information, and repeated interaction (Tirole 1988, Shapiro 1989).
11.4.2 Core logic: the prisoner’s dilemma
The prisoner’s dilemma is the canonical structure behind many competitive traps. Each firm has a dominant strategy to defect (cut price, increase advertising), yet both would be better off if both cooperated. Table 11.5 presents an illustrative pricing game between two soft-drink rivals.
| Pepsi holds price | Pepsi discounts | |
|---|---|---|
| Coca-Cola holds price | 10, 10 (joint best) | 2, 14 |
| Coca-Cola discounts | 14, 2 | 5, 5 (Nash equilibrium) |
Whatever Pepsi does, Coca-Cola earns more by discounting (14 > 10 and 5 > 2), and the same holds for Pepsi. The unique Nash equilibrium is mutual discounting, with payoffs of 5 each, although both would earn 10 under mutual restraint. The game explains why industries with few rivals do not automatically enjoy monopoly profits and why price wars, advertising escalation, and capacity races can persist even when every participant regrets them.
11.4.3 Core logic: from one-shot to repeated games
Real rivals meet repeatedly. In a repeated game, cooperation can be sustained if each firm credibly threatens to punish defection and if the future matters enough. With a “grim trigger” strategy (cooperate until the rival defects, then defect forever), cooperation is an equilibrium when the discount factor \(\delta\) satisfies \(\delta \geq (T - R)/(T - P)\), where \(T\) is the temptation payoff, \(R\) the reward for mutual cooperation, and \(P\) the punishment payoff. With the payoffs in Table 11.5, this threshold is \((14 - 10)/(14 - 5) \approx 0.44\). This logic underlies the folk theorems of repeated games and the forbearance results of the previous section.
Axelrod (1984) ran computer tournaments in which strategies submitted by researchers played a repeated prisoner’s dilemma. The simplest entry, tit for tat (cooperate first, then copy the rival’s last move), won. It was nice (never defected first), retaliatory, forgiving, and clear. In noisy environments, where moves are sometimes misread or mistakes occur, strict retaliation can trigger long echoes of punishment. Figure 11.5 simulates this problem.
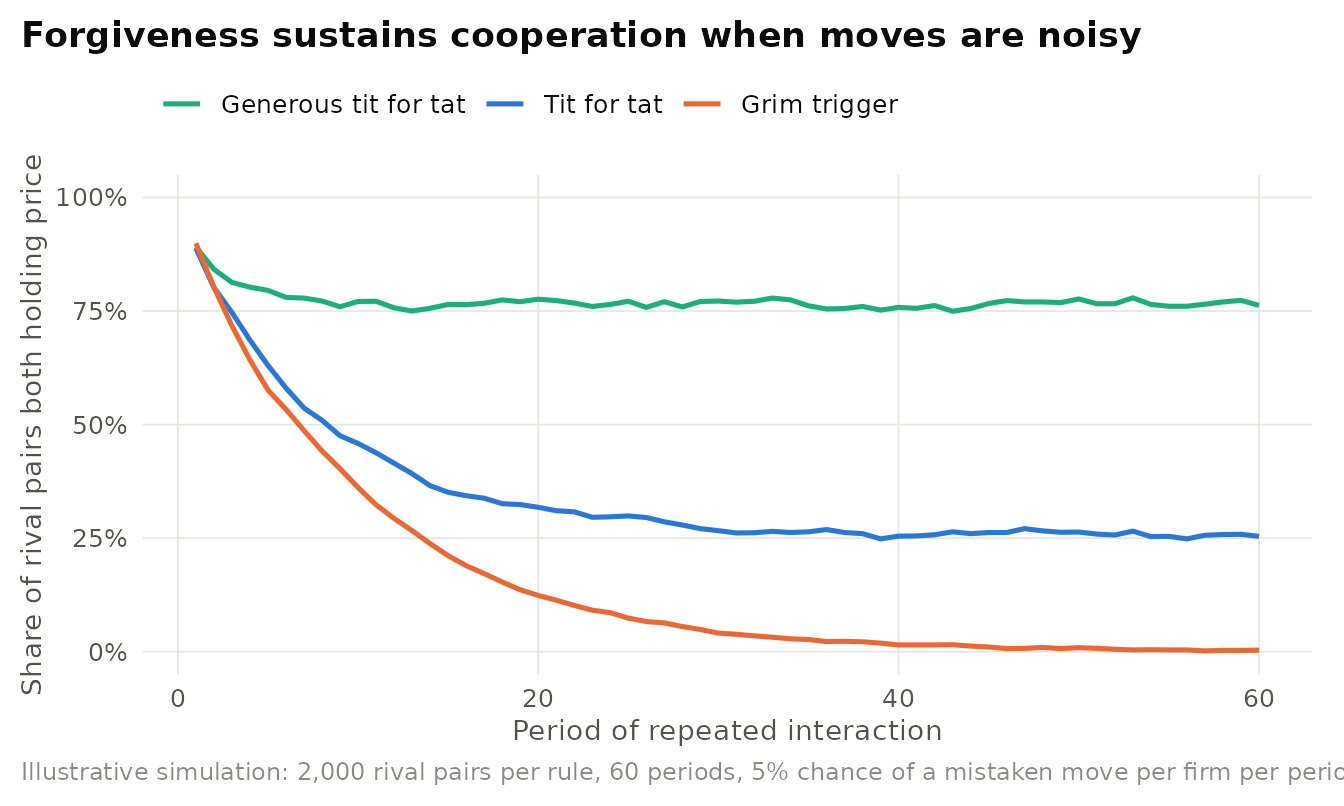
Figure 11.5: Illustrative simulation of a repeated pricing game with noise. Each period, each firm’s intended move is reversed with probability 0.05 (a mistake or a misread price). Grim trigger collapses into permanent price war after the first error. Tit for tat sustains less cooperation than it does without noise because errors echo back and forth. Generous tit for tat, which forgives a defection one-third of the time, recovers cooperation quickly.
11.4.4 Core logic: commitment and the timing of moves
When moves are sequential, the first mover can shape the rival’s choices by commitment: an irreversible action that changes its own future incentives. Schelling (1960) showed that limiting one’s own options can pay if it makes threats credible. In A. Dixit (1980), an incumbent that invests in capacity before entry lowers its marginal cost of expanding output, which makes aggressive post-entry pricing credible and can deter entry. Ghemawat (1991) argued that strategy turns on a small number of such sticky, lumpy, irreversible commitments. Reputation works similarly: even a small probability that an incumbent is a “tough” type can make it rational to fight early entrants and so deter later ones (Kreps and Wilson 1982, P. Milgrom and Roberts 1982).
Table 11.6 maps the main models to business situations.
| Model | Strategic variable | Key prediction | Business situation |
|---|---|---|---|
| Prisoner’s dilemma | Cooperate or defect | Mutual defection in one-shot play | Price wars, advertising escalation, promotions |
| Cournot oligopoly | Quantities or capacity | Prices above cost, falling as rivals increase | Commodity chemicals, memory chips, oil output |
| Bertrand competition | Prices for similar products | Prices driven toward marginal cost | Online retail of identical goods, generic drugs |
| Stackelberg leadership | Sequential quantity choice | The leader commits to large output and gains | Capacity pre-emption by incumbents |
| Entry deterrence | Capacity, pricing, reputation | Credible commitments deter entrants | Incumbent investment ahead of demand |
| Repeated games | Strategies over time | Cooperation if the future matters enough | Tacit price coordination, mutual forbearance |
| Co-opetition (value net) | Players, added values, rules, tactics, scope | Change the game rather than play it better | Complementors in platforms, joint standards |
11.4.5 Co-opetition and changing the game
Brandenburger and Nalebuff (1996) translated game theory for managers through two ideas. The value net maps a firm’s customers, suppliers, competitors, and complementors (players whose products make the firm’s products more valuable), and the same firm can be both competitor and complementor. Added value is the amount by which total value would fall if a player left the game, and no player can capture more than its added value. The lesson is that firms often gain more by changing the game (its players, added values, rules, tactics, and scope) than by playing it more cleverly.
Is game theory useful for strategy? Saloner (1991) defended formal models as disciplined thought experiments even when they yield no precise prescription. C. F. Camerer (1991) noted that predictions hinge on assumptions about rationality and common knowledge that experiments often contradict. A further criticism is that almost any outcome can be rationalised by some game, so the game must be specified before the data are examined. Defenders reply that the theory’s value lies in diagnosing the structure of a situation, which then guides action.
11.4.6 Applications in business
The cola wars as a repeated game. Coca-Cola and PepsiCo have competed in carbonated soft drinks for more than a century, a textbook repeated game between two dominant players. Their rivalry has been conducted mostly through advertising, brand campaigns, and contracts with restaurant chains and bottlers rather than through sustained list-price wars. Pepsi’s blind-taste “Pepsi Challenge,” launched in the 1970s, was a highly visible attack. Coca-Cola’s decision in April 1985 to replace its flagship formula with “New Coke,” widely interpreted as a reaction to Pepsi’s gains in taste tests, provoked a consumer backlash, and within about three months the original formula returned as “Coca-Cola Classic.” In game-theoretic terms, heavy advertising has some prisoner’s-dilemma features (each firm advertises partly to neutralise the other), while restraint in price competition is consistent with the repeated-game logic of Figure 11.5.
Illustrative scenario: credible capacity commitment. A regional cement producer learns that a rival plans to build a plant in its market. If the incumbent announces a price war, the threat is not credible: once the entrant has sunk its investment, fighting would hurt the incumbent too. If the incumbent instead completes a capacity expansion before the entrant decides, the calculation changes. With low marginal cost on its new capacity, the incumbent will rationally price aggressively after entry, and the entrant, anticipating this, may stay out (A. Dixit 1980). The commitment works only because it is irreversible and observable.
11.4.7 Using the theory in research
Sample hypotheses.
- H1. Price cooperation among rivals will be greater in markets where firms expect to interact for longer (for example, lower probability of exit).
- H2. Incumbents will invest more in capacity ahead of demand in markets where the threat of entry is high and capacity is irreversible.
- H3. In laboratory pricing games, the introduction of noise in observed rival prices will reduce cooperation more under strict tit for tat than under forgiving strategies.
Designs. Formal modelling to derive predictions, structural estimation of oligopoly conduct, laboratory and online experiments with repeated games, and quasi-experiments from changes in information (price transparency regulation, public price comparison sites).
Measures. Price-cost margins, price dispersion, frequency and depth of price cuts, capacity announcements, entry and exit, and experimentally elicited cooperation rates.
Reasoning from the wrong game. The most common misuse is to apply a familiar game (usually the prisoner’s dilemma) without checking that its assumptions hold. Are moves simultaneous or sequential? Is the interaction one-shot or repeated? Are payoffs known? Can commitments be observed? A Bertrand model predicts cut-throat pricing, a Cournot model moderate margins, and a repeated game possible cooperation, all for the same industry. Specify the game from institutional facts before deriving a prediction.
11.5 First-Mover Advantage
Core claim. Pioneering firms can earn positive economic profits because early entry allows them to gain technological leadership, pre-empt scarce assets, and create buyer switching costs. Early entry also carries disadvantages, so the net advantage depends on the firm’s resources and on how fast technology and markets evolve.
Origins. Strategic management and marketing. Lieberman and Montgomery (1988) and Lieberman and Montgomery (1998). Marketing evidence from W. T. Robinson and Fornell (1985), G. S. Carpenter and Nakamoto (1989), and the critique by Golder and Tellis (1993). Contingency theory (Section 7.6) of entry timing by Suarez and Lanzolla (2007).
Level of analysis. Firm within a new product market.
Key constructs. Order of entry, pioneer, early follower, technological leadership, pre-emption of assets, switching costs, free-rider effects, resolution of uncertainty, incumbent inertia, pace of technological and market evolution.
Boundary conditions. Advantages require mechanisms that let the pioneer appropriate value (learning that stays proprietary, scarce assets, switching costs, network effects (Section 17.6)). They weaken when technology or customer needs shift quickly or when imitation is cheap.
Related theories. Resource-based theory (Section 4.1), Network effects (Section 17.6), Dominant design (Section 12.5), Diffusion of innovations (Section 10.1), Liability of newness (Section 12.10).
11.5.1 Origins and core logic
The idea that being first pays is intuitive and was popular with managers long before it was a theory. Lieberman and Montgomery (1988) gave it theoretical structure by asking how a pioneer could earn positive economic profits and why the advantage would not be competed away. They identified three families of mechanisms and four countervailing disadvantages. Figure 11.6 presents the mechanism, and Table 11.7 gives examples.
Figure 11.6: Mechanisms of first-mover advantage and disadvantage. Early entry can generate advantages through technological leadership, pre-emption of scarce assets, and buyer switching costs, but also exposes the pioneer to free riding, unresolved uncertainty, shifts in technology or needs, and its own inertia. The pace of technological and market evolution moderates the balance.
| Mechanism | Direction | Logic | Illustration |
|---|---|---|---|
| Technological leadership | Advantage | Learning-curve cost reductions and patents that stay proprietary | Early leaders in semiconductors riding cumulative output down the cost curve |
| Pre-emption of scarce assets | Advantage | Control of inputs, locations, shelf space, or capacity before rivals | Retail chains securing the best sites in a new region |
| Switching costs and network effects | Advantage | Buyers who adopt early are costly to lure away, and installed bases attract more users | eBay’s early lead in online auctions in the United States |
| Free-rider effects | Disadvantage | Followers imitate at lower cost and learn from the pioneer’s market education | Platform owners entering categories that complementors have proven |
| Resolution of uncertainty | Disadvantage | Followers enter after technology and demand become clear | Late entrants building on a settled dominant design |
| Shifts in technology or needs | Disadvantage | The pioneer’s assets fit the old technology or needs | Early social networks overtaken by later entrants |
| Incumbent inertia | Disadvantage | The pioneer becomes locked into early routines and investments | Early leaders slow to adopt the next technology generation |
The core propositions are:
- P1 (Appropriation). First movers gain an advantage only when an isolating mechanism lets them appropriate the returns of early entry (Lieberman and Montgomery 1988).
- P2 (Consumer learning). In consumer markets, pioneers can shape buyer preferences and become the prototype against which later entrants are judged (G. S. Carpenter and Nakamoto 1989).
- P3 (Resources and timing). The optimal entry time differs across firms because firms differ in resources: a firm with strong commercialisation capabilities may profit from waiting (Lieberman and Montgomery 1998).
- P4 (Environmental dynamics). First-mover advantages are most likely when both technology and the market evolve smoothly, and least likely when technology changes abruptly and overturns the pioneer’s position (Suarez and Lanzolla 2007).
11.5.2 Evidence and extensions
Early evidence was striking. Studies using the Profit Impact of Market Strategy (PIMS) database found that pioneers held larger market shares than later entrants (W. T. Robinson and Fornell 1985), and reviews of order-of-entry research found an inverse relationship between order of entry and market share in many consumer product categories (Kalyanaram, Robinson, and Urban 1995). G. S. Carpenter and Nakamoto (1989) explained why in psychological terms: the pioneer can define the attributes that consumers consider important.
Golder and Tellis (1993) challenged this record. PIMS and survey studies rely on surviving firms that classify themselves as pioneers, so failed pioneers vanish from the data and successful early followers may claim the label. Using historical records to identify the true pioneers in a set of product categories, Golder and Tellis found that nearly half had failed and that survivors’ average share was much lower than earlier studies suggested. Early market leaders, who typically entered after the pioneer, performed better. A meta-analysis by VanderWerf and Mahon (1997) confirmed that methodological choices, including the use of market share as the outcome and the treatment of survivors, shape the observed size of first-mover effects.
Lieberman and Montgomery (1998) responded by connecting the theory to resource-based theory (Section 4.1). Entry timing is not an exogenous treatment but a strategic choice that reflects resources. Firms with strong technological capabilities may rationally enter early, and firms with strong marketing and distribution capabilities may rationally wait. Comparing early and late entrants therefore confounds the effect of timing with the effect of the resources that led firms to choose that timing.
Marketing logic or marketing legend? Survivor bias, self-reported pioneer status, and the endogeneity of entry timing all inflate apparent first-mover advantages (Golder and Tellis 1993, VanderWerf and Mahon 1997). Yet early entry does pay in some settings, particularly where network effects or switching costs are strong. The consensus is contingent: first-mover advantages exist but are neither universal nor automatic (Suarez and Lanzolla 2007).
11.5.3 Applications in business
Pioneers that held on and pioneers that did not. eBay, founded in 1995, was among the earliest online auction sites, and the network effects of a marketplace (buyers attract sellers and sellers attract buyers) allowed it to dominate U.S. online auctions for many years. Social networking tells the opposite story. Friendster and MySpace attracted large audiences before Facebook, yet Facebook overtook both. Similarly, Google entered web search years after AltaVista and Yahoo. The mechanisms in Table 11.7 explain the difference. Where network effects were strong and technology stable, the pioneer’s lead persisted. Where technology and user expectations shifted rapidly, better followers free-rode on the market education that pioneers had provided.
Platform entry decisions. Platform owners face a recurring timing choice: whether, and when, to enter the product spaces of their own complementors. F. Zhu and Liu (2018) studied Amazon’s entry into product categories previously served by third-party sellers on its marketplace and found that Amazon was more likely to enter product spaces that had already proved popular and well rated. In the language of first-mover theory, the platform deliberately waits, allowing complementors to resolve market uncertainty, and then enters as a well-informed follower. For complementors, the implication is that being first on a platform carries a distinctive risk: success itself signals an attractive category to the platform owner.
11.5.4 Using the theory in research
Sample hypotheses.
- H1. The market-share advantage of pioneers over early followers will be larger in categories with strong network effects than in categories without them.
- H2. After controlling for the selection of entry timing on firm resources, the effect of early entry on long-run survival will be smaller than in naive comparisons.
Designs. Historical identification of all entrants (including failures), selection models or instrumental variables for entry timing, matched comparisons of pioneers and followers with similar resources, and consumer experiments on pioneer prototypicality.
Measures. Order and date of entry, survival, long-run market share and profitability, switching-cost and network-effect proxies, pace of technical change (patent or performance-improvement rates).
Survivor bias. Studying only firms that still exist, or relying on firms to report whether they pioneered a market, systematically overstates first-mover advantages. Build the sample of entrants from historical sources before outcomes are known, include failures, and treat entry timing as a choice that must be modelled rather than as a random treatment.
11.6 Real Options Theory
Core claim. Many strategic investments create the right, but not the obligation, to take future actions. When the future is uncertain and investments are irreversible, such real options have value that static net present value ignores. Firms should invest small amounts to create options, keep them open while uncertainty resolves, and exercise or abandon them as information arrives.
Origins. Finance and strategic management. Myers (1977) framed growth opportunities as options on real assets. A. K. Dixit and Pindyck (1994) and Trigeorgis (1996) developed the theory of investment under uncertainty. Strategy applications by Kogut (1991), Bowman and Hurry (1993), McGrath (1997), and McGrath (1999). Boundaries examined by Adner and Levinthal (2004), reviewed by Trigeorgis and Reuer (2017).
Level of analysis. Investment project and the firm’s portfolio of investments.
Key constructs. Uncertainty (volatility), irreversibility, flexibility, option to defer, stage, expand, abandon, or switch, exercise decision, growth options, option value.
Boundary conditions. Uncertainty must be resolvable over time through external events or the firm’s own learning. The investment must be at least partly irreversible. Managers must be able and willing to exercise or abandon options on the basis of new information.
Related theories. Behavioral theory of the firm, Escalation of commitment (Section 14.2), Exploration and exploitation (Section 5.3), Portfolio theory (Section 16.1), Effectuation (Section 12.7).
11.6.1 Origins and intellectual history
Myers (1977) observed that much of a firm’s value consists of growth opportunities: options to make future investments whose value depends on conditions not yet known. Treating them as call options on real assets gave rise to the term real options. Just as a call option gives the right to buy an asset at a fixed price, an R&D project, pilot plant, or joint venture gives a firm the right to invest more later if conditions prove favourable.
A. K. Dixit and Pindyck (1994) developed the economic theory. Their key result is that when an investment is irreversible and its value uncertain, the option to wait has value, so the firm should invest only when the expected value exceeds the investment cost by a margin that grows with uncertainty. The textbook rule “invest if NPV > 0” is wrong in such settings, because investing now kills the option to wait. Trigeorgis (1996) catalogued the main types of real options, which Table 11.8 summarises.
| Option type | What it allows | Business example |
|---|---|---|
| Option to defer | Wait for uncertainty to resolve before committing | Holding land or a licence without developing it |
| Option to stage | Invest in sequential steps, each conditional on the last | Drug development through clinical phases, venture capital rounds |
| Option to expand (growth option) | Scale up if the market proves attractive | Pilot plant, test-market launch, platform entry into a small market |
| Option to abandon | Exit and recover salvage value if outcomes are poor | Leasing rather than buying assets, kill criteria in R&D |
| Option to switch | Change inputs, outputs, or processes as prices change | Flexible manufacturing lines, dual-fuel power plants |
| Option to acquire | Buy out a partner when value becomes clear | Joint ventures that end in acquisition |
11.6.2 Core logic and propositions
Real options reasoning makes three counterintuitive predictions. First, uncertainty can increase the value of an investment opportunity, because the option holder captures the upside and limits the downside. Second, small initial investments that look unprofitable on their own can be justified by the options they create. Third, the value of flexibility is greatest when uncertainty is high and when information arrives before the major commitment must be made. Figure 11.7 illustrates the second and third points.
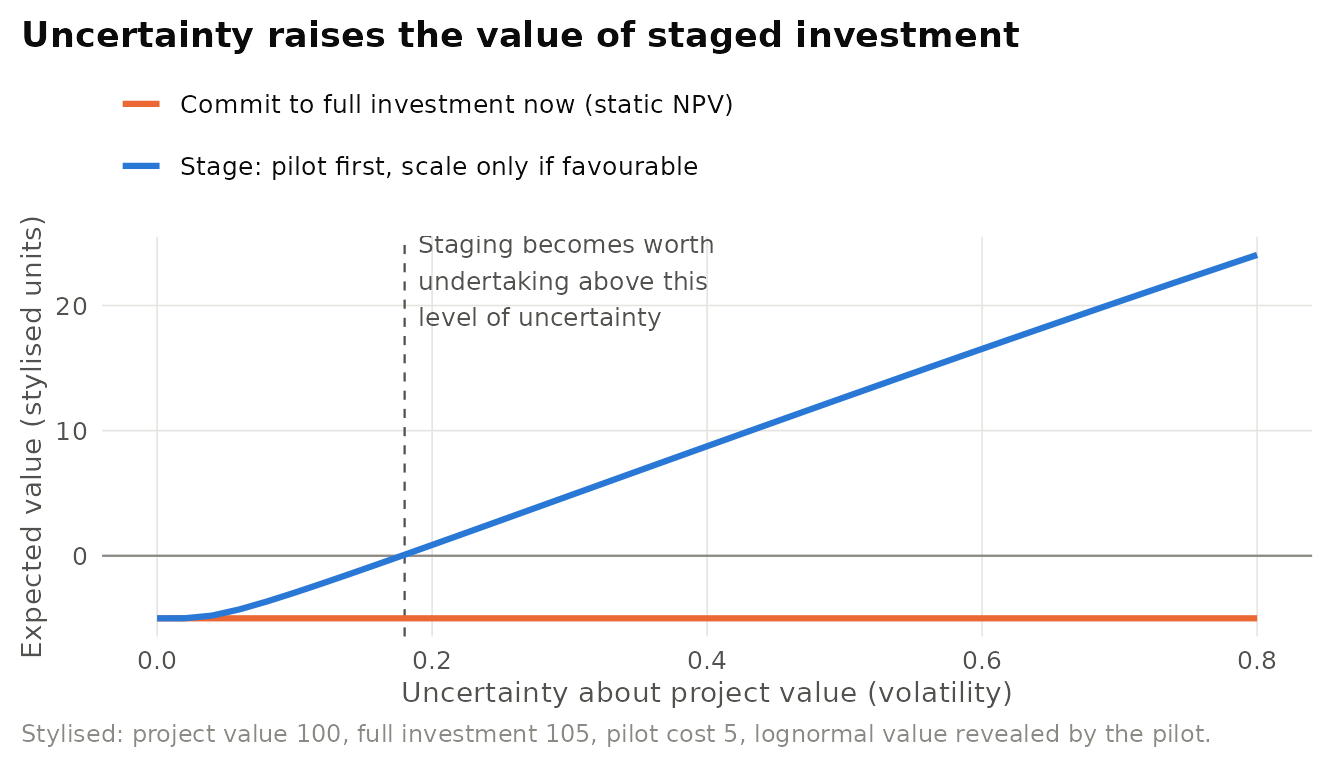
Figure 11.7: Stylised comparison of committing to a full investment now with staging it through a pilot. The full project has a static NPV of -5 at every level of uncertainty. Staging costs 5 up front but lets the firm scale only if the pilot reveals a favourable market. The value of staging rises with uncertainty, and above a threshold the staged project is worth undertaking even though the full project is not. Illustrative Monte Carlo values.
In propositional form:
- P1 (Value of flexibility). The value of an option to invest increases with the uncertainty of the underlying opportunity and with the time available before the decision must be made (A. K. Dixit and Pindyck 1994).
- P2 (Staging). Under high uncertainty, firms that invest in small, staged steps outperform firms that commit fully at the outset, provided that they abandon unpromising options (McGrath 1999).
- P3 (Option chains). Initial investments create shadow options that become recognised and valued only as firms learn, and options often come in chains in which exercising one creates the next (Bowman and Hurry 1993).
- P4 (Acquisition timing). Firms structure uncertain collaborations as joint ventures and exercise the option to acquire when the venture’s value turns out to be higher than expected (Kogut 1991).
11.6.3 Evidence and extensions
Bowman and Hurry (1993) recast strategy as an incremental-choice process in which firms build portfolios of options through small resource investments and strike them when opportunities become clear. Kogut (1991) found that unexpected increases in the value of a joint venture’s product market made acquisition by a partner more likely, consistent with the venture serving as an option to expand. McGrath (1999) argued that options reasoning reframes entrepreneurial failure as an expected outcome of a portfolio: the goal is to bound the cost of each failure and multiply the number of attempts, so that occasional large successes pay for many small losses.
Adner and Levinthal (2004) argued that real options logic is often misapplied. Financial options have fixed underlying assets and exercise prices, whereas real projects can be redefined along the way: when a technology disappoints, managers can always find a new application for it, which undermines the discipline of abandonment. A review by Trigeorgis and Reuer (2017) concludes that the theory is well supported where staging is clear (R&D, joint ventures, international expansion) but that measurement of option value and of managers’ actual reasoning remains weak.
Options or escalation? Real options reasoning assumes that managers will kill options when signals are negative. Behavioural research on escalation of commitment (Section 14.2) suggests that they often do not. Pilots become pet projects, sunk costs create pressure to continue, and the language of options can be used to justify investments that would otherwise be rejected. Critics also question whether real options valuation, built for traded financial assets, is meaningful when the underlying asset is not traded and its volatility cannot be estimated (Adner and Levinthal 2004). Proponents respond that the main value of the theory is reasoning, not precise valuation: framing decisions as options changes how firms structure investments, set milestones, and define abandonment criteria (McGrath 1999).
11.6.4 Applications in business
Staged R&D in pharmaceuticals. Drug development is a sequence of options. Discovery and preclinical work buy the right to start human trials, Phase I trials buy the right to conduct Phase II, and so on through Phase III and regulatory review. Each stage typically costs more than the last and resolves part of the technical and commercial uncertainty, and most candidates are abandoned along the way. A static valuation that ignores the right to stop understates the value of early-stage candidates. Staged venture capital rounds follow the same logic.
Illustrative scenario: entering a new market through a pilot. A consumer-goods firm is considering an irreversible factory investment in a new national market with highly uncertain demand and a slightly negative static NPV. Options reasoning suggests an import-and-distribution pilot with a local partner, explicit milestones (sales volume, retailer reorders), and a factory only if the milestones are met. The decisive question is whether the firm will actually walk away if they are missed.
11.6.5 Using the theory in research
Sample hypotheses.
- H1. Firms will be more likely to use joint ventures rather than acquisitions to enter markets with high demand uncertainty.
- H2. The likelihood of acquiring a joint-venture partner will increase after positive, unexpected shocks to the venture’s market value.
- H3. R&D projects with pre-specified kill criteria will be abandoned earlier after negative signals than projects without such criteria.
Measures. Uncertainty (volatility of industry returns, forecast dispersion), irreversibility (asset specificity, sunk-cost share), staging (number of investment rounds, milestone contracts), exercise and abandonment events.
Designs. Event histories of entry mode and exercise decisions (alliance databases, clinical trial registries, venture financing rounds), laboratory experiments on abandonment, and simulation models of option portfolios.
Calling everything an option. Any investment can be described as creating future opportunities, so the label “option” can rationalise almost anything. A real option exists only if uncertainty will resolve before the next decision, the next decision is genuinely discretionary, and the firm is prepared to abandon the position. If a pilot cannot produce decision-relevant information, or if the organization will never walk away, it is not an option but a down payment on a commitment already made (Adner and Levinthal 2004).
11.7 Behavioral Theory of the Firm
Core claim. Firms are coalitions of boundedly rational actors that pursue multiple goals expressed as aspiration levels. When performance falls below aspiration, firms engage in problemistic search and become more willing to change. When performance exceeds aspiration, slack accumulates and change is driven more by slack and less by problems. Aspirations adapt to past performance and to the performance of peers.
Origins. Organization theory and economics at the Carnegie Institute of Technology. Cyert and March (1963), building on Simon (1955). Performance feedback theory developed by Greve (1998) and Greve (2003). Reviewed by Gavetti et al. (2012) and Shinkle (2012).
Level of analysis. Organization, with micro-foundations in individual and group decision making.
Key constructs. Organizational coalition, aspiration level (historical and social), performance feedback, problemistic search, slack search, organizational slack, quasi-resolution of conflict, uncertainty avoidance, standard operating procedures, adaptive learning.
Boundary conditions. Goals must be measurable and salient. The theory assumes that decision makers compare performance with reference points and that search is costly. Predictions weaken near the point of organizational survival, where attention shifts from aspirations to avoiding failure (March and Shapira 1992).
Related theories. Bounded rationality (Section 23.1), Prospect theory (Section 24.2), Organizational learning (Section 14.3), Exploration and exploitation (Section 5.3), Attention-based view, Garbage can model (Section 14.1).
11.7.1 Origins and intellectual history
Neoclassical economics treated the firm as a single actor maximising profit with complete information. Cyert and March (1963) replaced this abstraction with a model of how real firms make decisions about price, output, and resource allocation. Building on Simon (1955)’s concept of bounded rationality (Section 23.1), they described the firm as a coalition of participants (managers, workers, shareholders, suppliers) with partly conflicting goals. Goals are not maximised but expressed as aspiration levels: targets that define satisfactory performance. Four relational concepts organized the theory:
- Quasi-resolution of conflict. Conflicting goals are attended to sequentially and in separate subunits rather than reconciled.
- Uncertainty avoidance. Firms prefer short-run feedback and negotiated environments to long-run forecasting.
- Problemistic search. Search is triggered by problems, begins near the symptom and current alternatives, and is biased by searchers’ experience.
- Organizational learning. Goals and search rules adapt to experience.
Organizational slack, the excess of available resources over the payments needed to hold the coalition together, absorbs shocks, eases conflict, and funds experiments that would not survive scrutiny in lean times (Cyert and March 1963, Bourgeois 1981).
11.7.2 Core logic and propositions
Modern performance feedback theory formalises the model. Each period the firm compares its performance with an aspiration level that is a weighted average of its own past performance (the historical aspiration) and the performance of comparable firms (the social aspiration). Figure 11.8 shows the loop.
Figure 11.8: The behavioral theory of the firm as a performance feedback loop. Performance is compared with an aspiration level formed from the firm’s own history and from peers. Shortfalls trigger problemistic search and greater willingness to take risks. Success builds slack, which funds slack search. Aspirations then adapt to experience.
The main propositions are:
- P1 (Problemistic search). The further performance falls below aspiration, the more intensively firms search for solutions and the more willing they are to make risky changes (Cyert and March 1963, Greve 1998).
- P2 (Success and persistence). As performance rises above aspiration, the likelihood of risky change declines, and past success breeds strategic persistence (Audia, Locke, and Smith 2000).
- P3 (Slack). Slack enables experimentation, so the relationship between slack and innovation is positive up to a point, beyond which slack breeds complacency and undisciplined projects (Nohria and Gulati 1996).
- P4 (Adaptive aspirations). Aspirations adjust toward recent own and peer performance, so persistent success raises the bar and persistent failure lowers it.
- P5 (Survival focus). Near the threshold of failure, attention can shift from the aspiration to survival, making firms more cautious than performance feedback alone would predict (March 1988, March and Shapira 1992).
Figure 11.9 shows the stylised shape that performance feedback research typically estimates.
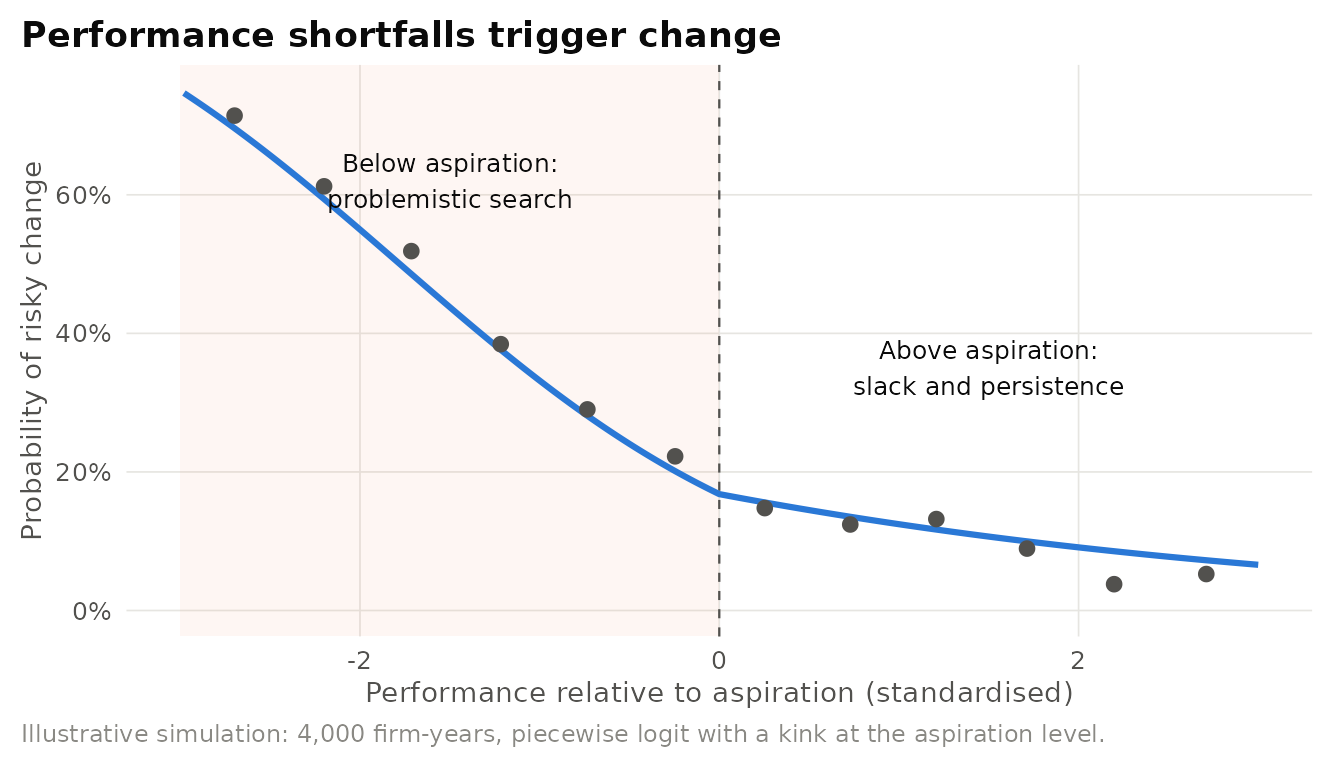
Figure 11.9: Stylised performance feedback relationship. The probability of a risky strategic change declines as performance rises relative to aspiration, with a change in slope (a kink) at the aspiration level. Points show binned averages from simulated firm-years, and the line shows the generating function. Illustrative data.
11.7.3 Evidence and extensions
Performance feedback is one of the best-supported predictions in organization theory. Greve (1998) studied U.S. radio stations and found that stations were more likely to make risky changes of format when performance fell short of aspirations and less likely as performance rose above them, using both historical and social aspiration levels. Greve (2003) synthesised the program into a general theory of learning from performance feedback. Similar patterns appear for corporate risk taking (Bromiley 1991) and acquisitions (Iyer and Miller 2008). Audia, Locke, and Smith (2000) combined an archival study of firms facing deregulation with a laboratory study to show that past success increases strategic persistence after radical environmental change, even when persistence hurts performance. Nohria and Gulati (1996) found an inverted-U relationship between slack and innovation: too little slack starves experimentation, whereas too much reduces discipline.
The theory’s reference-point logic parallels prospect theory (Section 24.2) (Kahneman and Tversky 1979), and its account of local search anticipates the trade-off between exploration and exploitation (Section 5.3) (March 1991) and the myopia of learning (Levinthal and March 1993). Reviews call for more attention to multiple, conflicting goals and to how firms choose the comparison group that defines their social aspiration (Gavetti et al. 2012, Shinkle 2012).
Search or threat rigidity? The BTOF predicts that failure stimulates search and risk taking. A competing view holds that threat produces rigidity: under pressure, organizations centralise control and fall back on familiar routines. The two can be reconciled through the survival point (March and Shapira 1992): moderate shortfalls trigger search, whereas threats to survival trigger caution. A second debate concerns measurement. Aspiration levels are rarely observed and are usually computed from historical and peer performance with assumed weights, so results can be sensitive to how aspirations are constructed (Shinkle 2012).
11.7.4 Applications in business
Performance-feedback-driven change. The theory explains a familiar corporate pattern. Firms that miss their own targets, or fall behind peers, are more likely to reorganise, replace executives, launch acquisitions, or change strategy (Greve 1998, Iyer and Miller 2008). Firms that beat expectations tend to persist, which is efficient when the environment is stable and dangerous when it is not. Audia, Locke, and Smith (2000) showed that after deregulation transformed industries such as airlines and trucking, previously successful firms were slower to change their strategies. Practical implications follow. Managers can deliberately set aspirations by choosing comparison groups (a firm benchmarked against a struggling peer group will feel little pressure to change), and boards can counteract success-induced persistence by commissioning reviews when performance is strong rather than only when it is weak.
11.7.5 Using the theory in research
Sample hypotheses.
- H1. The likelihood of a strategic change will increase as performance falls further below the social aspiration level.
- H2. Performance above aspiration will reduce the likelihood of risky change, and this effect will be weaker for firms with high absorbed slack.
- H3. The effect of performance shortfalls on risk taking will reverse as firms approach the threshold of financial distress.
Measures. Historical aspiration (exponentially weighted own past performance), social aspiration (peer mean or median), performance-aspiration gaps (spline coded above and below zero), slack (current ratio, selling and administrative expense ratio, unused borrowing capacity), and risky change (R&D intensity, acquisitions, entry into new markets, product changes).
Designs. Panel models with spline specifications at the aspiration level, event-history models of change, laboratory experiments that manipulate feedback, and agent-based simulations of aspiration adaptation.
Mechanical aspirations. Researchers often compute aspirations with arbitrary weights and comparison groups and then treat the resulting gap as an observed psychological reference point. Results can change with the weights. Report sensitivity to alternative specifications, justify the peer group, and where possible validate aspirations against stated targets (guidance, budgets, incentive thresholds).
11.8 Attention-Based View
Core claim. Firm behaviour is the result of how organizations channel and distribute the attention of their decision makers. What managers notice, and therefore what the firm does, depends on the issues and answers they focus on, the situation they find themselves in, and the rules, resources, and relationships that structure attention within the firm.
Origins. Strategic management and organization theory. Ocasio (1997), building on Simon (1955) and Cyert and March (1963), refined in Ocasio (2011).
Level of analysis. Organization and individual decision makers, linked through the firm’s structures and communication channels.
Key constructs. Focus of attention, situated attention, structural distribution of attention, issues and answers, attention structures (rules of the game, players, structural positions, resources), procedural and communication channels, organizational moves.
Boundary conditions. Attention must be scarce relative to the issues competing for it. The view is most useful when outcomes depend on noticing and interpreting change rather than on executing a known plan.
Related theories. Behavioral theory of the firm, Upper echelons theory (Section 6.4), Sensemaking (Section 14.11), Dynamic capabilities (Section 5.1), Strategic groups.
11.8.1 Core logic
If rationality is bounded, attention is the scarce resource. Ocasio (1997) built a theory of the firm on three principles. Focus of attention: what decision makers do depends on the issues and answers they focus on. Situated attention: that focus depends on the context in front of them (meetings, reports, problems). Structural distribution of attention: the firm’s rules, resources, players, and positions determine which issues reach which decision makers, through procedural and communication channels such as budget reviews, planning cycles, and executive committees. Organizational moves are the output of this attention-processing system (Figure 11.10).
Figure 11.10: The attention-based view. The environment and the firm’s attention structures (rules, players, positions, resources) feed issues and answers into procedural and communication channels. These channels situate the attention of decision makers, whose focus determines organizational moves, which in turn reshape the environment and the firm’s structures.
The view yields three core propositions:
- P1 (Selective focus). Firms respond to the environmental changes that their decision makers attend to, not to all changes that matter (Ocasio 1997).
- P2 (Structure channels attention). The design of governance channels, committees, and reporting systems shapes which issues reach top management and therefore which adaptations occur (Joseph and Ocasio 2012).
- P3 (Executive attention and adaptation). When top managers attend to an emerging technology or market, firms adapt faster (Eggers and Kaplan 2009, Cho and Hambrick 2006).
11.8.2 Evidence and extensions
Cho and Hambrick (2006) studied U.S. airlines after the 1978 deregulation and found that the composition of top management teams influenced the extent to which executives attended to entrepreneurial issues, and that this attention mediated the relationship between team characteristics and strategic change. Eggers and Kaplan (2009) found that incumbent communications-equipment firms entered the emerging optical networking market faster when their CEOs paid more attention to the new technology. Joseph and Ocasio (2012) traced half a century of General Electric’s history and showed that the architecture of cross-level governance channels shaped how the firm’s attention, and with it adaptation, evolved. Tripsas and Gavetti (2000) showed that Polaroid developed strong digital imaging capabilities but that managerial beliefs anchored in its instant-film business model directed attention away from commercialising them. Ocasio (2011) refined the theory by distinguishing attentional perspective (the top-down schemas that make some issues salient), attentional engagement (sustained, effortful allocation of attention), and attentional selection (the outcome of the process).
Attention or cognition? Attention is hard to observe, and common proxies such as word counts in shareholder letters may reflect impression management. The view also overlaps with upper echelons theory, sensemaking, and managerial cognition. Its distinctive contribution is the structural claim: attention is distributed by the organization’s channels and rules, not only by executives’ personal characteristics (Ocasio 2011, Joseph and Ocasio 2012).
11.8.3 Applications in business
Redirecting a firm’s attention. In May 1995, Bill Gates circulated an internal memo titled “The Internet Tidal Wave,” which declared the internet the most important development for Microsoft since the IBM PC and directed managers across the company to make it a priority. Whatever one concludes about the subsequent strategy, the memo is a clear instance of a deliberate attempt to change the focus of attention of an entire organization. Intel offers a complementary structural example. Burgelman (1994) showed that Intel’s exit from dynamic memory chips in the mid-1980s was prepared by middle managers who allocated scarce manufacturing capacity according to a margin-per-wafer rule, which steadily shifted resources toward microprocessors before top management formally decided to exit. The resource-allocation rule was an attention structure that channelled the firm toward its future.
11.8.4 Using the theory in research
Sample hypotheses.
- H1. Firms whose top executives devote more attention to an emerging technology in public communications will enter the technology’s market sooner.
- H2. The creation of a dedicated governance channel for a new issue (for example, a sustainability committee of the board) will increase the firm’s subsequent investment in that issue.
- H3. Attention to competitors in executive communications will mediate the effect of market commonality on competitive responses.
Measures. Text-based attention measures from shareholder letters, earnings calls, and internal documents, agenda analysis of meetings, the structure of committees and reporting lines, time allocation of executives.
Designs. Longitudinal case studies of attention structures, panel models with text-based attention measures, and natural experiments in which reporting structures change.
11.9 Chapter Summary
- The structure-conduct-performance paradigm explains profit differences by industry structure and entry barriers (Bain 1956). Variance-decomposition studies show that industry matters, but that firm-specific effects often matter more (Rumelt 1991, McGahan and Porter 1997).
- Strategic groups and mobility barriers explain persistent differences among firms within the same industry (Caves and Porter 1977), although the existence and performance consequences of groups remain contested (J. B. Barney and Hoskisson 1990).
- Competitive dynamics treats rivalry as action and response between specific rivals, shaped by market commonality, resource similarity, and the awareness-motivation-capability drivers. Multimarket contact can produce mutual forbearance (M.-J. Chen 1996, Gimeno 1999).
- Game theory identifies the structure of strategic interaction. One-shot dilemmas produce mutual defection, repeated interaction and credible commitment can sustain cooperation or deter entry (J. F. Nash 1950, A. Dixit 1980).
- First-mover advantages are real but contingent on isolating mechanisms, resources, and environmental dynamics, and early evidence was inflated by survivor bias (Lieberman and Montgomery 1988, Golder and Tellis 1993).
- Real options theory shows why uncertainty and irreversibility make staged investment valuable, provided that firms are willing to abandon options (A. K. Dixit and Pindyck 1994, McGrath 1999, Adner and Levinthal 2004).
- The behavioral theory of the firm explains change as a response to performance relative to aspirations, with slack and search as central mechanisms (Cyert and March 1963, Greve 2003).
- The attention-based view explains firm behaviour by how organizations structure and distribute the attention of decision makers (Ocasio 1997).
Table 11.9 presents the comparison of the chapter’s theories.
| Theory | Unit of explanation | Key mechanism | Signature prediction | Typical business use |
|---|---|---|---|---|
| Structure-conduct-performance | Industry | Entry barriers and concentration enable coordination | Concentrated, protected industries earn higher profits | Industry attractiveness, antitrust analysis |
| Strategic groups | Group within industry | Mobility barriers | Persistent differences between groups in one industry | Competitor mapping, repositioning |
| Competitive dynamics | Rival dyad | Awareness, motivation, capability | Attack and response depend on commonality and similarity | Anticipating rival responses |
| Game theory | Interacting players | Equilibrium, commitment, repetition | Dilemmas, credible threats, tacit cooperation | Pricing, entry deterrence, co-opetition |
| First-mover advantage | Entrant in new market | Isolating mechanisms versus free riding | Pioneers win only with appropriability | Entry timing decisions |
| Real options theory | Investment project | Value of flexibility under uncertainty | Staging beats commitment when uncertainty is high | R&D pipelines, pilots, joint ventures |
| Behavioral theory of the firm | Organization | Aspirations, search, slack | Shortfalls trigger change, success breeds persistence | Target setting, benchmarking, renewal |
| Attention-based view | Organization and executives | Structured allocation of attention | Firms adapt to what their structures make salient | Governance design, strategic agenda setting |
11.10 Discussion Questions
- Variance-decomposition studies reach different conclusions about how much industry matters. What features of the data and research design drive these differences, and what would a design that identifies the causal effect of industry structure on profitability look like?
- Choose an industry you know well and draw a strategic group map. Which mobility barriers separate the groups, and which firms are best placed to cross them?
- Using the awareness-motivation-capability framework, predict how incumbent carriers would respond to the entry of a low-cost airline into one of their hub markets. How would multimarket contact change your prediction?
- The cola rivalry has involved intense advertising but relatively few sustained list-price wars. Use repeated-game logic to explain why, and identify the conditions under which a price war would become more likely.
- Golder and Tellis argued that pioneering advantage was partly a “marketing legend.” Design a study of entry timing in a recent technology market that avoids survivor bias and accounts for the endogeneity of entry timing.
- A manager argues that every pilot project is a real option. Under what conditions is she right, and how would you design governance (milestones, kill criteria) so that the options logic and the behavioural tendency toward escalation do not conflict?
11.11 Further Reading
- Bain (1956): the classic statement of entry barriers and the foundation of the industrial-organization approach to strategy.
- Rumelt (1991) and McGahan and Porter (1997): the central exchange in the “how much does industry matter?” debate. Read them together.
- M.-J. Chen (1996): an integrative theory of competitor analysis that introduced market commonality, resource similarity, and competitor asymmetry.
- Brandenburger and Nalebuff (1996): an accessible translation of game theory into managerial strategy, built around the value net and the idea of changing the game.
- Lieberman and Montgomery (1988) and Golder and Tellis (1993): the theoretical case for first-mover advantages and the most influential methodological critique of the evidence.
- McGrath (1999) and Adner and Levinthal (2004): the case for real options reasoning in entrepreneurship and a careful statement of its boundaries.
- Cyert and March (1963) and Gavetti et al. (2012): the founding text of the behavioral theory of the firm and a modern assessment of its legacy and prospects.
- Ocasio (1997): the original statement of the attention-based view, with a framework that remains the starting point for research on organizational attention.