3 Using Theory in Research and Practice
A subscription software company discovers that customers who use its collaboration feature in their first month are far less likely to cancel. The growth team proposes a simple plan: push every new customer into the feature. A data scientist asks a different question: why would the feature reduce churn? If it creates switching costs (shared files are painful to move), forcing adoption should help. If it merely reveals customers who were already committed (teams that collaborate were always going to stay), forcing adoption will do little. If it works by connecting users to colleagues who keep them engaged, it should help only in accounts with several active users. Three theories, three predictions, three different experiments. The company’s choice of what to test, whom to test it on, and what to measure is a theoretical choice, whether or not anyone calls it one.
Chapter 2 asked what theory is. This chapter asks what researchers and managers do with it. We trace the path from a theory to a testable hypothesis, explain how constructs earn their meaning in a nomological network, set out the logic of mediation and moderation, discuss how to choose among competing theories, distinguish types of theoretical contribution and modes of reasoning, show how causal diagrams make a theory’s assumptions explicit, and confront the replication crisis and what it implies for credible research. We close with theory in managerial practice, from A/B tests to evidence-based management (Table 3.1).
| Task | Core question | Key tools | Key sources |
|---|---|---|---|
| From theory to hypotheses | How does an abstract argument become a falsifiable prediction? | Hypothesis-development paragraph, propositions vs. hypotheses | Bacharach (1989), Whetten (1989) |
| Construct validity | Does a measure capture the construct the theory names? | Nomological network, convergent and discriminant validity | Cronbach & Meehl (1955), Campbell & Fiske (1959) |
| Mediation and moderation | Through what process, and under what conditions? | Indirect effects, interactions, conditional process models | Baron & Kenny (1986), Zhao et al. (2010), Hayes (2018) |
| Choosing among theories | Which explanation survives a head-to-head test? | Strong inference, competing predictions | Platt (1964) |
| Theoretical contribution | Does the work build theory, test it, or both? | Contribution taxonomy, deduction, induction, abduction | Colquitt & Zapata-Phelan (2007) |
| Causal identification | Which variables must be controlled, and which must not? | Directed acyclic graphs, back-door criterion | Pearl (2009) |
| Research integrity | Why do findings fail to replicate, and what helps? | Preregistration, power, transparency | Open Science Collaboration (2015), Simmons et al. (2011) |
3.1 From Theory to Hypotheses
Theory and evidence meet at the hypothesis. As Chapter 2 explained, a proposition relates constructs and a hypothesis relates measured variables (Bacharach 1989). Moving from one to the other is a chain of translations, from the general theory to a proposition about the focal context, from constructs to variables, from variables to a research design, and each link can fail. Figure 3.1 shows the chain and the feedback loop by which evidence returns to revise the theory.
Figure 3.1: The ladder from theory to evidence. Each step translates the previous one into a more concrete claim. Evidence feeds back to the theory, strengthening, bounding, or revising it.
Definition 3.1 Hypothesis. A conjectural statement of the relationship between two or more measured variables, derived from theory, stated precisely enough that a specified pattern of data would contradict it. A good hypothesis names the direction (and ideally the form) of the relationship, the population to which it applies, and, where the theory implies one, the condition under which it should weaken or reverse.
3.1.1 Anatomy of a hypothesis-development paragraph
In most empirical articles, each hypothesis is preceded by a paragraph (or several) that justifies it. Reviewers read these paragraphs for one thing above all: the why. A strong paragraph contains five moves, summarized in Table 3.2.
| Move | Purpose | Typical phrasing | Common failure |
|---|---|---|---|
|
Locate the hypothesis in a concrete setting with a real tension | In enterprise software markets, buyers cannot directly observe … | Starting from the literature rather than the phenomenon |
|
State the general principle being applied | Signaling theory holds that … | Name-checking a theory without stating its logic |
|
Explain step by step why X should affect Y here | Because …, buyers infer …, which reduces … | Replacing mechanism with citations of prior findings |
|
Acknowledge when the mechanism should weaken or what else could explain the link | This logic should be strongest when … | Presenting the link as universal |
|
State a falsifiable, directional prediction about variables | H1: Start-ups with an independent security certification will … | Vague verbs (affects, is related to) with no direction or population |
3.1.2 A worked example: signaling in enterprise software
Consider a study of whether young business-to-business software firms win more enterprise contracts when they obtain an independent security audit report (for example, a SOC 2 report). The relevant theory is signaling theory (Section 8.2): an informed party can credibly reveal hidden quality through a costly action that low-quality types find too expensive to imitate (Spence 1973, Connelly et al. 2011).
Before (weak).
Signaling theory suggests that firms send signals to stakeholders (Connelly et al. 2011). Prior research has found that certifications have positive effects on firm outcomes. Security is important to enterprise customers. Therefore, certification should be related to sales.
H1: Security certification is positively related to firm performance.
The paragraph cites a theory but never uses it. It does not say what is hidden, from whom, why the certification is credible, or when its effect should be largest. “Firm performance” is not the construct the argument implies, and the hypothesis cannot fail in an informative way: almost any positive correlation would be read as support, even one produced by larger firms both certifying and selling more.
After (strong).
Enterprise buyers evaluating a young software vendor face acute information asymmetry about its security practices: weaknesses become visible only after a breach, when the buyer bears much of the cost. Signaling theory implies that vendors can reduce this asymmetry through actions whose cost is lower for high-quality types (Spence 1973, Connelly et al. 2011). An independent security audit is such an action. Passing it requires controls that a vendor with weak practices would have to build at substantial expense, and an auditor’s reputation is at stake if it attests falsely. Buyers can therefore infer that certified vendors are more likely to have sound security, lowering perceived risk and shortening procurement reviews. Because the signal’s value lies in closing an information gap, its effect should be strongest when buyers have little other information about the vendor, that is, for vendors with short track records, and weaker for established vendors whose reputation already conveys similar information (Bergh et al. 2014).
H1: Among business-to-business software start-ups, obtaining an independent security audit report will increase the rate at which enterprise sales opportunities convert into signed contracts.
H2: The positive effect in H1 will be weaker for vendors with longer operating track records.
The revised version names the hidden attribute, explains the differential cost that makes the signal credible, specifies the receiver’s inference, links the mechanism to a measurable outcome (opportunity-to-contract conversion), states a theoretically derived boundary condition, and produces a hypothesis pair that could fail in a specific way. It also suggests the right test: the theory implies a causal effect, so the design must address the possibility that better-run start-ups both certify and sell more, for example, by exploiting variation in the timing of certification within firms or buyer-side requirements that change exogenously. H2 is a moderation hypothesis. The remainder of this chapter shows how such hypotheses are modelled.
3.1.3 Direction, form, and magnitude
Most hypotheses in business research predict only a direction (“positively related”). Theories often imply more. Some imply a functional form: diminishing returns to advertising, a threshold beyond which a signal stops separating types, or an inverted U in which moderate levels of a variable are optimal. Testing such claims requires more than a significant squared term. Haans, Pieters, and He (2016) show that an inverted-U hypothesis should be supported by evidence that the slope is significantly positive at the low end of the observed range and significantly negative at the high end, and that the turning point lies within that range. Otherwise the data may simply reflect a monotonic relationship with diminishing returns. Theories can also imply magnitudes: for instance, that an effect should be larger in one condition than another by a meaningful amount, or that an effect too small to matter economically would count against the theory even if statistically significant.
Specifying form and magnitude makes a hypothesis riskier and therefore more informative. A directional prediction that any positive coefficient confirms is a weak test, because many rival theories predict the same sign. A prediction about shape, threshold, or relative size exposes the theory to genuine refutation, in the spirit of the falsifiability criterion discussed in Chapter 2.
Theory as decoration. A theory that is cited in the introduction but plays no role in deriving hypotheses, choosing measures, or interpreting results is decoration. A simple diagnostic: delete the theory’s name from the paper. If no hypothesis, design choice, or interpretation changes, the theory was not doing any work. The remedy is not more citations but a sharper statement of the mechanism and of the observations that would contradict it.
3.2 Constructs, Measures, and Nomological Networks
A hypothesis is only as good as the measures that test it. If “brand trust” is measured with items that really capture brand familiarity, a test of trust theory is a test of something else. The idea that measures acquire meaning through their place in a theory is one of the most important contributions of psychometrics to social science.
Core claim. A construct’s meaning is given by the network of lawful relationships, its nomological network, that link it to other constructs and to observable measures. A measure is valid to the extent that it behaves as that network predicts.
Origins. Psychometrics. Cronbach and Meehl (1955), extended by the multitrait-multimethod logic of D. T. Campbell and Fiske (1959).
Level of analysis. Constructs and measures at any level (individual, team, firm, market).
Key constructs. Construct validity, nomological network, convergent validity, discriminant validity, content validity, criterion validity.
Boundary conditions. Requires a theory rich enough to generate predictions about a construct’s relationships. Weakly theorized constructs cannot be validated this way.
Related theories. Construct clarity (Suddaby 2010), measurement and validation procedures (MacKenzie, Podsakoff, and Podsakoff 2011).
Cronbach and Meehl (1955) argued that when a construct cannot be defined by a single criterion, validation is necessarily theoretical: the researcher predicts how the measure should relate to other measures and tests those predictions. Construct validation and theory testing are therefore intertwined: a failed prediction may indicate a poor measure, a wrong theory, or both. D. T. Campbell and Fiske (1959) operationalized part of this logic in the multitrait-multimethod matrix: measures of the same construct obtained by different methods should converge (convergent validity), and measures of different constructs should be distinguishable even when obtained by the same method (discriminant validity). Contemporary procedures for developing and validating scales, including the choice between reflective and formative measurement models, are reviewed by MacKenzie, Podsakoff, and Podsakoff (2011).
The Net Promoter Score as a construct-validity problem. Reichheld (2003) proposed that a single question, how likely a customer is to recommend a company to a friend or colleague, captures customer loyalty well enough to predict company growth. The claim is, in effect, a nomological-network prediction: if the measure captures loyalty, it should predict growth at least as well as alternative loyalty and satisfaction measures. Keiningham et al. (2007) examined this prediction with longitudinal data from multiple industries and did not find that the Net Promoter metric outperformed the American Customer Satisfaction Index in predicting revenue growth. The lesson is not that a recommendation question is useless, but that a metric’s managerial authority should rest on evidence about how it behaves in its nomological network, not on its simplicity.
3.3 Mediation and Moderation
Mediation and moderation are the two most common ways of putting Whetten’s why and who/where/when into a statistical model (Whetten 1989). A mediator answers how or why X affects Y: it is the mechanism through which the effect travels. A moderator answers when or for whom: it changes the strength or direction of the X-Y relationship. R. M. Baron and Kenny (1986) drew the distinction sharply in a paper that became one of the most cited in the social sciences (Table 3.3).
| Feature | Mediation | Moderation |
|---|---|---|
| Theoretical question | How or why does X affect Y? | When, for whom, or under what conditions does X affect Y? |
| Whetten element | Why (mechanism) | Who / where / when (boundary condition) |
| Causal structure | X -> M -> Y | W changes the X -> Y relationship |
| Typical statistical test | Indirect effect a x b with bootstrap confidence interval | Interaction term X x W, simple slopes, Johnson-Neyman region |
| Signaling example | Certification -> perceived risk -> contract signed | Certification effect weaker for vendors with long track records |
| Key threat | Confounding of the M -> Y path, even when X is randomized | Low power to detect interactions, arbitrary spotlight values |
| Key sources | Baron & Kenny (1986), Zhao et al. (2010) | Aiken & West (1991), Spiller et al. (2013) |
3.3.1 Moderation: boundary conditions in data
Moderation is tested by including the product of the focal predictor and the moderator in a regression (Aiken and West 1991). Because the coefficient on the product term is rarely meaningful on its own, researchers probe the interaction by estimating simple effects: the effect of X at particular values of the moderator. Spiller et al. (2013) distinguish spotlight analysis, which tests simple effects at chosen values (such as one standard deviation above and below the mean), from floodlight analysis, which reports the full range of moderator values over which the simple effect is statistically significant (the Johnson-Neyman region). Floodlight analysis avoids arbitrary spotlight choices and is especially useful when the moderator has meaningful units, such as years of operation.
Figure 3.2 applies this logic to hypothesis H2 from the worked example, using simulated data.
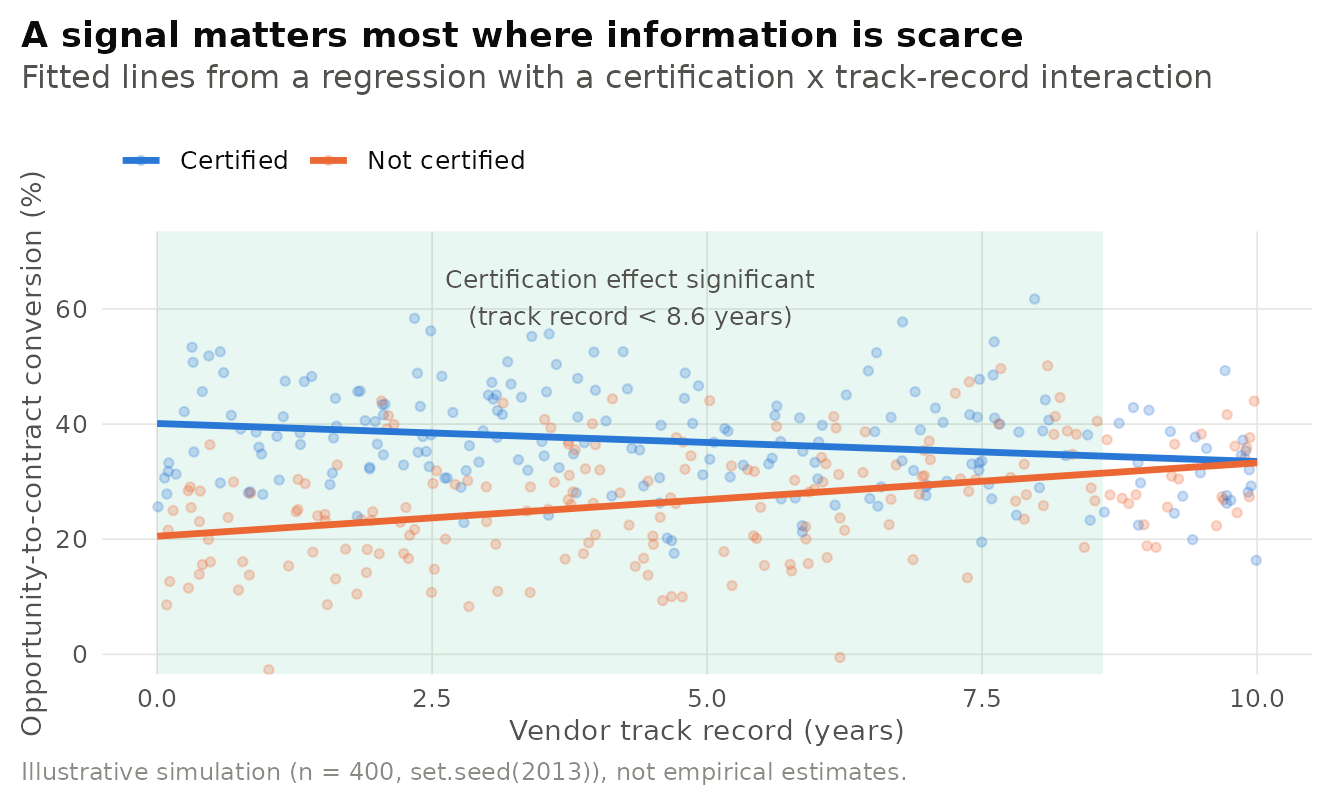
Figure 3.2: Illustrative moderation (floodlight) analysis of the worked example. The effect of a security certification on contract conversion is large for young vendors and shrinks with track record. The shaded region marks track-record values for which the simple effect is significant at the 5 percent level (Johnson-Neyman region). Simulated data.
3.3.2 Mediation: testing the mechanism
R. M. Baron and Kenny (1986) proposed a sequence of conditions for mediation: X must predict Y, X must predict M, M must predict Y controlling for X, and the X-Y relationship must shrink when M is controlled. Later work showed that several of these steps are neither necessary nor sufficient. X. Zhao, Lynch, and Chen (2010) argue that the single requirement for establishing mediation is a significant indirect effect, the product of the X → M path (a) and the M → Y path (b), best tested with a bootstrap confidence interval rather than with the causal-steps procedure or the Sobel test. A significant total effect of X on Y is not required: an indirect effect can exist even when opposing mechanisms cancel out in the total effect. Hayes (2018) provides the standard regression-based treatment, including conditional process models that combine mediation and moderation (Table 3.4).
| Pattern | Indirect effect (a x b) | Direct effect (c’) | Interpretation |
|---|---|---|---|
| Complementary mediation | Significant | Significant, same sign as a x b | The hypothesized mediator is one of several mechanisms. Others may be omitted |
| Competitive mediation | Significant | Significant, opposite sign | An omitted mediator likely works in the opposite direction |
| Indirect-only mediation | Significant | Not significant | Consistent with the hypothesized mediator, omitted mediators less likely |
| Direct-only non-mediation | Not significant | Significant | The hypothesized mediator is not the mechanism. Look for another |
| No-effect non-mediation | Not significant | Not significant | Neither effect detected, theory or design may be flawed |
Figure 3.3 shows how a bootstrap test works in a simulated loyalty-programme study, where enrolment is hypothesized to raise spending by increasing customers’ perceived switching costs.
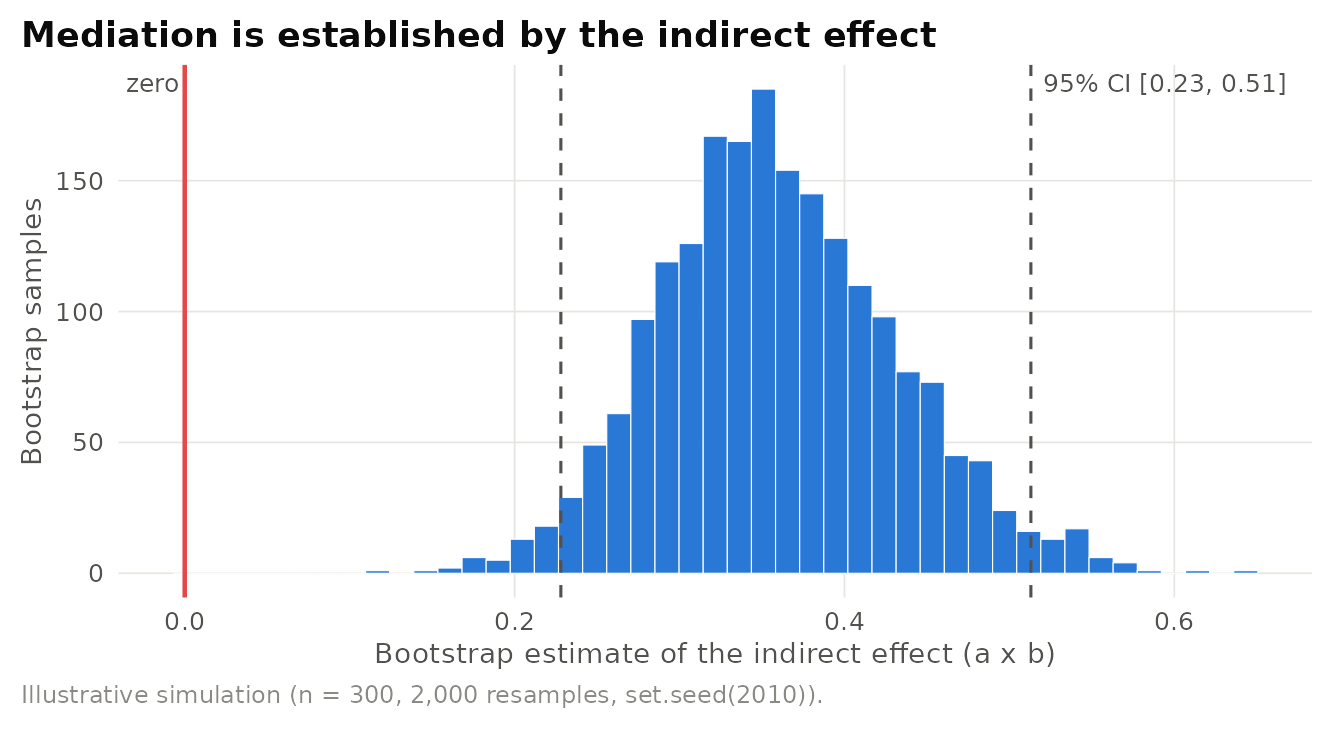
Figure 3.3: Illustrative bootstrap test of an indirect effect. Enrolment in a loyalty programme (randomized) raises perceived switching costs, which raise annual spending. The histogram shows 2,000 bootstrap estimates of the indirect effect a x b. Dashed lines mark the 95 percent percentile interval, which excludes zero. Simulated data.
Mediation and moderation are often combined. In a moderated mediation model, a moderator changes the strength of one path in the causal chain, so the size of the indirect effect depends on the moderator (Preacher, Rucker, and Hayes 2007, Hayes 2018). Figure 3.4 shows the full theoretical model for the worked example: certification works by reducing buyers’ perceived risk, and this first stage of the mechanism is weaker for vendors with long track records.
Figure 3.4: A first-stage moderated mediation model for the worked example. Track record moderates the effect of certification on perceived risk, so the indirect effect of certification on contract signing is conditional on track record (Preacher et al., 2007, Hayes, 2018).
Can statistical mediation reveal causal mechanisms? Even when X is randomly assigned, the mediator is not, so the M → Y path is vulnerable to confounding by unmeasured variables that affect both M and Y. Bullock, Green, and Ha (2010) argue that standard mediation analyses therefore rest on strong and often implausible assumptions, and that convincing evidence about mechanisms usually requires experiments that manipulate the mediator as well. Spencer, Zanna, and Fong (2005) propose an experimental-causal-chain design: one experiment shows that X changes M, and a second manipulates M directly to show that it changes Y. Defenders of regression mediation respond that it remains valuable for probing theoretically specified processes, provided its causal assumptions are stated and sensitivity analyses are reported. The practical consensus is to treat cross-sectional mediation as consistent with a mechanism, not as proof of one.
Illustrative scenario: why does the loyalty programme work? A retailer finds that its points programme raises spending among enrolled members. Two mechanisms are plausible. Under an economic account, points create switching costs that lock customers in. Under a psychological account, tier status (silver, gold, platinum) provides recognition that customers value for its own sake. The accounts imply different designs: if switching costs drive the effect, raising the cash value of points should matter. If status drives it, making tiers more visible should matter even with unchanged point values. A sequence of randomized tests, manipulating point value in some markets and tier visibility in others, would identify which mechanism dominates far more convincingly than a survey-based mediation model, and would tell the retailer where to invest.
Specifying mediation and moderation hypotheses.
- State the mechanism in words first, then map each step to a path (a, b, c’).
- Derive moderators from the mechanism: ask which conditions would strengthen or disable each step, and which path (first or second stage) the moderator acts on.
- Choose designs that match the claim: randomize X where possible. Consider manipulating M in a follow-up study. Use longitudinal data so that M is measured between X and Y.
- Report indirect effects with bootstrap intervals, simple effects across the moderator’s range (floodlight), and the index of moderated mediation where relevant (Hayes 2018).
- Plan power for interactions: detecting an attenuation typically requires much larger samples than detecting a main effect.
3.4 Choosing Among Theories
Most business phenomena can be approached through more than one theory. Executive compensation can be studied through agency theory (Section 6.1), tournament theory (Section 15.13), or social comparison. A firm’s decision to outsource through transaction cost economics (Section 6.3) or capability-based reasoning. Choosing well requires matching the theory to the research question, its phenomenon, level of analysis, and the type of explanation sought, and, where theories compete, designing tests that can tell them apart.
3.4.1 Matching theory to question
Table 3.5 offers a starting point for common business research questions, organized by the chapters of this book. It is a heuristic, not an algorithm: the best study often combines two theories, using one to explain the main effect and another to explain its boundary conditions.
| Research question | Candidate theory families | Level | Where in this book |
|---|---|---|---|
| Why do some firms earn persistently superior returns? | Resource-based theory, VRIO, dynamic capabilities | Firm | Ch. 4-5 |
| Should the firm make, buy, or ally? | Transaction cost economics, resource-based and knowledge-based views | Transaction, firm | Ch. 4, 6 |
| How should owners monitor and pay executives? | Agency theory, stewardship theory, upper echelons | Dyad, top team | Ch. 6 |
| Why do organizations adopt similar practices? | Institutional theory, legitimacy, resource dependence | Organization, field | Ch. 7 |
| How can a firm credibly convey hidden quality? | Signaling, screening, costly signaling | Dyad, market | Ch. 8 |
| How do relationships and network positions create value? | Social exchange, structural holes, social capital | Dyad, network | Ch. 9 |
| Why, and how fast, do new products spread? | Diffusion of innovations, Bass model, technology acceptance | Individual, market | Ch. 10 |
| How does national culture shape management practice? | Hofstede’s dimensions, GLOBE, tight-loose | Society | Ch. 11 |
| What drives effort and persistence at work? | Expectancy, goal setting, self-determination | Individual | Ch. 12 |
| Why does framing as gains or losses change choices? | Prospect theory, regulatory focus | Individual | Ch. 13, 15 |
| Why do people follow, or avoid, the choices of others? | Social comparison, social identity, optimal distinctiveness | Individual in groups | Ch. 14 |
| How do messages change attitudes and behaviour? | Elaboration likelihood, persuasion knowledge | Individual, audience | Ch. 17 |
For quick navigation, the core sections are: Resource-based theory (Section 4.1), Dynamic capabilities (Section 5.1), Transaction cost economics (Section 6.3), Agency theory (Section 6.1), Stewardship theory (Section 6.2), Upper echelons theory (Section 6.4), Institutional theory (Section 7.2), Resource dependence theory (Section 7.1), Signaling theory (Section 8.2), Screening theory (Section 8.3), Social exchange theory (Section 9.1), Structural holes (Section 9.4), Diffusion of innovations (Section 10.1), Technology acceptance model (Section 10.4), Hofstede’s dimensions (Section 18.2), Expectancy theory (Section 19.2), Goal-setting theory (Section 19.4), Self-determination theory (Section 19.6), Regulatory focus theory (Section 20.1), Prospect theory (Chapter 24), Social identity theory (Section 22.2), Optimal distinctiveness theory (Section 22.3), and the Elaboration likelihood model (Section 26.1).
Three further questions help narrow the choice. First, does the theory’s level match the outcome? A theory of individual motivation will not, on its own, explain differences in firm profitability (see the discussion of levels in Chapter 2). Second, do the theory’s assumptions fit the setting? Agency theory’s assumption of goal conflict may fit a widely held public firm better than a founder-led family business. Third, what kind of contribution is sought? If the aim is to test a theory’s boundary, the chosen theory should be one whose boundary is genuinely in doubt.
3.4.2 Strong inference and competing-theory tests
In an influential essay, J. R. Platt (1964) argued that some fields progress faster than others because they systematically practise strong inference: (1) devise alternative hypotheses. (2) Devise a crucial experiment (or several) whose possible outcomes will exclude one or more of the hypotheses. (3) Carry out the experiment so as to get a clean result, and (4) recycle the procedure, refining the hypotheses that remain. Platt’s examples came from molecular biology and high-energy physics, but the logic applies wherever theories make divergent predictions.
The key is to find conditions under which theories disagree. Two theories that both predict a positive main effect cannot be distinguished by observing a positive main effect. They can be distinguished if they predict different moderators, mediators, or functional forms. Table 3.6 gives examples from business research.
| Question | Theory A | Theory B | Discriminating test |
|---|---|---|---|
| Does CEO duality help or hurt shareholders? | Agency: combining CEO and chair weakens monitoring (negative) | Stewardship: unified leadership empowers a pro-organizational CEO (positive) | Direction of the duality effect. Moderation by ownership structure (Donaldson & Davis, 1991) |
| Why do firms vertically integrate? | Transaction costs: integrate when assets are specific and opportunism is likely | Capabilities: integrate when the firm is better at the activity | Do asset specificity and capability gaps predict integration independently? |
| Why do degrees raise wages? | Human capital: education raises productivity | Signaling: education reveals pre-existing ability | Sheepskin effects: wage jumps at degree completion beyond years of schooling |
| Why does the loyalty programme raise spending? | Switching costs (economic) | Status and recognition (psychological) | Manipulate point value vs. tier visibility, examine behaviour near tier thresholds |
Confirming a theory that had no rival. Many studies “support” a theory by finding a relationship that several other theories also predict. Before collecting data, list at least two alternative explanations for the expected result and ask what observation would favour your theory over each. If no observation would, the study can describe a relationship but cannot adjudicate among explanations, and should not claim to.
3.5 Theoretical Contribution and Modes of Reasoning
3.5.1 Building versus testing theory
Empirical work can contribute to theory in two broad ways: by testing existing theory, deriving hypotheses from established arguments and confronting them with data, and by building theory, introducing new constructs, relationships, or mechanisms. Colquitt and Zapata-Phelan (2007) rated five decades of empirical articles in the Academy of Management Journal on both dimensions and derived a five-category taxonomy, sketched in Figure 3.5. Reporters do little of either, testers rigorously test existing theory. Builders introduce new constructs or relationships with limited grounding in existing theory. Expanders do both, testing existing theory while introducing new elements, and qualifiers occupy the middle ground, testing and extending theory moderately.
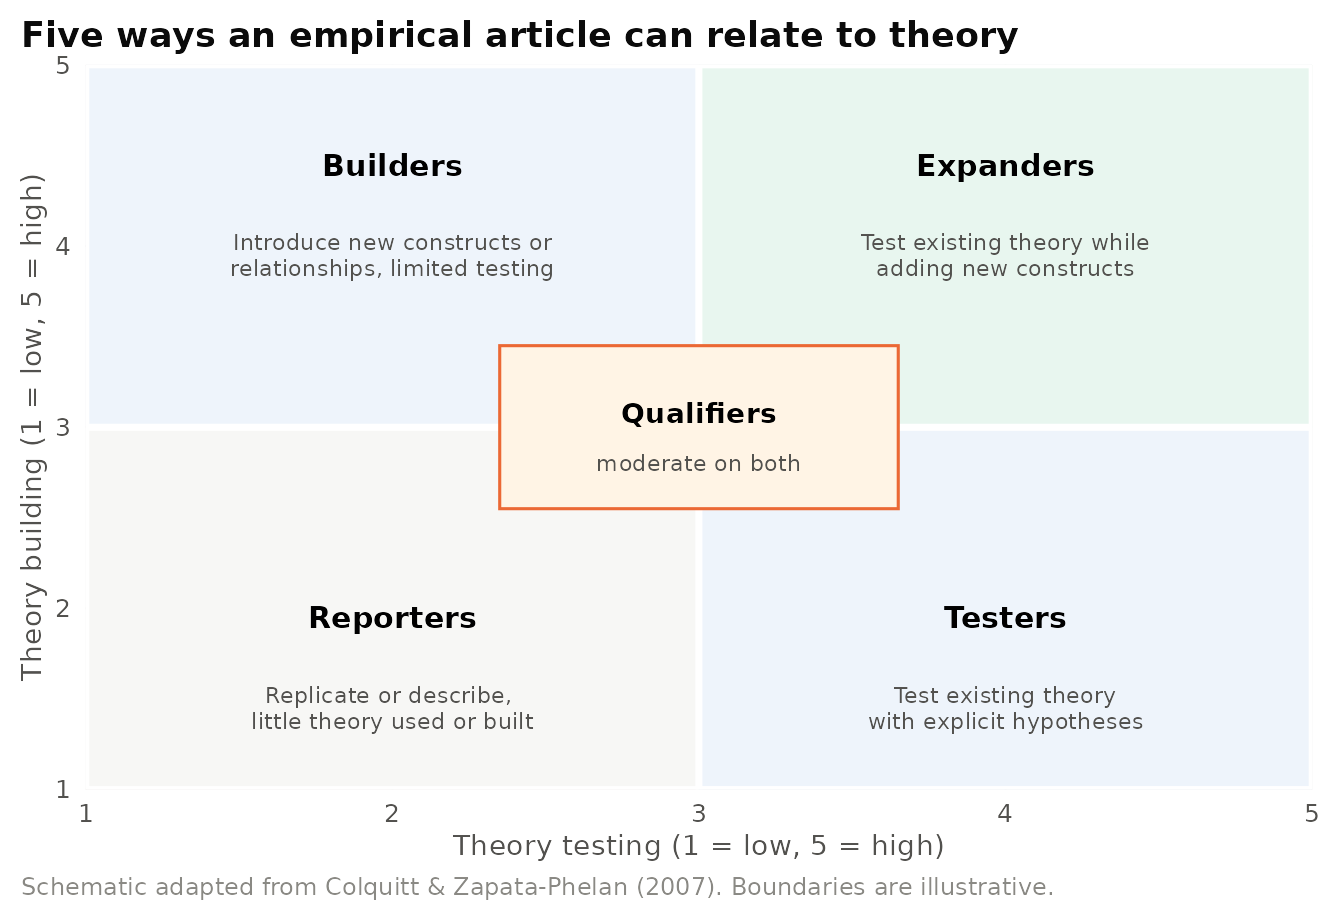
Figure 3.5: A schematic of the theory-building by theory-testing taxonomy of empirical articles proposed by Colquitt and Zapata-Phelan (2007). Each dimension is rated on a five-point scale. Region boundaries here are drawn schematically for illustration.
Neither building nor testing is intrinsically superior. A field with only builders accumulates untested constructs. A field with only testers stops generating new ideas. Whetten’s checklist of questions reviewers ask about a contribution remains a useful self-assessment tool (Table 3.7).
| Question | What the reviewer is asking | How to answer it |
|---|---|---|
| What’s new? | Does the work add something significant to current thinking? | State precisely which construct, relationship, mechanism, or boundary changes |
| So what? | Will the contribution change how scholars (or managers) think or act? | Show which prior conclusions or practices must be revised |
| Why so? | Is the underlying logic sound and convincing? | Make the mechanism explicit and address rival explanations |
| Well done? | Is the work thorough and does it reflect careful thinking? | Match design to claim, report robustness and limitations |
| Done well? | Is it clearly written and logically organized? | One idea per paragraph, consistent construct labels |
| Why now? | Is the topic of contemporary interest? | Link to a current phenomenon, debate, or gap |
| Who cares? | What share of the audience will find it relevant? | Identify the scholarly conversation and practitioners affected |
3.5.2 Deduction, induction, and abduction
Behind the build-test distinction lie three modes of reasoning. Deduction derives specific predictions from general premises. It is the logic of hypothesis testing. Induction generalizes from observed cases to broader patterns. It is the logic of grounded theory (Glaser and Strauss 1967) and of case-based theory building (Eisenhardt 1989b). Abduction reasons from a surprising observation to the explanation that would, if true, make it unsurprising. It is the logic of anomaly-driven discovery. Timmermans and Tavory (2012) argue that abductive analysis, the iterative confrontation of surprising data with multiple existing theories, is a more accurate description of how qualitative researchers actually build theory than pure induction (Table 3.8).
| Mode | Starting point | Output | Typical designs | Main risk |
|---|---|---|---|---|
| Deduction | General theory | Testable hypotheses, support or refutation | Experiments, surveys, archival regressions | Testing only what the theory already says. Confirmation bias |
| Induction | Systematic observation of cases | New concepts and generalizations | Grounded theory, multiple-case studies | Generalizing from idiosyncratic cases |
| Abduction | A surprising fact or anomaly | The most plausible new explanation | Iterative qualitative analysis, exploratory data analysis followed by tests | Mistaking a plausible story for a tested one |
The modes are complementary stages of a cycle rather than rival philosophies: an anomaly prompts an abductive conjecture, case evidence refines it inductively, and a deductive test confronts it with new data. A. C. Edmondson and McManus (2007) add that the appropriate method depends on the state of prior theory. Where theory is nascent, open-ended qualitative data help identify constructs. Where it is intermediate, hybrid designs combine qualitative insight with preliminary measures, and where it is mature, precise quantitative tests of well-specified hypotheses are appropriate. Mismatches, such as a hypothesis-testing survey on a phenomenon nobody yet understands, weaken contribution.
Take a surprising business fact you have encountered (for example, a product that sells more after a price increase). Write one abductive explanation, identify two existing theories that could account for it (see Table 3.5), and specify one observation that would distinguish between them. You have just designed a strong-inference study.
3.6 Causal Diagrams as Explicit Theory
Most theories in business research make causal claims, yet most data are observational. Bridging the gap requires assumptions about which variables cause which. Directed acyclic graphs (DAGs) make those assumptions explicit (Pearl 2009). A DAG is a diagram in which nodes are variables and arrows are direct causal effects, with no feedback loops. Drawing one forces the researcher to state the theory in a form from which the correct analysis can be derived.
Three structures matter most. A confounder causes both treatment and outcome and must be controlled to block a non-causal “back-door” path. A mediator lies on the causal path from treatment to outcome. Controlling for it removes part of the effect one may be trying to estimate. A collider is caused by both treatment and outcome (or their causes). Controlling for it, or selecting the sample on it, opens a spurious path and creates bias where none existed (Elwert and Winship 2014). Pearl’s back-door criterion formalizes which sets of control variables suffice to identify a causal effect given the diagram (Pearl 2009) (Figure 3.6).
Figure 3.6: A causal diagram (DAG) for evaluating a sales-training programme. Representative experience is a confounder (control for it). Pitch quality is a mediator (do not control if the total effect is of interest). Being retained in the sample is a collider (do not condition on it). Illustrative example.
Table 3.9 presents the role of a variable in the causal diagram determines whether to control for it.
| Variable role | Causal structure | Control for it? | Business example |
|---|---|---|---|
| Confounder | C -> X and C -> Y | Yes (blocks a back-door path) | Experienced reps both choose training and sell more |
| Mediator | X -> M -> Y | No, if the total effect is the target. Yes for a direct effect, with care | Training improves pitches, which raise revenue |
| Collider | X -> K <- Y | No (conditioning opens a spurious path) | Analysing only reps still employed, when retention depends on both training and sales |
| Outcome proxy / descendant of Y | Y -> Z | No | Controlling for commission earned when estimating revenue effects |
| Instrument | Z -> X only | Not as a control, can be used for IV estimation | Random assignment of training slots by calendar availability |
Survivorship as collider bias. Studies of “what successful start-ups have in common” sample on success, a collider influenced by many causes at once. Among surviving firms, two causes of survival can appear negatively related even if they are independent in the full population: for instance, founder experience and market timing, if either one alone is often enough to survive. Strategy advice drawn from such samples can therefore recommend the wrong trade-offs. The remedy is theoretical before it is statistical: draw the diagram, identify selection as a node, and either study the full population at risk (including failures) or model selection explicitly (Elwert and Winship 2014).
Kitchen-sink controls. Adding every available variable as a control is often defended as conservative. It is not. Controlling for mediators removes part of the effect of interest. Controlling for colliders introduces bias. Every control variable should be justified by its role in a causal diagram, and the diagram should be reported. Antonakis et al. (2010) review the most common threats to causal claims in management research and the designs that address them. Shadish, Cook, and Campbell (2002) remains the standard reference on experimental and quasi-experimental design.
3.7 The Replication Crisis and Research Integrity
Theories can only be as credible as the evidence used to test them. During the 2010s, a series of large-scale replication projects and methodological critiques forced the social sciences to confront the possibility that much published evidence was weaker than it appeared.
3.7.1 What the replication projects found
The most influential project, the Open Science Collaboration’s attempt to reproduce 100 experimental and correlational studies published in three psychology journals, found that 97 percent of the original studies had reported statistically significant results but only 36 percent of the replications did. On average, replication effect sizes were about half as large as the original estimates (Open Science Collaboration 2015). Depending on the criterion used, statistical significance, whether the original effect fell within the replication’s confidence interval, or subjective assessments by the replication teams, estimates of how many findings replicated ranged from roughly one-third to just under one-half. A later project replicating 21 social-science experiments published in Nature and Science between 2010 and 2015 likewise found that replication effects were systematically smaller than original effects (C. F. Camerer et al. 2018).
Is there a replication crisis? Gilbert et al. (2016) argued that the Open Science Collaboration’s design underestimated reproducibility: some replications departed from the original procedures or populations, and the statistical benchmark did not account for sampling error in the replications themselves. The original authors replied that these objections did not overturn their main conclusions. Most observers now agree on a narrower point that matters for theory: a single statistically significant result, especially from a small study with flexible analyses, is weak evidence, and effect sizes reported in the literature are likely inflated by selective publication. The debate has shifted from whether there is a problem to which reforms address it best (Munafò et al. 2017).
3.7.2 Why false positives proliferate
Ioannidis (2005) argued on probabilistic grounds that in fields where true effects are rare, studies are small, effects are modest, designs and analyses are flexible, and competition is intense, most claimed findings are more likely to be false than true. The argument turns on the pre-study odds that a tested hypothesis is true: when most hypotheses tested are false, even a nominal 5 percent false-positive rate can produce a literature in which a large share of significant findings are errors.
Simmons, Nelson, and Simonsohn (2011) showed how undisclosed researcher degrees of freedom, choices about which dependent variables to report, when to stop collecting data, which covariates to include, and which conditions to compare, can push the actual false-positive rate far above 5 percent even when each choice seems reasonable in isolation. Gelman and Loken (2014) emphasize that the problem does not require deliberate fishing: a garden of forking paths arises whenever analytic choices are contingent on the data, even if only one analysis is ever run. Figure 3.7 reproduces the logic with a simple simulation in which there is no true effect.
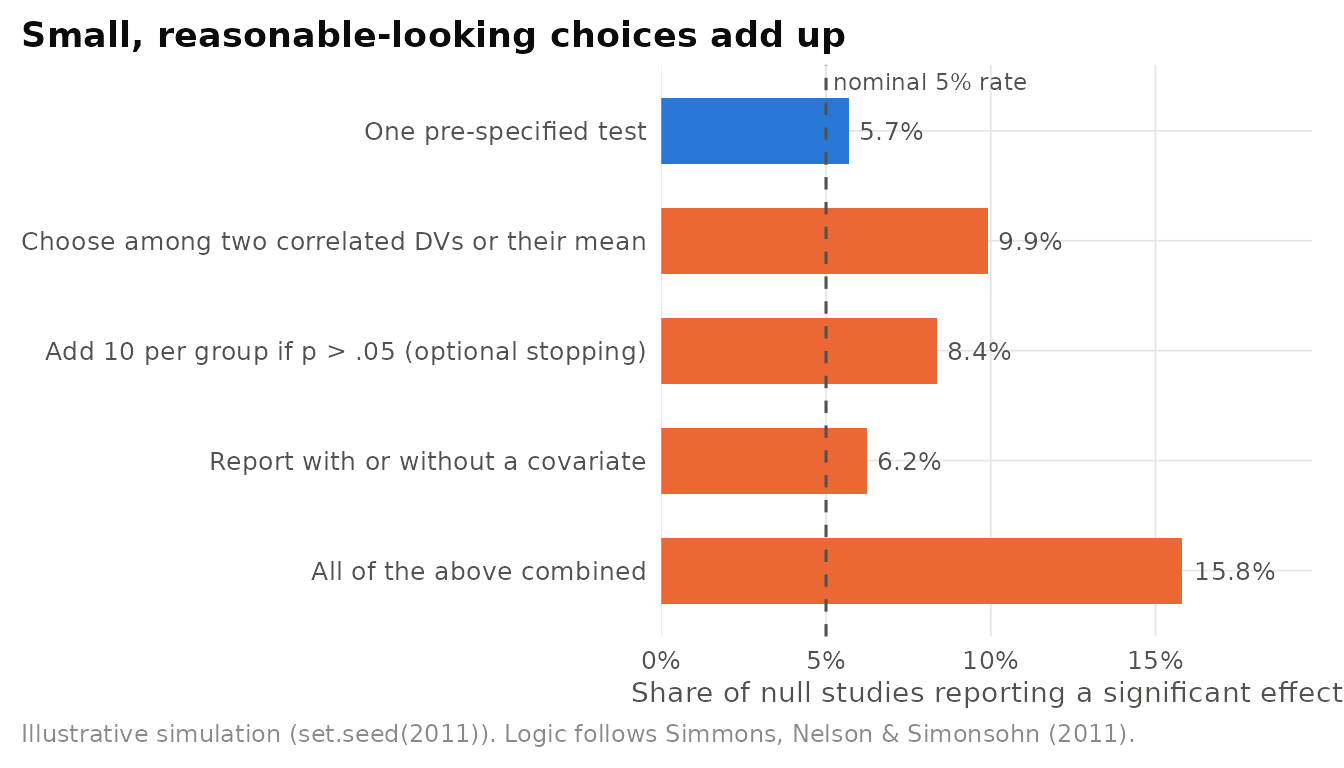
Figure 3.7: Illustrative simulation of how analytic flexibility inflates false positives. Every simulated study compares two groups (20 per group) with no true difference. Each bar shows the share of studies that report p < .05 when the researcher may choose among the listed options and reports any significant result. Simulated data. 4,000 Studies per strategy.
Two further practices compound the problem. HARKing, hypothesizing after the results are known, presents post hoc hypotheses as if they had been specified in advance, converting exploratory findings into apparently confirmatory tests (N. L. Kerr 1998). Survey evidence suggests that such questionable research practices were not rare: in a large survey of academic psychologists, substantial proportions admitted to practices such as failing to report all dependent measures or deciding whether to collect more data after looking at results (John, Loewenstein, and Prelec 2012) (Table 3.10).
| Practice | Why it inflates false positives | Remedy |
|---|---|---|
| Selective reporting of outcomes | Multiple chances to find p < .05. Only winners reported | Preregister primary outcomes, report all measures |
| Optional stopping | Repeated testing as data accrue raises the error rate | Fix sample size in advance or use sequential designs with corrected thresholds |
| Flexible covariates and exclusions | Choices contingent on results create forking paths | Prespecify. Report results with and without covariates and exclusions |
| HARKing | Exploratory findings presented as confirmatory tests | Label exploratory analyses, preregister confirmatory hypotheses |
| Underpowered studies | Significant results overestimate effects, low pre-study odds | Power analysis, larger samples, multi-site collaboration |
| Publication bias | Null results remain unpublished, distorting the literature | Registered reports, publishing replications and null results |
| Misreading p-values | Treating p < .05 as proof or p > .05 as proof of no effect | Report effect sizes and intervals, interpret in context |
3.7.3 Reforms: preregistration and transparency
The most widely adopted reform is preregistration: recording hypotheses, designs, and analysis plans in a time-stamped public registry before observing the data. Nosek et al. (2018) argue that its value lies in distinguishing prediction (testing hypotheses fixed in advance) from postdiction (generating hypotheses from data). Both are legitimate, but only the former supports the inferential claims that p-values imply. Registered reports, in which journals review and accept a study’s design before results are known, address publication bias directly. Complementary reforms include data and code sharing, larger and multi-site samples, and more careful statistical reporting. The American Statistical Association’s statement on p-values emphasizes that a p-value does not measure the probability that a hypothesis is true or the size of an effect, and that scientific conclusions should not rest on whether a p-value crosses a threshold (Wasserstein and Lazar 2016).
For theory, the implication is direct. A theory “supported” by a body of small, flexible, selectively published studies is less well supported than it appears. Several effects discussed later in this book have faced replication challenges. Where they have, the relevant chapters say so. Readers should weigh evidence by its design and transparency, not by the number of citations a finding has accumulated.
A credibility checklist for theory-testing studies.
- Prespecify confirmatory hypotheses, primary outcomes, sample size, exclusions, and the analysis model. Label everything else exploratory (Nosek et al. 2018).
- Power the study for the smallest effect that would matter theoretically or practically, remembering that published effects are likely inflated.
- Test the theory where it could fail: include conditions under which rival theories make different predictions (J. R. Platt 1964).
- Report fully: all conditions, measures, and exclusions, and results with and without covariates (Simmons, Nelson, and Simonsohn 2011).
- Share materials, data, and code where possible, and treat a successful replication as part of the contribution rather than an afterthought.
3.8 Theory in Practice
The tools in this chapter are not confined to academic journals. Every serious attempt to improve a business decision with evidence uses them, often under different names.
3.8.1 A/B testing as theory testing
Online controlled experiments, A/B tests, are the most widespread application of the experimental method in business. Kohavi, Tang, and Xu (2020) document how large technology firms run thousands of experiments a year to evaluate product changes. At their best, these experiments are theory tests: a product team holds a hypothesis about why a change should alter user behaviour, randomizes exposure, and measures the predicted outcome. At their worst, they are atheoretical searches in which many variants and metrics are tried and the “winners” are shipped: a corporate version of the garden of forking paths. Practitioners have developed defences that mirror academic reforms: pre-specified primary metrics, fixed experiment durations, corrections for multiple comparisons, and scepticism toward surprising results. Kohavi and colleagues call the last of these Twyman’s law: a figure that looks unusually interesting or different is usually the product of an error.
Testing an idea nobody prioritized. Kohavi and Thomke (2017) describe an experiment at Microsoft’s Bing search engine in which a modest change to how advertisement headlines were displayed, an idea that had sat in the development backlog for months because it seemed unimportant, produced one of the largest revenue improvements in the search engine’s history when it was finally tested. The case is usually told as an argument for experimentation, but it is also a lesson about theory. Intuitions about which changes matter are themselves implicit theories, and they are often wrong. Experiments discipline those theories. Explicit theory, in turn, tells teams which experiments are worth running and why a result should generalize to the next product decision.
3.8.3 Evidence-based management
The broader practice of using theory and evidence in decisions is evidence-based management (Rousseau 2006, Pfeffer and Sutton 2006). It asks managers to treat their beliefs about cause and effect as hypotheses, to seek the best available evidence from research, organizational data, stakeholders, and professional experience, and to evaluate the outcomes of their decisions. Theory plays three roles in this process. It tells managers what to look for (which variables a mechanism implies), where a finding should travel (which boundary conditions limit generalization), and how to interpret anomalies (as signals that a theory needs revision rather than as noise to be ignored).
From managerial question to theory-driven test.
- State the decision and the implicit theory behind each option (“if we bundle onboarding with the premium tier, churn will fall because …”).
- Name the mechanism and at least one rival (switching costs vs. selection of committed customers).
- Derive divergent predictions (who should respond most under each account?).
- Choose the design (randomized test, staggered roll-out, or quasi-experiment) and pre-specify the primary metric and sample size.
- Interpret against the theory, including boundary conditions, before generalizing to other markets or products.
Treating a single test as a law. A successful experiment shows that a change worked in one population, at one time, for one metric. Without a theory of why it worked, a firm cannot know whether it will work in a new market, for a new customer segment, or after competitors respond. Replicate important results, and use the mechanism to decide where they should, and should not, travel.
3.9 Chapter Summary
- Hypotheses translate construct-level propositions into falsifiable claims about variables. A strong hypothesis-development paragraph states the mechanism and a boundary condition, not just prior findings.
- Constructs earn meaning through their nomological network. Measures must show convergent and discriminant validity (Cronbach and Meehl 1955, D. T. Campbell and Fiske 1959).
- Mediation tests the why (indirect effect a x b, bootstrapped). Moderation tests the when (interactions, floodlight analysis) (X. Zhao, Lynch, and Chen 2010, Spiller et al. 2013, Hayes 2018). Mechanism claims are strongest when mediators are manipulated (Spencer, Zanna, and Fong 2005, Bullock, Green, and Ha 2010).
- Choose theories by fit to question, level, and assumptions. Adjudicate between rivals with strong inference: find where they disagree (J. R. Platt 1964).
- Empirical work can build theory, test it, or both (Colquitt and Zapata-Phelan 2007). Deduction, induction, and abduction are complementary stages of theory development.
- Causal diagrams make a theory’s assumptions explicit and determine which variables to control, and which not to (Pearl 2009, Elwert and Winship 2014).
- Replication projects found that many published findings are weaker than reported. In one large project only 36 percent of replications were significant (Open Science Collaboration 2015). Flexibility, HARKing, and publication bias inflate false positives (Simmons, Nelson, and Simonsohn 2011, N. L. Kerr 1998, Ioannidis 2005). Preregistration and transparency help (Nosek et al. 2018).
- In practice, A/B tests, scaled interventions, and evidence-based management are all forms of theory testing (Kohavi, Tang, and Xu 2020, Allcott 2015, Rousseau 2006).
Table 3.11 presents the comparison of the chapter’s tools for using theory.
| Tool | Question answered | Signature practice | Common misuse | Key source |
|---|---|---|---|---|
| Hypothesis development | What exactly does the theory predict here? | Mechanism plus boundary plus directional prediction | Theory as decoration | Bacharach (1989) |
| Nomological network | Does the measure capture the construct? | Convergent and discriminant validation | Single-item metrics adopted on faith | Cronbach & Meehl (1955) |
| Mediation | How or why does X affect Y? | Bootstrapped indirect effect, manipulating M | Causal claims from cross-sectional mediation | Zhao et al. (2010) |
| Moderation | When or for whom? | Interaction with floodlight analysis | Arbitrary spotlights, underpowered tests | Spiller et al. (2013) |
| Strong inference | Which rival explanation survives? | Crucial tests where theories diverge | Confirming a theory without rivals | Platt (1964) |
| Causal diagrams | Which controls identify the effect? | Back-door criterion | Kitchen-sink controls, collider bias | Pearl (2009) |
| Preregistration | Is this a prediction or a postdiction? | Time-stamped plans, registered reports | HARKing, forking paths | Nosek et al. (2018) |
3.10 Discussion Questions
- Rewrite a hypothesis-development paragraph from a published article you know using the five moves in Table 3.2. Which move was missing in the original?
- A firm finds that employees who attend voluntary leadership training are promoted faster. Draw a causal diagram that includes at least one confounder, one mediator, and one collider. What analysis does your diagram imply?
- Why might an indirect effect be significant even when the total effect of X on Y is not? Give a business example in which two mechanisms work in opposite directions.
- Choose a pair of competing theories from Table 3.6 and design a strong-inference study that could favour one over the other.
- Your company’s experimentation platform reports that 30 percent of last quarter’s A/B tests “won”. What questions would you ask before concluding that the product team’s ideas are unusually good?
- Is preregistration appropriate for theory-building research? Discuss how abductive and inductive studies can be made transparent without being preregistered in the confirmatory sense.
3.11 Further Reading
- Cronbach and Meehl (1955): the foundational argument that measurement validity is inseparable from theory.
- X. Zhao, Lynch, and Chen (2010): a concise and influential correction to the causal-steps approach to mediation. Pair with Hayes (2018) for implementation.
- Spiller et al. (2013): a clear guide to probing interactions with spotlight and floodlight analyses.
- J. R. Platt (1964): a short classic on how fields progress by testing rival hypotheses.
- Colquitt and Zapata-Phelan (2007): a map of how empirical articles build and test theory.
- Pearl (2009): the formal foundation of causal diagrams and identification. Elwert and Winship (2014) is a more accessible entry point on collider bias.
- Open Science Collaboration (2015) and Simmons, Nelson, and Simonsohn (2011): the empirical and methodological core of the replication debate.
- Kohavi, Tang, and Xu (2020): the standard practitioner guide to trustworthy online experiments.