30 Social Phenomena
Why does a challenger brand gain more from saying “we are just like the market leader” than the leader would gain from saying the reverse? Why can the average guess of a few hundred amateurs beat the judgement of a seasoned expert, and why does that advantage evaporate once the amateurs start talking to one another? Why do reporters from rival outlets end up writing the same story, why do a handful of novels, songs, and scientists capture most of the attention in their fields, and why does a shopper linger longer in a store that smells faintly of vanilla?
None of these questions is answered by a single grand theory. Each concerns a social phenomenon: a robust, recurring empirical regularity in how people judge, choose, cooperate, and influence one another. Philosophers of science distinguish phenomena, which are stable features of the world that theories are built to explain, from the data through which we detect them (Bogen and Woodward 1988). A phenomenon such as the bystander effect or the Matthew effect is therefore not a theory in itself. It is a pattern that several theories compete to explain and that managers ignore at their peril. Knowing the phenomenon tells us what tends to happen. Knowing the mechanisms behind it tells us when it will happen and how to design around it.
This chapter surveys twelve such phenomena, grouped by theme: similarity and attraction (similarity asymmetry, homophily, assortative mating, the social magnet). Collective judgement (the wisdom of crowds, groupthink, pack journalism). Cumulative advantage (the Matthew effect). Collective effort and action (social loafing, the bystander effect, the tragedy of the commons), and the link between scent and emotion. For each, we state the regularity, explain its mechanism, review the evidence and its limits, and show how it bears on business decisions (Table 30.1).
| Phenomenon | Core regularity | Level of analysis | Key source |
|---|---|---|---|
| Similarity asymmetry | The less prominent object is judged more similar to the prominent one than vice versa | Individual cognition | Tversky (1977) |
| Homophily | Contact between similar people occurs at a higher rate than among dissimilar people | Dyad / network | McPherson et al. (2001) |
| Assortative mating | Partners resemble each other more than chance would predict | Dyad / population | Schwartz & Mare (2005) |
| Social magnet | Others’ behaviour both attracts (imitation) and repels (differentiation) | Individual / group | Berger (2016) |
| Wisdom of the crowd | Aggregated independent judgements outperform most individuals | Group / market | Galton (1907), Surowiecki (2005) |
| Groupthink | Cohesive, insulated groups suppress dissent and decide badly | Small group | Janis (1972, 1982) |
| Pack journalism | Competing news outlets converge on the same stories and sources | Organization / field | Crouse (1973), Boczkowski (2010) |
| Matthew effect | Early advantage begets further advantage | Individual / field | Merton (1968) |
| Social loafing | People exert less effort when their contribution is pooled | Group | Latane et al. (1979) |
| Bystander effect | Helping becomes less likely as the number of witnesses rises | Group / situation | Darley & Latane (1968) |
| Tragedy of the commons | Individually rational use depletes shared resources | Community / institution | Hardin (1968), Ostrom (1990) |
| Scent and emotion | Odours evoke unusually emotional memories and shape evaluations | Individual | Rolls (2004), Willander & Larsson (2007) |
Definition 30.1 Social phenomenon. A stable, replicable regularity in social behaviour or judgement that holds across settings and is detectable with different kinds of data. Phenomena are the explananda of social theory: theories earn their keep by explaining why a phenomenon occurs and by predicting the conditions under which it strengthens, weakens, or reverses (Bogen and Woodward 1988).
30.1 Similarity Asymmetry
Core claim. Similarity judgements are directional. When people judge how similar a less prominent object (a variant) is to a more prominent one (a prototype), they report more similarity than when the comparison runs the other way.
Origins. Cognitive psychology. Amos Tversky’s feature-based contrast model of similarity (Tversky 1977), later applied widely to brands and advertising.
Level of analysis. Individual cognition. Applied to pairs of products, brands, countries, or people.
Key constructs. Common features, distinctive features, feature salience, subject and referent of a comparison, prototypicality.
Boundary conditions. The asymmetry requires that the two objects differ in salience or prominence and that the judgement has a clear direction (“Is A like B?”). It shrinks when objects are equally familiar or when the task is non-directional (“How similar are A and B?”).
Related theories. Processing fluency (Section 23.8), Beauty in averageness (Section 29.10), Anchoring effect (Section 29.9), Social comparison (Section 22.1).
30.1.1 Core logic
Before 1977, most psychological models represented objects as points in a geometric space, where similarity is a decreasing function of distance. Distance is symmetric: the distance from Lisbon to Madrid equals the distance from Madrid to Lisbon. Tversky (1977) showed that human similarity judgements violate this symmetry. People agree that “North Korea is similar to China” more readily than “China is similar to North Korea”, and that a son resembles his father more than a father resembles his son. In each case the less prominent object is the subject of the comparison and the more prominent object is the referent.
Tversky replaced geometry with features. Each object is described by a set of features, and similarity is a weighted contrast between what the objects share and what distinguishes them:
\[ S(a,b) = \theta f(A \cap B) - \alpha f(A - B) - \beta f(B - A), \qquad \theta, \alpha, \beta \ge 0, \]
where \(A\) and \(B\) are the feature sets of objects \(a\) and \(b\), \(f(\cdot)\) measures the salience of a set of features, \(A \cap B\) are the common features, \(A - B\) are features of \(a\) not shared by \(b\), and \(B - A\) the reverse. In a directional judgement (“\(a\) is like \(b\)”), attention focuses on the subject \(a\), so its distinctive features weigh more heavily than those of the referent: \(\alpha > \beta\). Subtracting the two directional judgements gives
\[ S(a,b) - S(b,a) = (\alpha - \beta)\,\big[f(B - A) - f(A - B)\big]. \]
When the referent \(b\) is the richer, more salient object, the prototype, the famous brand, the large country, \(f(B - A) > f(A - B)\), and the variant is judged more similar to the prototype than the prototype is to the variant. Figure 30.1 plots this prediction.
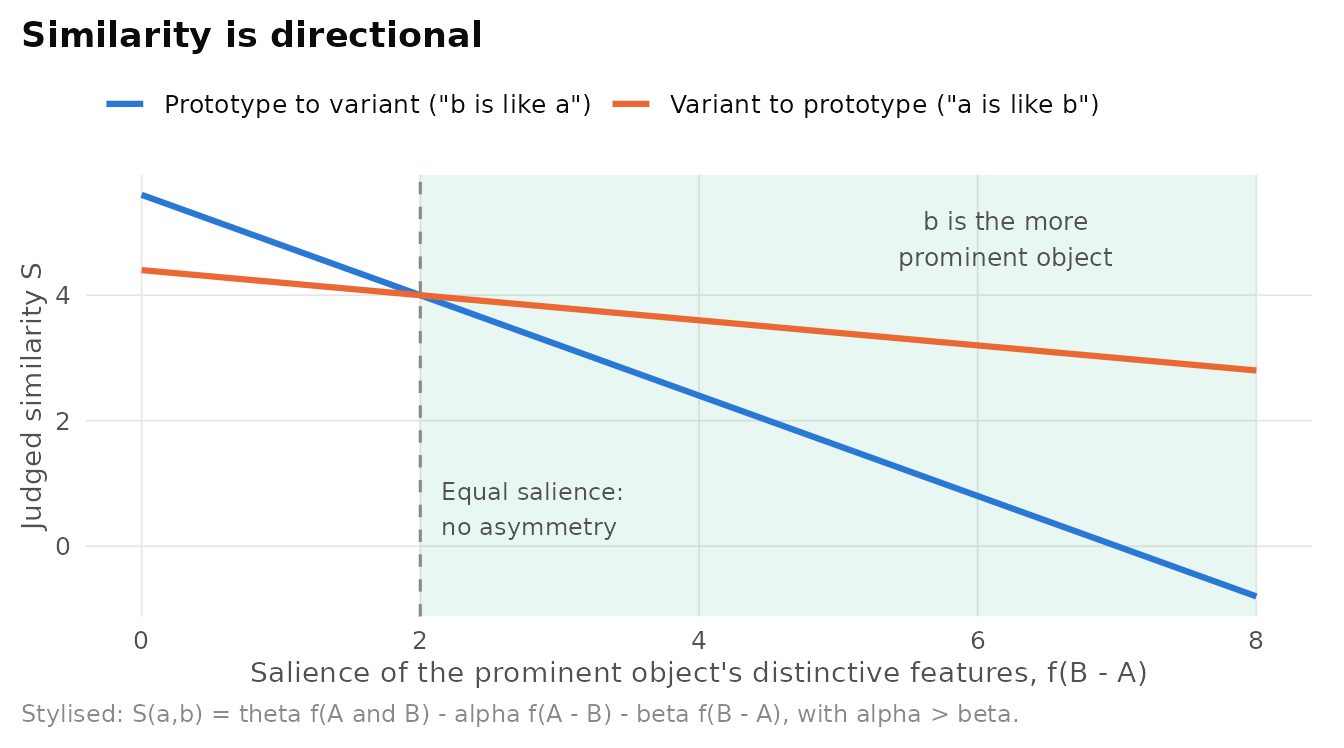
Figure 30.1: Stylised predictions of Tversky’s contrast model. As the prominent object’s distinctive features become more salient, the variant-to-prototype judgement (‘a is like b’) stays high while the prototype-to-variant judgement falls. Parameters are illustrative (theta = 1, alpha = 0.8, beta = 0.2).
The contrast model generates several propositions that carry directly into marketing:
- P1 (Directionality). Judged similarity is higher when the less prominent object is the subject and the more prominent object is the referent.
- P2 (Task dependence). When people judge difference rather than similarity, attention shifts toward distinctive features, so the same pair can appear both more similar and more different than another pair (Tversky 1977).
30.1.2 Applications in business
Brands are feature sets that differ sharply in salience. A market leader is rich in associations. A new entrant or a private label is sparse. The contrast model therefore implies that a comparison framed with the challenger as subject (“Brand X is just like the leader”) will produce more perceived similarity, and more borrowed equity, than the reverse framing, a direct implication of the contrast model (Tversky 1977). The same logic warns leaders against initiating comparisons with challengers: naming a weaker rival makes it the referent of the comparison and can lend it associations it could not otherwise claim.
For brand extensions, the parent brand is typically the prototype and the extension the variant. Consumers evaluate extensions more favourably when they perceive a good fit with the parent (D. A. Aaker and Keller 1990), and the contrast model suggests why: an extension inherits similarity from the parent more readily than the parent is redefined by the extension. Managers should nonetheless treat the asymmetry as a tendency rather than a guarantee: an extension with highly salient negative features can still feed back to the parent.
Illustrative scenario: framing a comparative advertisement. A regional coffee chain wants to position its espresso against a dominant national chain. Two scripts are tested. Script A says “Our espresso is as rich as [Leader]’s”. Script B says “[Leader]’s espresso is as rich as ours”. The contrast model predicts that Script A will produce higher similarity ratings because the challenger is the subject and the leader’s many salient features are the referent. A sensible test uses a between-subjects design with similarity, quality, and purchase-intention measures, plus a manipulation check on brand familiarity: the asymmetry should be larger among consumers who know the leader well and the challenger poorly.
Assuming similarity is symmetric in perceptual maps. Multidimensional scaling and many embedding methods force symmetric distances. If the underlying judgements are directional, such maps can misstate how close a challenger is to a leader in consumers’ minds. Collect directional judgements when brand prominence differs, and test for asymmetry before averaging the two directions.
30.2 Homophily
Core claim. Contact between similar people occurs at a higher rate than among dissimilar people, so personal networks are homogeneous with respect to many socio-demographic, behavioural, and intrapersonal characteristics.
Origins. Sociology, the term was popularised by Lazarsfeld and Merton in the 1950s, the definitive review is McPherson, Smith-Lovin, and Cook (2001). In psychology, the parallel similarity-attraction paradigm is associated with Byrne (1971).
Level of analysis. Dyad and network.
Key constructs. Status homophily, value homophily, baseline homophily, inbreeding homophily, opportunity structure, tie formation and dissolution.
Boundary conditions. Homophily is strongest on race and ethnicity, followed by age, religion, education, occupation, and gender. It is weaker for ties that are instrumental, short-lived, or formed in diverse foci of activity (McPherson, Smith-Lovin, and Cook 2001).
Related theories. Social identity theory (Section 22.2), Weak ties (Section 9.3), Structural holes (Section 9.4), Social capital (Section 9.5).
30.2.1 Core logic and propositions
The proverb “birds of a feather flock together” names one of the most robust regularities in social science. McPherson, Smith-Lovin, and Cook (2001) distinguish status homophily, based on ascribed characteristics (race, ethnicity, sex, age) and acquired ones (education, occupation, religion), from value homophily, based on attitudes, beliefs, and values. They also distinguish two sources of the pattern. Baseline homophily arises simply because the pool of potential contacts is itself homogeneous: a school, a neighbourhood, or an industry offers mostly similar others. Inbreeding homophily is the residual similarity beyond what the opportunity structure would produce, reflecting choice, comfort, and selective tie dissolution (Table 30.2).
| Dimension | Example characteristics | Main sources | Business relevance |
|---|---|---|---|
| Status homophily (ascribed) | Race, ethnicity, sex, age | Segregated neighbourhoods, schools, workplaces | Diversity of referral pools and hiring networks |
| Status homophily (acquired) | Education, occupation, religion | Sorting into institutions and occupations | Board interlocks, alumni networks, B2B relationships |
| Value homophily | Attitudes, beliefs, tastes | Selection on similarity plus mutual influence | Echo chambers, brand communities, recommendation systems |
| Baseline homophily | Any attribute | Composition of the opportunity pool (foci) | Changing who meets whom: office design, events, platforms |
| Inbreeding homophily | Any attribute | Preference, comfort, selective tie dissolution | Bias in ‘cultural fit’ hiring and partner choice |
Three propositions follow. Networks are more homophilous the more homogeneous the foci in which people meet (opportunity). Holding opportunity constant, people form ties with similar others at higher rates because similarity eases communication and validates their views (choice) (Byrne 1971), and ties between dissimilar people decay faster (dissolution). The main consequence is that homophily localises information: what circulates within a homogeneous network is redundant, which is why novel information tends to arrive through weak ties (Section 9.3) that bridge dissimilar groups.
Figure 30.2 summarises how opportunity and choice combine to produce homogeneous networks, and why the result matters.
Figure 30.2: Mechanism of homophily: opportunity structures generate baseline homophily, while choice and selective tie dissolution add inbreeding homophily. Homogeneous networks then circulate redundant information and reinforce shared views.
30.2.2 Evidence and extensions
Homophily is easy to observe and hard to explain causally. If similar people are connected and behave alike, is that because they chose one another (selection) or because they influenced one another after connecting (contagion)? Shalizi and Thomas (2011) show that, in observational network data, the two are generically confounded: without strong assumptions or experimental variation, one cannot separate them. Aral, Muchnik, and Sundararajan (2009) illustrate the stakes. In a large instant-messaging network, they found that conventional methods substantially overestimated peer influence in the adoption of a mobile service, because much of the apparent contagion reflected homophily-driven diffusion. Longitudinal studies of email networks show that homophily emerges from both preference and the structure of shared contexts, with triadic closure amplifying small initial biases (Kossinets and Watts 2009).
Hiring as cultural matching. Rivera (2012) studied hiring in elite investment banks, law firms, and consulting firms. Evaluators frequently assessed candidates on shared leisure pursuits, experiences, and self-presentation: a search for “fit” that operated as a form of homophily. Because these cultural markers correlate with social class, matching on fit can reproduce socio-economic advantage beyond what credentials alone would predict. The managerial implication is not to abandon judgements of fit but to define fit in terms of job-relevant behaviours, structure interviews, and audit whether evaluators’ notion of fit tracks performance.
Sample hypotheses. H1. Referral-based hiring will produce more demographically homogeneous teams than job-board hiring, controlling for applicant pools. H2. The estimated effect of peer adoption on a customer’s adoption will fall once homophily on observed and latent traits is modelled.
Designs. Randomised exposure to peers (field experiments on platforms). Matched-sample estimation (Aral, Muchnik, and Sundararajan 2009). Longitudinal network models that separate selection from influence (stochastic actor-oriented models). Natural experiments that change foci (office moves, dorm assignment).
Measures. Homophily indices relative to group composition (to separate baseline from inbreeding homophily). Tie formation and decay rates. Attribute similarity in embeddings of text or purchases.
30.3 Assortative Mating
Core claim. Couples resemble each other on many traits, age, ethnicity, education, religion, values, even language style, more than random pairing would produce.
Origins. Population biology and demography, sociological studies of homogamy, the most cited modern analysis of educational homogamy in the United States is C. R. Schwartz and Mare (2005). Assortative mating is homophily applied to the most consequential tie people form.
Level of analysis. Dyad (the couple) and population (the distribution of pairings).
Key constructs. Homogamy versus heterogamy, marriage market, preferences versus opportunities, linguistic synchrony.
Boundary conditions. Assortment depends on who meets whom (schools, workplaces, platforms) and on preferences. It varies across cohorts, countries, and traits.
Related theories. Homophily, Social exchange theory (Section 9.1), Social magnet.
People tend to marry others of similar age, nationality, ethnic background, religion, and education. Like homophily more generally, this pattern reflects both preferences (attraction to similar others) and opportunities (people meet partners in age-graded, education-graded settings). C. R. Schwartz and Mare (2005) analysed U.S. census and survey data spanning more than six decades and found that educational homogamy declined between 1940 and about 1960 and then rose substantially through 2003. The increase was especially pronounced at the extremes: university graduates became more likely to marry one another, and the least-educated became less likely to marry up.
These trends matter beyond the family. Because couples pool income, rising educational assortment can widen household inequality even if individual earnings inequality were unchanged: a mechanism that links the micro-level choice of a partner to macro-level distributions of wealth, consumption, and children’s opportunities.
Similarity extends to subtle behaviours. Language style matching (LSM) is the degree to which two people use function words, pronouns, articles, prepositions, conjunctions, at similar rates. Ireland et al. (2011) reported two studies. In speed-dating conversations, higher LSM predicted mutual romantic interest, that is, whether both partners wanted to see each other again. In a study of dating couples’ everyday instant messages, higher LSM predicted whether the couple was still together about three months later. Because function words are produced largely without conscious control, LSM appears to index psychological attunement rather than strategic mimicry. It is a measure of verbal synchrony, not proof that matching causes relationship success.
Matching markets and recommendation design. Online dating platforms, mentoring programmes, and co-founder matching services all face the same design choice: should the algorithm match on similarity, on complementarity, or on stated preferences? Assortative mating research suggests that similarity on values and background predicts mutual interest, but it also shows that similarity-based matching concentrates advantage and reduces exposure to difference. Platforms can make the trade-off explicit, for example by mixing high-similarity recommendations with a controlled share of “exploration” matches and measuring outcomes for each.
Take a sample of email or chat exchanges between members of two project teams (with consent). Compute the share of function words in each message (pronouns, articles, prepositions) and an LSM score for each pair. Does LSM in the first week predict which pairs are still collaborating a month later? What alternative explanations, shared task, shared seniority, would you need to rule out?
30.5 Wisdom of the Crowd
Core claim. Under the right conditions, the aggregate of many independent judgements is more accurate than the typical individual judgement, and often more accurate than the best individual.
Origins. Statistics and social science, Galton’s analysis of an ox-weighing competition (Galton 1907), popularised by Surowiecki (2005), formalised in the forecasting literature (Clemen 1989, Larrick and Soll 2006) and in models of diversity (Hong and Page 2004, Page 2007).
Level of analysis. Group, organization, or market.
Key constructs. Independence, diversity of information, decentralisation, aggregation rule (mean, median, market price), bracketing, correlated error.
Boundary conditions. Errors must be at least partly independent and not share a common bias, individuals must have some relevant information, a sensible aggregation rule must exist. Social influence, herding, and common information sources erode the effect (Lorenz et al. 2011).
Related theories. Pack journalism, Groupthink, Conformity (Section 22.4), Heuristics and biases (Section 23.2).
30.5.1 Origins
In 1906 Francis Galton examined the tickets from a weight-judging competition at a livestock fair in Plymouth, England, where visitors paid to guess the dressed weight of an ox. He reported that the middlemost (median) estimate of roughly eight hundred entrants was within about one per cent of the true weight, and interpreted the result as evidence for the trustworthiness of a democratic judgement: vox populi (Galton 1907). A century later, Surowiecki (2005) synthesised research and cases showing that crowds can outperform experts in forecasting, estimation, and problem solving, and articulated the conditions under which they do so.
30.5.2 Core logic
The statistical heart of the phenomenon is simple. Write each person’s estimate as the truth plus an error. When errors are independent and centred on zero, averaging cancels them: the error of the mean shrinks with the square root of the crowd size. Larrick and Soll (2006) call this the averaging principle and show why it is so powerful: whenever individual estimates bracket the truth, some above, some below, the average is guaranteed to beat the average individual. Yet people systematically misappreciate the principle. Asked how to combine two opinions, many prefer to “chase the expert”, picking the judge they believe to be better, even when simple averaging would outperform that strategy.
Page (2007) expresses the same logic as an identity, the diversity prediction theorem: for squared error,
\[ \underbrace{(\bar{x} - \theta)^2}_{\text{crowd error}} = \underbrace{\frac{1}{n}\sum_{i=1}^{n}(x_i - \theta)^2}_{\text{average individual error}} - \underbrace{\frac{1}{n}\sum_{i=1}^{n}(x_i - \bar{x})^2}_{\text{prediction diversity}}, \]
where \(x_i\) are individual estimates, \(\bar{x}\) is their mean, and \(\theta\) is the truth. A crowd is accurate when its members are individually informed or when their errors are diverse. The theorem is an accounting identity, not an empirical claim, but it clarifies what managers can change: individual accuracy (through expertise and information) and diversity (through independence and heterogeneous perspectives).
The weakness of crowds lies in correlated error. If everyone reads the same analyst report, shares the same incentive, or hears the first speaker in a meeting, part of their error is common and no amount of averaging removes it. With pairwise error correlation \(\rho\) and individual error standard deviation \(\sigma\), the error of the crowd mean has standard deviation \(\sigma\sqrt{\rho + (1-\rho)/n}\), which approaches the floor \(\sigma\sqrt{\rho}\) as the crowd grows. Figure 30.4 simulates this result.
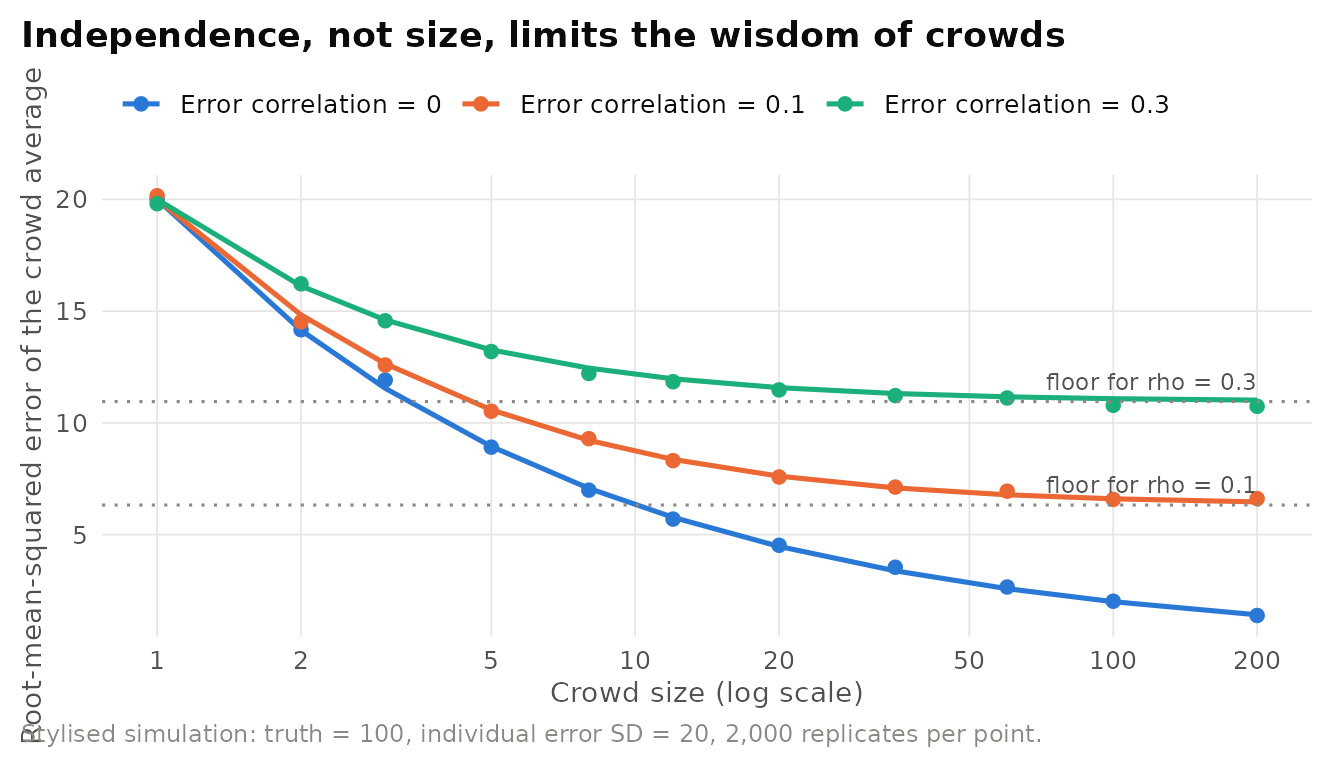
Figure 30.4: Illustrative simulation of crowd accuracy. With independent errors, the error of the crowd’s average falls steadily with crowd size. With even modestly correlated errors, accuracy plateaus: beyond a few dozen members, adding people barely helps. Points are simulated, lines show the analytical expectation.
30.5.3 Evidence and extensions
The averaging advantage is among the best-replicated findings in forecasting. A review of the forecast-combination literature concluded that simple combinations of forecasts, often an unweighted mean, frequently match or beat more elaborate weighting schemes and the best individual method (Clemen 1989). Laboratory evidence shows the same pattern for individual judges (Larrick and Soll 2006).
The conditions, however, are demanding. Surowiecki (2005) identifies four: diversity of opinion, independence of judgement, decentralisation of knowledge, and a mechanism for aggregation. Table 30.3 maps each condition to the way it fails and to design remedies.
| Condition | What it requires | How it fails | Design remedy |
|---|---|---|---|
| Diversity | People hold different information or models | Homogeneous teams, common training and data | Recruit forecasters from different functions and regions |
| Independence | Judgements are formed before seeing others’ | Anchoring on early or senior voices, herding | Collect estimates privately before discussion |
| Decentralisation | People draw on local, specialised knowledge | Only headquarters’ view is solicited | Ask those closest to customers and operations |
| Aggregation | A rule turns many judgements into one | Loudest voice wins, no formal rule | Use the mean or median, or a market price |
Social influence is the most common way crowds lose their wisdom. In an experiment in which participants answered factual estimation questions and, in some conditions, saw others’ answers between rounds, Lorenz et al. (2011) found that social information narrowed the diversity of estimates without improving collective accuracy, while making participants more confident. A crowd that converges looks more authoritative precisely when it has become less informative. The same mechanism appears in creative tasks: in networked idea-generation, more densely connected participants were exposed to redundant inspirations and produced less innovative ideas than participants in sparser networks (Stephen, Zubcsek, and Goldenberg 2016).
Diversity of perspectives can matter as much as diversity of errors. Using an agent-based model of problem solving, Hong and Page (2004) showed that a randomly selected group of diverse problem solvers can outperform a group of the individually best solvers, because the best solvers tend to think alike and get stuck on the same local optima.
Does diversity trump ability? The Hong-Page result has been widely cited in arguments for diverse teams. Critics argue that the mathematical result depends on specific modelling assumptions and has been over-generalised to claims about demographic diversity, which the model does not address (A. Thompson 2014). A balanced reading is that cognitive diversity, different information, heuristics, and representations, can improve collective problem solving when individuals are competent and errors are not shared. Whether a particular demographic mix delivers such cognitive diversity is an empirical question.
30.5.4 Prediction markets
A prediction market aggregates beliefs through prices. Traders buy and sell contracts whose pay-off depends on a future event, for example, a contract that pays one dollar if a product ships by a given date, and the market price can be read as a crowd probability. Wolfers and Zitzewitz (2004) review the evidence from political, sports, and corporate markets and conclude that market prices are typically reasonable, if imperfect, forecasts, often at least as accurate as polls and expert opinion. Markets add two features to simple averaging: they weight traders by their willingness to bet, and they continuously incorporate new information. They also inherit the crowd’s weaknesses: thin participation, shared biases, and potential manipulation.
Forecasting with internal markets and simple averaging. Several large firms have run internal prediction markets on questions such as project completion dates, demand, and product quality. Cowgill and Zitzewitz (2015) analysed markets at Google, Ford, and a third firm and found that they were informative relative to available alternatives yet showed systematic biases, including optimism. The practical lesson is that a firm does not need a market to capture most of the benefit. A disciplined protocol, collect independent, private estimates from a diverse set of informed employees, aggregate them with a mean or median, and only then discuss, often captures the bulk of the averaging gain (Larrick and Soll 2006, Clemen 1989). Markets are most valuable when information is widely dispersed, changes over time, and is unlikely to surface through the hierarchy.
Sample hypotheses. H1. Forecast accuracy of an aggregated crowd will decline when members observe earlier forecasts before submitting their own. H2. The benefit of adding forecasters will be smaller when forecasters share a common information source.
Designs. Lab and online estimation tasks with randomised social information (Lorenz et al. 2011). Field data from corporate forecasting tournaments. Archival comparisons of consensus and individual analyst forecasts.
Measures. Mean squared error of aggregated and individual forecasts, prediction diversity, error correlation across forecasters, bracketing rate.
Confusing consensus with wisdom. Agreement is not evidence of accuracy. A crowd whose members talked first, read the same report, or deferred to the same leader may agree strongly and still be wrong. Always ask whether the judgements being aggregated were formed independently.
30.6 Groupthink
Core claim. Highly cohesive groups operating under structural faults and stress develop a “concurrence-seeking tendency” that suppresses dissent and critical appraisal, producing defective decisions.
Origins. Political and social psychology. Janis (1972), revised in Janis (1982), through case studies of U.S. foreign-policy decisions.
Level of analysis. Small decision-making group.
Key constructs. Cohesiveness, insulation, directive leadership, homogeneity, concurrence seeking, symptoms of groupthink, defective decision making.
Boundary conditions. Janis argued that cohesiveness produces groupthink only in combination with structural faults (insulation, lack of impartial leadership and of methodical procedures, homogeneity) and a provocative situational context (external threat, recent failure).
Related theories. Wisdom of the crowd, Conformity (Section 22.4), Spiral of silence (Section 22.8), Upper echelons theory (Section 6.4).
Irving Janis analysed decisions such as the Bay of Pigs invasion and the escalation of the Vietnam War, contrasting them with better-managed decisions such as the handling of the Cuban missile crisis (Janis 1972, 1982). He argued that the fiascoes shared a pattern: capable, loyal members of a cohesive group came to value agreement over accuracy. Figure 30.5 summarises the model, and Table 30.4 lists the eight symptoms Janis described.
Figure 30.5: Janis’s groupthink model: cohesiveness, structural faults, and a provocative context produce concurrence seeking, which manifests in symptoms of groupthink and leads to defective decision making. Redrawn from the logic in Janis (1982).
| Symptom type | Symptom | What it looks like in a business meeting |
|---|---|---|
| Overestimation of the group | Illusion of invulnerability | Excessive optimism about a launch or acquisition. Risks waved away |
| Overestimation of the group | Belief in the group’s inherent morality | Ethical concerns dismissed because ‘we are the good guys’ |
| Closed-mindedness | Collective rationalisation | Warning signals explained away rather than investigated |
| Closed-mindedness | Stereotyped views of out-groups | Competitors or regulators assumed to be weak or foolish |
| Pressure toward uniformity | Self-censorship | Members keep doubts to themselves |
| Pressure toward uniformity | Illusion of unanimity | Silence interpreted as agreement |
| Pressure toward uniformity | Direct pressure on dissenters | Sceptics labelled ‘not team players’ |
| Pressure toward uniformity | Self-appointed mindguards | Members filter out unwelcome information before it reaches the leader |
How well does the model hold up? Groupthink is among the most popular ideas in management education, yet its empirical support is mixed. Reviewing a quarter century of research, Esser (1998) found that case studies generally supported the model, whereas laboratory tests produced inconsistent results, particularly for the central role Janis assigned to cohesiveness. Many scholars now treat groupthink as a useful description of a family of failure modes, insulation, directive leadership, and suppressed dissent, rather than as a tightly specified causal theory.
Designing dissent into decisions. Janis’s prescriptions remain practical: leaders should withhold their preferences at the outset, assign a devil’s advocate, invite outside experts, split the group into subgroups that work independently, and hold a “second-chance” meeting before committing (Janis 1982). A related technique is the pre-mortem: before a decision is finalised, team members imagine that the project has failed and write down the reasons why, which legitimises dissent and surfaces risks that would otherwise be self-censored (G. Klein 2007). Both approaches restore the independence that the wisdom-of-crowds logic requires.
30.7 Pack Journalism
Core claim. Journalists from competing outlets tend to cover the same stories, use the same sources, and adopt the same framing, producing homogeneous news despite nominal competition.
Origins. Journalism studies. The term was popularised by Timothy Crouse’s account of reporters travelling with the 1972 U.S. presidential campaign (Crouse 1973). Systematic evidence on imitation in online news comes from Boczkowski (2010).
Level of analysis. Organization (newsroom) and organizational field (news industry).
Key constructs. Competitive monitoring, shared sourcing, uncertainty about newsworthiness, imitation, homogenisation.
Boundary conditions. Strongest when journalists are physically or digitally co-present, when news value is uncertain, when the cost of missing a story others have exceeds the reward for a unique story, and when monitoring competitors is cheap.
Related theories. Wisdom of the crowd, Agenda setting (Section 26.5), Institutional theory (Section 7.2), Conformity (Section 22.4).
Crouse described the campaign press corps as a closed community: reporters travelled together, ate together, received the same briefings, and checked one another’s leads, so that coverage converged on a shared interpretation of the campaign (Crouse 1973). The phenomenon did not disappear when news moved online. In some respects it intensified. Studying leading Argentine news sites, Boczkowski (2010) found that journalists monitored competitors’ output continuously and that the resulting imitation increased the similarity of news content, even as the volume of available information grew. Abundance of information, paradoxically, produced homogeneity of news.
Pack journalism is an organizational instance of herding. Models of informational cascades show that when actors observe predecessors’ choices but not their private information, it can be rational to follow the predecessors and ignore one’s own signal. Once a cascade starts, later choices add no new information and the cascade can be wrong (Bikhchandani, Hirshleifer, and Welch 1992, Banerjee 1992). Reputational incentives reinforce the pattern: an editor is rarely punished for missing a story everyone missed, but is punished for missing a story everyone else ran. Figure 30.6 shows how these forces combine.
Figure 30.6: Mechanism of pack journalism. Uncertainty about newsworthiness, cheap monitoring of competitors, shared sources, and asymmetric reputational penalties lead outlets to imitate one another, producing homogeneous coverage that in turn confirms what counts as ‘the story’.
Media monitoring and herd coverage. For communication and investor-relations teams, pack journalism has two implications. First, coverage is lumpy: once a few influential outlets frame a story, a product recall, a CEO departure, others are likely to follow the same frame, so the first hours of a crisis matter disproportionately. Second, the volume of coverage is a poor proxy for the amount of independent scrutiny. Fifty articles that rewrite one wire story contain one source of information. Media-monitoring dashboards should therefore track the number of original sources and frames, not just mentions, and analysts who use news-based sentiment as a signal should discount duplicated content.
30.8 Matthew Effect
Core claim. Advantage accumulates: those who receive early recognition, resources, or attention gain disproportionate access to future recognition, resources, and attention, independently of their underlying merit.
Origins. Sociology of science. Merton (1968b), drawing on interviews with Nobel laureates. Later generalised as cumulative advantage (DiPrete and Eirich 2006) and as preferential attachment in network science (Barabási and Albert 1999).
Level of analysis. Individual careers, products, and firms within a field.
Key constructs. Status, visibility, cumulative advantage, preferential attachment, path dependence, inequality and unpredictability of outcomes.
Boundary conditions. Strongest when quality is hard to observe, attention is scarce, and choices are visible to others. Weaker when quality can be assessed directly or when evaluation is blind.
Related theories. Signaling theory (Section 8.2), Social magnet, Diffusion of innovations (Section 10.1), Resource-based theory (Section 4.1).
30.8.1 Core logic
Merton (1968b) named the effect after the verse in the Gospel of Matthew that promises more to those who already have. He observed that eminent scientists receive disproportionate credit for collaborative or simultaneous discoveries, while lesser-known scientists receive less credit for comparable contributions. Merton saw two sides to the phenomenon: it is unfair to the less known, but it also helps the scientific community allocate scarce attention, because the name of an eminent scientist signals that a paper is worth reading.
The mechanism generalises well beyond science. Wherever success makes future success more likely, through visibility, reputation, resources, or network position, small early differences, including random ones, can grow into large and persistent inequalities (DiPrete and Eirich 2006). In networks, new nodes attach preferentially to already well-connected nodes, producing the highly skewed degree distributions found in citation networks and the web (Barabási and Albert 1999). In labour and entertainment markets, Rosen (1981) showed that when a performer’s output can be consumed by many at little extra cost, small differences in talent translate into very large differences in earnings: the economics of superstars.
Figure 30.7 simulates cumulative advantage in a market of twenty products of identical quality. When consumers choose independently, market shares are nearly equal. When each consumer is more likely to choose a product in proportion to its prior popularity, a few products capture large shares, and which products win differs from one simulated world to the next.
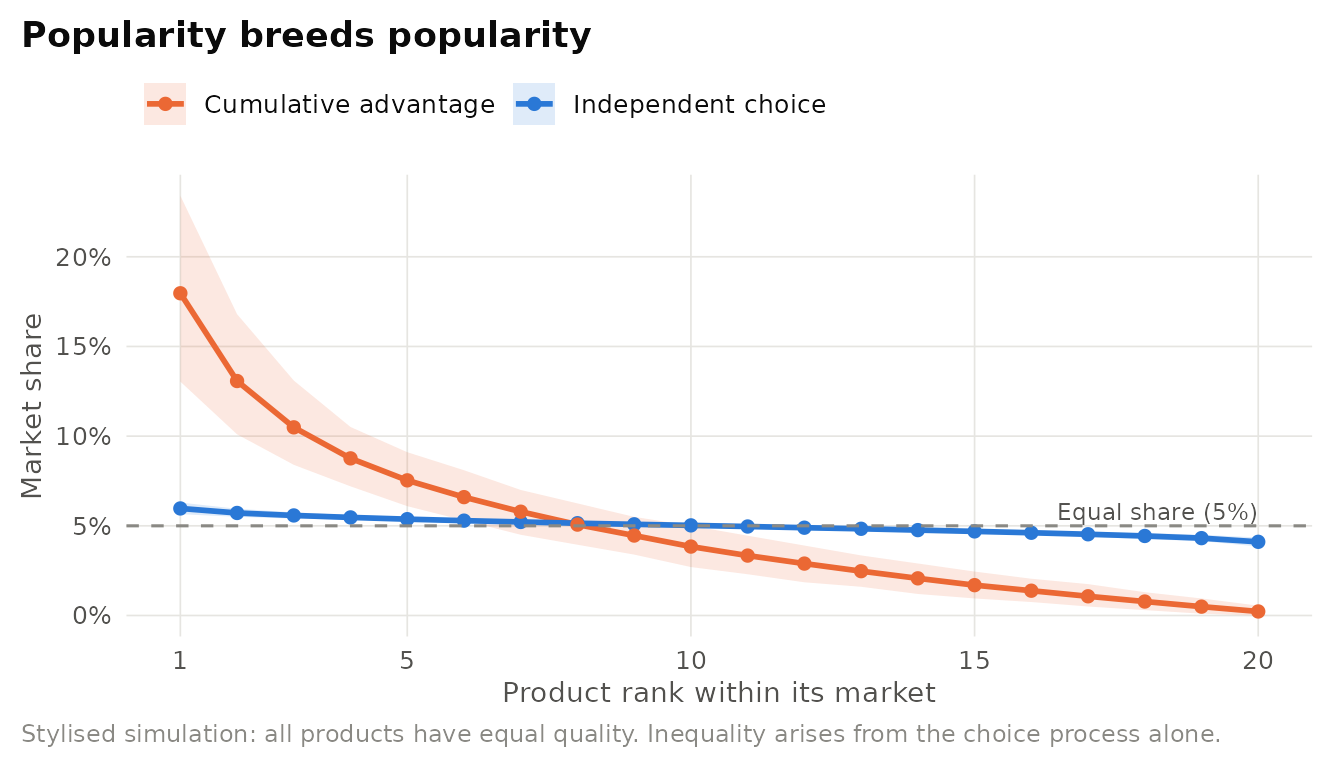
Figure 30.7: Illustrative simulation of cumulative advantage. Twenty products of identical quality compete for 2,000 sequential consumers in 300 simulated markets. Under independent choice, shares are nearly equal. Under cumulative advantage (choice probability proportional to prior adoptions + 1), the top-ranked product captures a far larger share. Lines show the mean share at each rank. Bands show the 10th-90th percentiles across markets.
30.8.2 Evidence and extensions
The most striking experimental demonstration comes from Salganik, Dodds, and Watts (2006), who created an online music market in which participants could listen to and download songs by unknown bands. Participants were randomly assigned either to an independent condition, in which they saw no information about others’ choices, or to one of several “worlds” in which they saw download counts. Social influence increased both the inequality of success, popular songs became more popular, and its unpredictability: the same song could succeed in one world and fail in another. Quality mattered, since the best songs rarely did very badly and the worst rarely did very well, but it left a wide range of possible outcomes.
Effect or fable? Observational evidence of a Matthew effect is confounded: high-status actors may simply produce better work. P. Azoulay, Stuart, and Wang (2014) addressed this by studying scientists who received a prestigious appointment, comparing citations to articles published before the appointment with carefully matched control articles. They found a status effect, but one considerably smaller than naive comparisons imply and concentrated where quality is most uncertain: for example, for more recent articles and for scientists whose reputations were less established. The lesson is that cumulative advantage is real but bounded by the availability of direct information about quality.
Star systems in creative industries. Publishing, film, music, and gaming are markets with uncertain quality, abundant products, and visible popularity: ideal conditions for cumulative advantage. Firms respond in two ways. Some ride the dynamic, concentrating marketing spend on early winners, ranking products by popularity, and signing established stars whose prior success attracts attention (Rosen 1981). Others counteract it, because a portfolio managed purely on early popularity under-invests in good products that started unlucky. The Salganik et al. findings imply that early sales are partly noise: a publisher or platform can reserve “discovery” slots, randomise initial exposure for new releases, or evaluate titles on early engagement per exposure rather than on raw popularity (Salganik, Dodds, and Watts 2006).
30.10 Bystander Effect
Core claim. The presence of other witnesses reduces the likelihood that any individual will help a person in need, and slows help when it does come.
Origins. Social psychology, prompted by public reaction to the 1964 murder of Kitty Genovese and tested experimentally by Darley and Latané (1968), elaborated in Latané and Darley (1970), meta-analysed by Fischer et al. (2011).
Level of analysis. Individual within a situation involving multiple witnesses.
Key constructs. Diffusion of responsibility, pluralistic ignorance, audience inhibition, the five-step intervention model, danger of the emergency.
Boundary conditions. Attenuated when the emergency is clearly dangerous, when a perpetrator is present, and when the costs of intervention are physical (Fischer et al. 2011). Also weakened when bystanders know one another or when responsibility is explicitly assigned.
Related theories. Social loafing, Conformity (Section 22.4), Social norms (Section 22.5), Spiral of silence (Section 22.8).
In the classic experiment, students conversing over an intercom heard another participant apparently suffer a seizure (Darley and Latané 1968). Participants who believed they were the only listener were far more likely to seek help, and to do so quickly, than those who believed several others were also listening. The authors attributed the difference to diffusion of responsibility: when many could help, each feels less personally obliged.
Latané and Darley (1970) framed helping as a sequence of decisions, each of which other bystanders can derail (Figure 30.8). A bystander must notice the event, interpret it as an emergency, accept personal responsibility, decide how to help, and implement the decision. Others’ presence can impede the second step through pluralistic ignorance (everyone looks calm, so it must not be serious), the third through diffusion of responsibility, and the fifth through audience inhibition (fear of embarrassment).
Figure 30.8: Latane and Darley’s five-step model of bystander intervention, with the points at which the presence of other bystanders inhibits helping. Redrawn from the logic in Latane and Darley (1970).
The parable of the 38 witnesses. The Genovese case, as popularly told, 38 neighbours watching a murder and doing nothing, inspired the research programme but is not an accurate account of the event. Manning, Levine, and Collins (2007) show that the number of witnesses, what they could see, and whether anyone called the police were misreported, and argue that the story distorted psychology’s understanding of helping by framing groups only as inhibitors. The experimental phenomenon stands on its own evidence, and the meta-analysis by Fischer et al. (2011) confirms a reliable bystander effect, but with an important qualification: in clearly dangerous emergencies the effect is attenuated, plausibly because danger is recognised faster and other bystanders become potential sources of physical support.
Diffusion of responsibility in organizations. Many organizational failures look like bystander effects: a defect everyone on a shared channel saw but no one reported, a compliance concern raised in a large meeting and then dropped, a customer complaint copied to ten people and answered by none. The remedies mirror the five-step model. Make anomalies salient (step 1-2: clear alerting thresholds). Assign responsibility explicitly rather than to “the team” (step 3: a named incident owner or on-call rotation). Provide scripts for what to do (step 4: escalation runbooks), and reduce the social cost of speaking up (step 5: non-punitive reporting channels). Incident-response practices that designate a single incident commander are, in effect, an institutional antidote to diffusion of responsibility.
30.11 Tragedy of the Commons
Core claim. When a resource is open to all and use by one reduces what is available to others, individually rational use can deplete the resource to everyone’s detriment, unless institutions govern access and use.
Origins. Ecology and economics, Hardin (1968), the institutional response is Ostrom (1990), which documented long-enduring self-governed commons and earned Ostrom a share of the 2009 Nobel Memorial Prize in Economic Sciences.
Level of analysis. Community, organization, or institution governing a shared resource.
Key constructs. Common-pool resource (subtractable, hard to exclude), open access, externality, free riding, monitoring, graduated sanctions, collective-choice arrangements.
Boundary conditions. Tragedy is likely under open access with anonymous, numerous users and no communication. It is not inevitable where users can communicate, monitor, and craft enforceable rules.
Related theories. Social loafing, Institutional theory (Section 7.2), Transaction cost economics (Section 6.3), Stakeholder theory (Section 7.4).
30.11.1 Core logic
Hardin (1968) asked readers to imagine a pasture open to all herders. Each herder gains the full benefit of adding another animal but bears only a fraction of the cost of the resulting overgrazing, which is shared by all. Each therefore adds animals, and the pasture is ruined. Hardin concluded that the commons could be saved only by private property or by mutually agreed coercion such as regulation.
The logic is that of a social dilemma: the individually dominant strategy produces a collectively inferior outcome. It applies to fisheries, groundwater, the atmosphere, and, within firms, to shared budgets, shared computing resources, and shared attention (the meeting everyone can call, the inbox everyone can fill).
30.11.2 Ostrom’s challenge
Ostrom (1990) questioned the claim that only markets or states could prevent tragedy. Drawing on case studies of communities that had managed common-pool resources for long periods, Swiss and Japanese mountain commons, irrigation institutions in Spain and the Philippines, and others, she showed that users themselves often devised durable rules. She also documented failures, and from the comparison she distilled the design principles in Table 30.6 that characterise long-enduring institutions.
| # | Design principle | Meaning | Corporate analogue |
|---|---|---|---|
| 1 | Clearly defined boundaries | Who may use the resource, and the resource’s limits, are clear | Who may draw on a shared cloud budget or data platform |
| 2 | Congruence with local conditions | Rules for use and contribution fit local circumstances | Usage quotas tailored to each team’s workload |
| 3 | Collective-choice arrangements | Most users can take part in modifying the rules | Users sit on the governance board for the shared service |
| 4 | Monitoring | Monitors are accountable to users or are users | Transparent usage dashboards visible to all teams |
| 5 | Graduated sanctions | Violations meet sanctions that escalate with severity | Warnings, then throttling, then charge-backs |
| 6 | Conflict-resolution mechanisms | Rapid, low-cost arenas to resolve disputes | A standing forum to settle allocation disputes |
| 7 | Minimal recognition of rights to organize | External authorities do not undermine users’ rules | Senior leadership respects locally agreed rules |
| 8 | Nested enterprises | Governance is layered for larger systems | Team, division, and enterprise rules that fit together |
Figure 30.9 contrasts, in stylised form, the resource dynamics under open access, where effort expands as long as harvesting is profitable, with a governed regime that caps total use below the resource’s regenerative capacity.
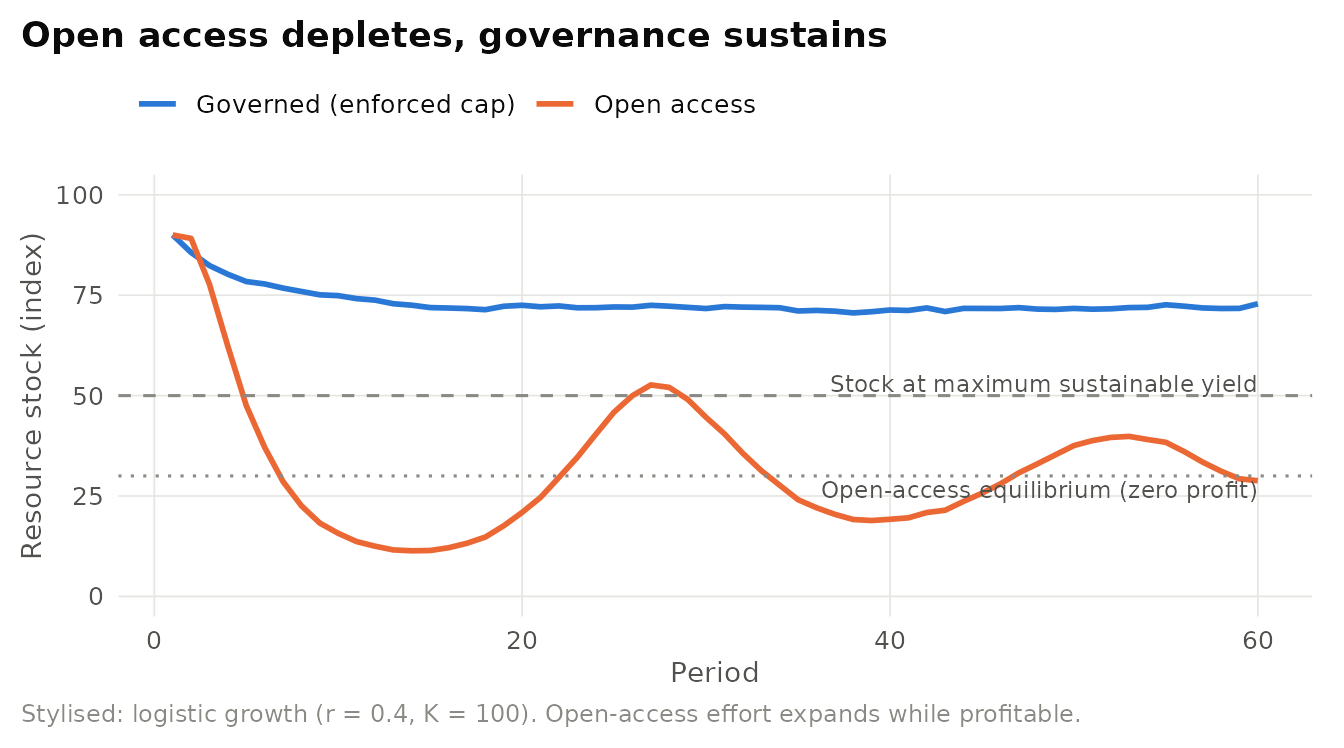
Figure 30.9: Stylised resource dynamics. Under open access, users expand effort while harvesting is profitable, driving the stock down toward the level at which profits vanish. Under a governed regime with a cap set below maximum sustainable yield and enforced by monitoring, the stock stabilises at a high level. Logistic growth with small random shocks.
Governing internal commons. Shared corporate resources, a central data engineering team, a cloud-computing budget, a pool of user-research participants who can be surveyed only so often, are common-pool resources. Without rules, each team draws on them as if they were free, leading to queues, overspending, and survey fatigue. Charging every use at full cost (privatisation) or centralising all allocation (regulation) are Hardin’s two solutions. Ostrom’s principles suggest a third: clear boundaries on who may use the resource, transparent monitoring of use, graduated responses to overuse, and a governance forum in which the user teams themselves set and revise the rules.
Treating every shared resource as doomed. Hardin’s parable is often invoked as if tragedy were inevitable. Ostrom’s evidence shows that outcomes depend on institutions. When analysing a commons problem, first describe the existing rules, formal and informal, for access, monitoring, and sanctioning, and ask which of the design principles are missing.
30.12 Scent and Emotion
Core claim. Odours are tightly linked to emotion and memory: they evoke emotionally intense autobiographical memories and colour evaluations of places and products, often without conscious awareness.
Origins. Neuroscience and cognitive psychology (E. T. Rolls 2004, Willander and Larsson 2007). Applied in marketing research on ambient scent and sensory marketing (Spangenberg, Crowley, and Henderson 1996, D. J. Mitchell, Kahn, and Knasko 1995, Krishna 2012).
Level of analysis. Individual perception, memory, and evaluation.
Key constructs. Olfactory processing, orbitofrontal cortex, odour-evoked autobiographical memory, ambient scent, scent congruence, sensory marketing.
Boundary conditions. Effects depend on the pleasantness and intensity of the scent, its congruence with the product or setting, and individual and cultural differences in odour associations.
Related theories. SOR framework (Section 31.5), Affect circumplex (Section 25.3), Feelings as information (Section 23.7), Mere exposure effect (Section 29.1).
30.12.1 Core logic
Smell occupies a distinctive place among the senses. The orbitofrontal cortex receives olfactory input together with taste, touch, and visual inputs and represents the reward value of stimuli. It is also central to emotion (E. T. Rolls 2004). This anatomical overlap helps explain why odours are experienced less as neutral information and more as pleasant or unpleasant, and why they so readily trigger feelings.
The link extends to memory. Willander and Larsson (2007) compared autobiographical memories cued by odours with memories cued by verbal and visual representations of the same items. Odour-cued memories were rated as more emotional and were accompanied by a stronger feeling of being brought back in time. Smell, in short, is an unusually direct route to emotionally charged memories: the phenomenon often called the “Proust effect”.
30.12.2 Evidence in marketing
Retailers and service firms have used these properties for decades. Spangenberg, Crowley, and Henderson (1996) manipulated ambient scent in a simulated retail store and found that the presence of a pleasant scent improved evaluations of the store and its merchandise. The precise scent mattered less than whether a pleasant scent was present at all. D. J. Mitchell, Kahn, and Knasko (1995) showed that congruence matters for decision making: when the ambient odour fit the product category being considered, consumers spent more time processing, engaged in more holistic processing, and sought more variety. Krishna (2012) integrates such findings into a broader framework of sensory marketing, in which sensory inputs shape perception, which in turn affects emotion, cognition, memory, and behaviour (Figure 30.10).
Figure 30.10: How ambient scent shapes consumer responses. Olfactory input is processed in regions that represent reward value and emotion, producing affect and evoking memories. Affect and memory then colour evaluations and behaviour. Congruence between scent and product moderates the effect.
Sensory branding in retail and hospitality. Hotels, airlines, and retailers have widely reported using signature scents in lobbies, cabins, and stores to create a recognisable and pleasant atmosphere. The research above suggests three design principles. First, pleasantness and presence do much of the work (Spangenberg, Crowley, and Henderson 1996), so a subtle, broadly liked scent is safer than an intense or polarising one. Second, congruence matters (D. J. Mitchell, Kahn, and Knasko 1995): a scent should fit the category and brand (fresh linen for bedding, not for a bakery). Third, because odours are strongly tied to memory (Willander and Larsson 2007), a consistent signature scent can become a retrieval cue for the brand itself, but only if it is used consistently over time and across locations. Firms should test effects with controlled store or time-slot experiments and monitor customers and employees who are sensitive to fragrances.
30.13 Bullwhip Effect
Core claim. Fluctuations in orders grow larger as they move upstream in a supply chain, from consumers to retailers, wholesalers, distributors, and manufacturers, even when end-consumer demand is stable.
Origins. System dynamics and operations management. Simulated by Forrester (1961), demonstrated experimentally in the beer distribution game (Sterman 1989), and named and analysed by H. L. Lee, Padmanabhan, and Whang (1997a) and H. L. Lee, Padmanabhan, and Whang (1997b).
Level of analysis. Supply chain (inter-organizational system).
Key constructs. Order variance amplification, demand signal processing, order batching, price fluctuation, rationing and shortage gaming, lead time, supply line, information sharing.
Boundary conditions. Strongest when members forecast from the orders they receive rather than from end demand, when lead times are long, and when promotions or allocation rules create incentives to distort orders. Production smoothing can offset it.
Related theories. Wisdom of the crowd, Bounded rationality (Section 23.1), Transaction cost economics (Section 6.3), Information asymmetry (Section 8.1).
30.13.1 Core logic
Each member of a supply chain sees only the orders placed by its immediate customer, not the demand of final consumers. When it forecasts from those orders, adjusts inventory targets, and adds its own ordering rules, it passes on a signal that is noisier than the one it received. Repeated at every stage, the noise compounds. Forrester (1961) showed with simulation models that delays and ordering policies could turn small changes in retail sales into large swings in factory production. H. L. Lee, Padmanabhan, and Whang (1997a) named the phenomenon the bullwhip effect and identified four causes. Crucially, they showed that each can arise from rational decisions by individual members, not only from mistakes (Table 30.7).
| Cause | Mechanism | Typical remedy |
|---|---|---|
| Demand signal processing | Each stage updates forecasts and safety stocks from the orders it receives, so random changes look like trends | Share point-of-sale data, shorten lead times, vendor-managed inventory |
| Order batching | Fixed ordering costs and full-truckload economics lead to infrequent, lumpy orders | Lower transaction costs (electronic ordering), mixed-product shipments |
| Price fluctuation | Promotions and trade deals encourage forward buying, so orders no longer track consumption | Everyday low pricing, limits on forward buying |
| Rationing and shortage gaming | When supply is allocated in proportion to orders, buyers inflate orders and cancel later | Allocate on past sales, restrict cancellations, share capacity information |
Figure 30.11 isolates the first cause. Consumer demand is stationary. Every stage uses the same reasonable rule: forecast demand with a moving average of recent incoming orders and order enough to bring inventory up to a target that covers the replenishment lead time. Nothing irrational happens, yet order variability grows at every step.

Figure 30.11: Illustrative simulation of demand signal processing. Consumer demand is stationary (mean 100, standard deviation 5). Each stage forecasts with a six-period moving average of the orders it receives and follows an order-up-to rule with a two-period lead time. Variance multiples relative to consumer demand are shown in the panel titles. Simulated data, not an actual supply chain.
The amplification in the figure is not an accident of the parameters. F. Chen et al. (2000) derived a lower bound for the increase in order variance at a single stage that uses a moving-average forecast: it grows with the lead time and falls with the number of observations in the forecast. Longer lead times and more reactive forecasts mean more amplification.
The other three causes add to this baseline, and two of them originate in marketing decisions. Order batching turns smooth consumption into periodic spikes because buyers accumulate demand until an order is worth placing. Price fluctuation is the marketing department’s contribution: a trade promotion that offers a temporary discount invites retailers to buy far more than they will sell during the deal and then to stop ordering, so the manufacturer sees a surge followed by a drought that has nothing to do with consumption. Rationing and shortage gaming occurs when a product is scarce and the supplier allocates in proportion to orders. Buyers then order more than they need, and the phantom orders disappear as soon as supply recovers, leaving the supplier with excess capacity built for demand that never existed (H. L. Lee, Padmanabhan, and Whang 1997a). For managers, the implication is that supply-chain volatility is often self-inflicted, and that pricing and promotion policies should be evaluated for their upstream effects as well as for their effect on sales.
30.13.2 The beer game and the behavioural account
The best-known demonstration is the beer distribution game, a classroom simulation developed at MIT in which four players manage a retailer, a wholesaler, a distributor, and a factory. Sterman (1989) analysed the decisions of many teams. Consumer demand in the game changes only once, a single step increase early on, yet orders and inventories oscillate with growing amplitude up the chain. Sterman showed that players’ decisions are well described by an anchoring-and-adjustment heuristic that gives too little weight to the supply line, the orders already placed but not yet received. Players reorder because inventory is low, forget that earlier orders are on the way, and then find themselves swamped. In debriefings, players often attribute the swings to erratic customer demand, even though demand changed only once. The lesson is that the structure of a system with delays can defeat intelligent people who see only part of it.
Rational or behavioural, and how common? H. L. Lee, Padmanabhan, and Whang (1997a) show that the bullwhip effect can arise even when every member optimises, so remedies must change information and incentives. Sterman (1989) shows that bounded rationality adds a further, behavioural source, so training and decision support also matter. A second debate concerns prevalence. Using industry-level data, Cachon, Randall, and Schmidt (2007) found that amplification is common in wholesale industries but much less evident in many retail and manufacturing industries, where firms smooth production relative to demand. The bullwhip effect is a robust tendency of supply-chain structure, not a law that every firm exhibits.
Procter & Gamble and Pampers. In the case that gave the effect its name, H. L. Lee, Padmanabhan, and Whang (1997b) describe how Procter & Gamble’s logistics executives examined orders for Pampers disposable diapers. Babies consume diapers at a steady rate, and retail sales varied only modestly. Distributors’ orders to P&G, however, swung far more, and P&G’s own orders to its suppliers swung more still. The pattern had no basis in consumption. It reflected forecasting from orders, batching, and the forward buying encouraged by trade promotions. The remedies discussed by Lee and colleagues map onto the four causes: sharing sell-through data with upstream partners, vendor-managed inventory and continuous replenishment, smaller and more frequent orders, and stable pricing. P&G’s move toward everyday low pricing in the 1990s is often discussed as a response to the price-fluctuation cause.
Sample hypotheses. H1. Firms that receive point-of-sale data from downstream partners will show lower ratios of order variance to demand variance. H2. Trade-promotion intensity will increase upstream order variability more than retail sales variability. H3. Experimental participants who are shown the supply line will exhibit less amplification.
Measures. The bullwhip ratio (variance of orders or production divided by variance of demand), computed at the product, firm, or industry level.
Designs. Firm-level panel data on shipments and sales (Cachon, Randall, and Schmidt 2007), before-and-after studies of information-sharing programmes, and laboratory beer games that manipulate information and lead times (Sterman 1989).
30.14 Chapter Summary
- Phenomena are robust regularities that theories explain. Knowing the mechanism behind a phenomenon tells managers when it will appear and how to design around it (Bogen and Woodward 1988).
- Similarity is directional: variants seem more similar to prototypes than the reverse, which favours challengers in comparisons (Tversky 1977).
- Homophily and assortative mating sort networks and couples by similarity through both opportunity and choice, with consequences for information flow and inequality (McPherson, Smith-Lovin, and Cook 2001, C. R. Schwartz and Mare 2005).
- Others act as a social magnet, attracting imitation and provoking differentiation (Berger 2016).
- Crowds are wise when judgements are diverse, independent, and aggregated. Social influence, shared sources (pack journalism), and cohesive insulation (groupthink) destroy that wisdom (Surowiecki 2005, Lorenz et al. 2011, Janis 1982).
- Cumulative advantage amplifies small early differences into large, partly arbitrary inequalities (Merton 1968b, Salganik, Dodds, and Watts 2006).
- Social loafing, the bystander effect, and the tragedy of the commons all arise when responsibility or reward is diffused. Identifiability, explicit assignment, and well-designed institutions counteract them (Karau and Williams 1993, Fischer et al. 2011, Ostrom 1990).
- Scent is closely tied to emotion and memory and can shape evaluations, especially when congruent with the product (Willander and Larsson 2007, Spangenberg, Crowley, and Henderson 1996).
Table 30.8 presents the comparison of the chapter’s phenomena.
| Phenomenon | Core mechanism | Key moderator | Managerial lever |
|---|---|---|---|
| Similarity asymmetry | Focus on the subject’s distinctive features | Difference in prominence | Frame comparisons with the challenger as subject |
| Homophily | Opportunity plus similarity-attraction | Composition of foci | Diversify meeting contexts and referral pools |
| Assortative mating | Preference and opportunity in matching markets | Educational and social sorting | Balance similarity and exploration in matching |
| Social magnet | Imitation versus identity-driven divergence | Identity relevance, out-group adoption | Offer variants within popular platforms |
| Wisdom of the crowd | Error cancellation through aggregation | Independence of errors | Collect private estimates, average them |
| Groupthink | Concurrence seeking | Insulation, directive leadership | Devil’s advocate, pre-mortem |
| Pack journalism | Imitation and informational cascades | Monitoring cost, uncertainty | Track original sources, not mentions |
| Matthew effect | Cumulative advantage | Uncertainty about quality | Randomise exposure, judge per-exposure performance |
| Social loafing | Weakened effort-outcome link | Identifiability, meaningfulness | Small teams, named owners |
| Bystander effect | Diffusion of responsibility | Danger, explicit assignment | Assign a single accountable owner |
| Tragedy of the commons | Externalities under open access | Institutions for monitoring and sanctions | Apply Ostrom’s design principles |
| Scent and emotion | Olfactory-emotional processing | Congruence, pleasantness | Subtle, congruent signature scents |
| Bullwhip effect | Local forecasting and ordering amplify demand signals | Lead time, batching, promotions | Share point-of-sale data, shorten lead times |
30.15 Discussion Questions
- Tversky’s contrast model implies that the leader in a category should avoid comparative advertising that names a challenger. Design an experiment to test this implication and identify one boundary condition under which it might fail.
- A platform finds that users who follow similar accounts adopt the same new features. Explain why this correlation cannot by itself establish peer influence, and propose a design that could separate homophily from contagion.
- Your firm’s quarterly demand forecast is produced in a meeting chaired by the head of sales. Using the wisdom-of-crowds conditions and the groupthink model, redesign the process. What would you measure to know whether the redesign worked?
- Pack journalism and the Matthew effect both involve imitation. How do their mechanisms differ, and what does each imply for a start-up seeking media attention?
- Social loafing, the bystander effect, and the tragedy of the commons have been described as variants of one underlying problem. What is that problem, and where do the three phenomena differ in mechanism and remedy?
- A retailer plans to roll out a signature scent across 200 stores. Propose a rollout that doubles as a field experiment, specifying outcomes, controls, and potential confounds.
30.16 Further Reading
- Tversky (1977): the original statement of the contrast model. Still the best introduction to why similarity is not symmetric.
- McPherson, Smith-Lovin, and Cook (2001): the definitive review of homophily, its forms, and its sources.
- Surowiecki (2005): an accessible synthesis of when crowds are wise and when they are not. Pair it with Lorenz et al. (2011) for the experimental limits.
- Larrick and Soll (2006): a rigorous and practical analysis of why averaging works and why people underuse it.
- Salganik, Dodds, and Watts (2006): an elegant experiment showing how social influence creates inequality and unpredictability in cultural markets.
- Karau and Williams (1993): the meta-analysis and theoretical integration that turned social loafing into a design problem.
- Ostrom (1990): the classic empirical answer to Hardin. Essential for anyone who manages shared resources.
- Krishna (2012): an integrative review of sensory marketing, including scent.
30.4 Social Magnet
Core claim. Other people act like a magnet on our choices: sometimes they attract (we imitate and conform), sometimes they repel (we diverge to stay distinct), and often they do both at once.
Origins. Consumer and social psychology. Synthesised in Berger (2016), building on research on imitation (Chartrand and Bargh 1999), identity signaling (Section 8.5) (Berger and Heath 2007), and optimal distinctiveness (Section 22.3) (Brewer 1991).
Level of analysis. Individual choice within social groups.
Key constructs. Imitation, conformity, divergence, identity relevance, in-group and out-group, optimal distinctiveness.
Boundary conditions. Attraction dominates when others are similar and the domain is not identity-relevant. Repulsion dominates when the others are a dissimilar out-group or when the domain signals identity.
Related theories. Optimal distinctiveness (Section 22.3), Identity signaling (Section 8.5), Conformity (Section 22.4), Snob effect (Section 29.5), Social norms (Section 22.5).
Berger (2016) uses the image of a magnet to capture a duality that much theory treats separately. On one side, people imitate others, often without awareness: in conversation they mirror posture and mannerisms, a pattern Chartrand and Bargh (1999) called the chameleon effect, and mimicry smooths interactions. On the other side, people avoid choices that would make them look like someone they are not. Berger and Heath (2007) show that consumers abandon tastes once dissimilar out-groups adopt them, especially in identity-relevant domains such as music, clothing, and cars.
The two forces combine in the “same but different” pattern. Optimal distinctiveness theory holds that people seek a balance between belonging and uniqueness (Brewer 1991). Consumers therefore often choose the category the group chooses but a variant that distinguishes them: the same brand of sneaker in a less common colour, the same popular restaurant but an unusual dish (Berger 2016). Figure 30.3 organizes these forces.
Figure 30.3: The social magnet: others’ choices pull people toward imitation when the source is similar and the domain is functional, and push people toward differentiation when the source is a dissimilar out-group or the domain signals identity. The joint result is often ‘same category, different variant’.
Positioning between belonging and distinctiveness. Product lines that offer customization within a popular platform, configurable colours on a best-selling shoe, personalised engraving on a mass-market phone case, exploit both poles of the magnet. The platform supplies social proof and belonging. The variant supplies distinctiveness. Segments high in need for uniqueness, or whose identity is threatened by an out-group’s adoption of the brand, require more visible differentiation. Segments seeking reassurance require less.