12 Innovation and Entrepreneurship
In 1972 the British music and electronics company EMI unveiled the first commercial computed tomography (CT) scanner, the work of its engineer Godfrey Hounsfield, who later shared the 1979 Nobel Prize in Physiology or Medicine for the invention. Within a few years, established medical-equipment makers such as General Electric had overtaken EMI in the market it had created, and EMI soon left the business. Two decades later, Apple entered a mobile-phone industry it had not invented and captured a share of industry profits far larger than its share of units. Why do some pioneers capture the value of their innovations while others hand it to imitators? Why do well-managed incumbents so often lose to entrants with inferior products? And how do founders build ventures when the market they are aiming at does not yet exist?
This chapter assembles the theories that management scholars use to answer those questions. The first half concerns innovation: how new technologies replace old ones (creative destruction), why incumbents stumble (disruptive and architectural innovation), how industries settle on dominant designs, who profits from a new technology (profiting from innovation), and how firms draw on external knowledge (open innovation). The second half concerns entrepreneurship: how opportunities arise (discovery and creation), how expert founders reason under uncertainty (effectuation), how they build with whatever is at hand (bricolage), and why young organizations die at high rates (liability of newness). The theories complement those on Dynamic capabilities (Section 5.1) in Chapter 5 and on Diffusion of innovations (Section 10.1) in Chapter 10. Where those chapters ask how firms renew themselves and how adopters take up new products, this chapter asks where innovations come from, whom they destroy, and who captures their value (Table 12.1).
| Theory | Core question | Level of analysis | Key source |
|---|---|---|---|
| Creative destruction | How does innovation drive economic change and growth? | Economy / industry | Schumpeter (1934, 1942), Aghion & Howitt (1992) |
| Disruptive innovation | Why do well-run incumbents lose to inferior entrants? | Firm / industry | Bower & Christensen (1995), Christensen (1997) |
| Profiting from innovation | Who captures the value an innovation creates? | Firm / industry | Teece (1986) |
| Architectural innovation | Why do small changes in product architecture defeat incumbents? | Firm / product | Henderson & Clark (1990) |
| Dominant design and technology cycles | How do industries converge on one design, and what follows? | Industry / technology | Abernathy & Utterback (1978), Anderson & Tushman (1990) |
| Open innovation | When should firms use external ideas and paths to market? | Firm | Chesbrough (2003), Laursen & Salter (2006) |
| Effectuation | How do expert entrepreneurs decide under uncertainty? | Individual / venture | Sarasvathy (2001) |
| Opportunity discovery and creation | Do entrepreneurs find opportunities or make them? | Individual / market | Shane & Venkataraman (2000), Alvarez & Barney (2007) |
| Bricolage | How do resource-poor ventures build something from nothing? | Venture | Baker & Nelson (2005) |
| Liability of newness | Why do young organizations fail at higher rates? | Organization / population | Stinchcombe (1965), Freeman, Carroll & Hannan (1983) |
12.1 Creative Destruction
Core claim. Capitalist economies develop through innovation, the carrying out of new combinations, which creates new products, firms, and industries while destroying the value of the old ones. Temporary monopoly profits from innovation are both the reward and the engine of the process.
Origins. Economics. Schumpeter (1934), first published in German in 1911, introduced the entrepreneur as the agent of “new combinations”. Schumpeter (1942) coined the phrase creative destruction and shifted attention to the research laboratories of large firms. Aghion and Howitt (1992) formalized the idea in endogenous growth theory.
Level of analysis. Economy and industry, with the entrepreneur or innovating firm as the micro-level agent.
Key constructs. New combinations, entrepreneur, innovation rents, imitation, obsolescence, business stealing, quality ladder.
Boundary conditions. Strongest where innovations are rivalrous with existing products and where rents can be captured for a time. Weaker for innovations that complement rather than replace existing goods.
Related theories. Dynamic capabilities (Section 5.1), Disruptive innovation, Organizational ecology (Section 7.5), Competitive dynamics (Section 11.3).
12.1.1 Origins and intellectual history
Joseph Schumpeter broke with the equilibrium economics of his day by arguing that the essential feature of capitalism is not price competition among identical firms but change from within. In The Theory of Economic Development (Schumpeter 1934) he defined development as the carrying out of new combinations, and he listed five forms: a new good or a new quality of a good, a new method of production, the opening of a new market, the conquest of a new source of supply, and the reorganization of an industry, for example by creating or breaking up a monopoly position. The agent who carries out new combinations is the entrepreneur, a role defined by function rather than by ownership: a manager who introduces a new combination is acting entrepreneurially, while a capitalist who merely supplies funds is not.
Three decades later, Capitalism, Socialism and Democracy (Schumpeter 1942) gave the process its famous name. Creative destruction describes how new goods, methods, and organizational forms incessantly revolutionize the economic structure from within, destroying the old one and creating a new one. The book also changed the protagonist. The lone entrepreneur of 1911 gave way to the large corporation whose research laboratory routinizes innovation. Later scholars labelled these two pictures Schumpeter Mark I (entry by new firms drives innovation) and Schumpeter Mark II (established firms with large research budgets drive it). Whether small or large firms innovate more remains an active empirical question.
12.1.2 Core logic and propositions
The logic can be stated as a short chain. Innovation creates a temporary monopoly. The monopoly yields innovation rents (profits above the competitive level). The rents attract imitators and further innovators, who erode them and, in time, render the original innovation obsolete. Growth therefore comes in waves of innovation, imitation, and replacement rather than as a smooth accumulation of capital.
Aghion and Howitt (1992) built this idea into a formal model of economic growth. Research firms compete to produce the next improvement in an intermediate good. Each successful innovation makes the previous generation obsolete, so the innovator earns monopoly profits only until the next innovation arrives. Two implications follow. First, the expected value of research falls when future research is expected to be intense, because rents will be short-lived. Second, private and social returns to research diverge: innovators ignore the profits they destroy for incumbents (the business-stealing effect) and the benefits their ideas provide to future innovators (an intertemporal spillover). Equilibrium growth can therefore be either too fast or too slow relative to the social optimum.
- P1 (Rents drive effort). Innovative effort increases with the size and expected duration of the rents an innovation can earn.
- P2 (Obsolescence). Each successful innovation reduces the value of the assets, skills, and firms tied to the technology it replaces.
- P3 (Turnover). Industries with higher rates of innovation exhibit higher rates of entry, exit, and turnover in market leadership.
- P4 (Competition and innovation). The effect of product-market competition on innovation is non-monotonic: competition encourages firms to innovate to escape rivals but reduces the rents that reward innovation.
12.1.3 Mechanism
Figure 12.1 summarizes the cycle. The dashed feedback edge is the key to the dynamic: rents attract the next wave of innovators whose success destroys the current incumbents.
Figure 12.1: The cycle of creative destruction. A new combination yields temporary rents that attract imitators and new innovators. Their success erodes rents and makes the incumbent technology obsolete, restarting the cycle.
12.1.4 Evidence and extensions
The macroeconomic literature on Schumpeterian growth has grown into a large research programme that links innovation to firm entry, exit, and reallocation. An influential empirical extension concerns P4. Using panel data on British industries, Aghion et al. (2005) found an inverted-U relationship between product-market competition and patenting. When competition is weak, more of it spurs innovation because firms that innovate can escape their rivals. When competition is already intense, more of it discourages innovation because laggards expect little reward from catching up. The result reconciles the Mark I view (competition spurs innovation) with the Mark II view (market power funds it), at least in the setting studied.
At the firm level, creative destruction underpins much of the strategy literature on technological change. Tushman and Anderson (1986) showed that discontinuous technologies alter the competitive landscape of entire industries, and the theories of disruptive, architectural, and competence-destroying change can be read as specifications of when the destructive half of the process falls on incumbents.
Is destruction the right word? Critics note that many innovations complement rather than replace existing assets, and that incumbents often survive technological transitions by controlling complementary assets (Tripsas 1997, Teece 1986). In Tripsas’s study of typesetting, incumbents survived three generations of competence-destroying technology when they owned specialized assets such as font libraries and sales networks. Creative destruction is therefore best treated as a tendency whose incidence on particular firms depends on the conditions specified by the more specific theories below. A second debate is normative: because the Aghion and Howitt model shows that equilibrium innovation can be either excessive or deficient, the theory does not by itself justify either stronger or weaker patent protection.
12.1.5 Applications in business
The smartphone as a destroyer of categories. The diffusion of smartphones after 2007 illustrates every element of Schumpeter’s account. A single new good combined functions previously sold as separate products: standalone satellite-navigation devices, compact digital cameras, portable music players, and handheld game consoles. Each of these categories contracted as the smartphone absorbed its function, and firms built around them had to reinvent themselves or shrink. The same innovation created new industries (mobile apps, ride-hailing, mobile payments) and new rents for the firms that controlled the platform. For a strategist, the lesson is that the relevant competitive threat may come not from a rival in one’s own category but from a new combination that makes the category unnecessary.
Sample hypotheses.
- H1. Industries with higher patenting intensity will exhibit higher annual turnover among the top four firms by market share.
- H2. The relationship between industry concentration and new-product introductions will be inverted-U shaped.
Designs. Firm and industry panels linking patents or product introductions to entry, exit, and market-share turnover. Natural experiments that change competitive pressure (trade liberalization, deregulation, patent-term changes).
Measures. Patent counts and forward citations, product-introduction databases, firm entry and exit from business registers, rank turnover among leaders, price-cost margins as a proxy for competition.
12.2 Disruptive Innovation
Core claim. Incumbents tend to win battles of sustaining innovation that improve products along dimensions their best customers value, but they tend to lose to disruptive innovations that start as inferior, cheaper, or more convenient offerings for overlooked customers and then improve until they satisfy the mainstream.
Origins. Strategy and technology management. Bower and Christensen (1995) introduced the idea in practitioner form. Christensen (1997) developed it from a study of the disk-drive industry. Christensen, Raynor, and McDonald (2015) restated the theory and its boundaries.
Level of analysis. Firm and industry, with resource-allocation processes inside the incumbent firm as the micro-mechanism.
Key constructs. Sustaining versus disruptive innovation, performance trajectories, performance oversupply, value network, low-end and new-market footholds, resource allocation.
Boundary conditions. Applies when technology improves faster than mainstream customers’ needs, when the entrant begins in a segment incumbents find unattractive, and when incumbents’ resource-allocation processes are tied to existing customers and margins. Does not describe every successful entrant.
Related theories. Exploration and exploitation (Section 5.3), Ambidexterity (Section 5.4), Resource dependence theory (Section 7.1), Architectural innovation.
12.2.1 Origins and intellectual history
Clayton Christensen began with a puzzle from the disk-drive industry. Leading manufacturers of 14-inch drives were technically excellent and closely attuned to their customers, yet they missed the shift to 8-inch drives, whose early products had lower capacity but suited the emerging minicomputer market. The same pattern repeated at the transitions to 5.25-inch drives (desktop computers) and 3.5-inch drives (portable computers). Christensen and Rosenbloom (1995) introduced the concept of the value network, the context of customers, suppliers, and cost structures within which a firm defines and solves problems, and argued that incumbents fail when a technology’s initial value lies outside their value network. Christensen and Bower (1996) traced the mechanism to customer power: firms allocate resources to projects that their most profitable customers demand, which starves projects aimed at small, low-margin markets. Christensen (1997) synthesized the argument in The Innovator’s Dilemma.
12.2.2 Core logic and propositions
The theory rests on two trajectories. The first is the trajectory of performance demanded by customers in a market tier, which rises slowly. The second is the trajectory of performance supplied by a technology, which rises faster as firms pursue sustaining improvements. Because supply outpaces demand, incumbents eventually overshoot what mainstream customers can use. A disruptive entrant begins below mainstream needs but serves a foothold market, either the least demanding customers (a low-end foothold) or people who previously did not consume the product at all (a new-market foothold). As the entrant’s technology improves, it becomes good enough for the mainstream while retaining its advantages in cost, simplicity, or convenience (Christensen, Raynor, and McDonald 2015).
- P1 (Sustaining advantage). Incumbents usually prevail in sustaining innovations, whether incremental or radical, that serve their existing customers.
- P2 (Overshooting). When performance supplied exceeds performance demanded, the basis of competition shifts toward convenience, customization, and price.
- P3 (Asymmetric motivation). Incumbents rationally decline to pursue foothold markets because those markets are small and offer lower margins than the core business.
- P4 (Process, not event). Disruption unfolds over years. Its outcome depends on whether the entrant’s trajectory reaches mainstream needs before incumbents respond.
Figure 12.2 reproduces the classic diagram with stylised values.
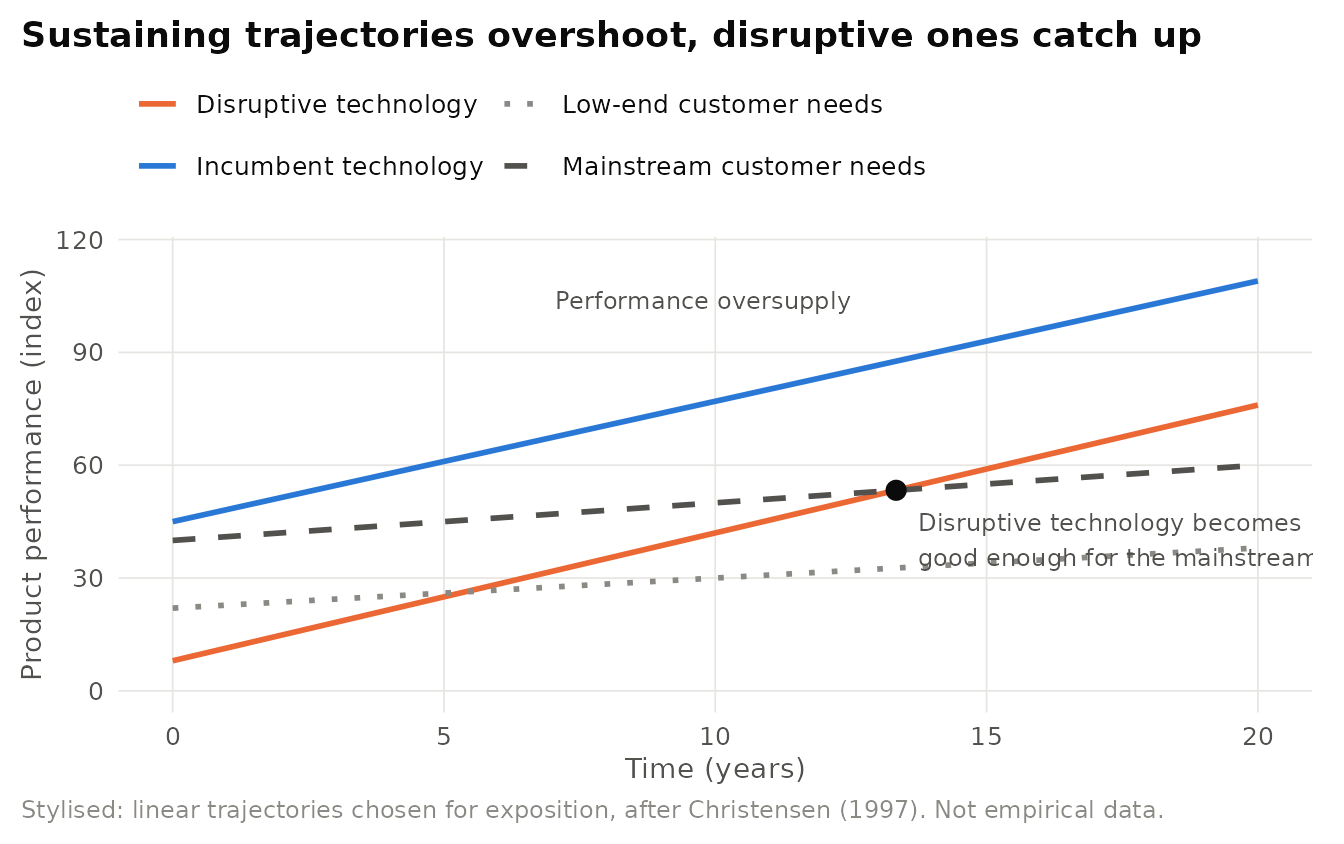
Figure 12.2: Stylised performance trajectories in disruptive innovation. Incumbents’ sustaining improvements overshoot what mainstream customers can use, while a disruptive technology starts below mainstream needs and improves until it is good enough. Illustrative values only.
Table 12.2 distinguishes the two footholds from sustaining innovation.
| Dimension | Sustaining innovation | Low-end disruption | New-market disruption |
|---|---|---|---|
| Target customers | Most demanding, most profitable customers | Over-served customers at the bottom of the market | Non-consumers who lacked money, skill, or access |
| Initial performance | Better on established attributes | Good enough on established attributes | Worse on established attributes, better on new ones |
| Business model | Existing margins and cost structure | Lower cost, lower price | New value network |
| Incumbent response | Fight and usually win | Retreat up-market to protect margins | Ignore, because the market looks small |
| Examples discussed in the literature | Successive gains in drive capacity | Minimills in steel | Personal computers relative to minicomputers |
12.2.3 Evidence and extensions
The disk-drive evidence in Christensen (1997) remains the core of the theory, and Christensen and Rosenbloom (1995) and Christensen and Bower (1996) provide the more formal academic statements. R. Henderson (1993) offered a complementary analysis of photolithographic equipment, arguing that incumbents’ failures reflected both rational underinvestment, because new technologies cannibalize existing rents, and organizational incompetence, because embedded routines hinder new learning. That distinction matters: a theory of incentives implies that incumbents choose not to respond, whereas a theory of capabilities implies that they cannot. The managerial prescription in Christensen (1997), an autonomous unit with a cost structure suited to the new market, addresses both, and it anticipates the literature on structural ambidexterity (Section 5.4).
How useful is the theory of disruptive innovation? In a widely read essay, Lepore (2014) criticized the theory’s case selection, argued that several firms described as disrupted had in fact prospered, and questioned whether the theory could predict rather than merely redescribe. A. A. King and Baatartogtokh (2015) asked experts to assess cases cited as disruptions in Christensen’s books against the theory’s core conditions, such as incumbents overshooting customer needs and having the capability to respond but failing to do so, and found that only a small minority of cases met all of them. Christensen, Raynor, and McDonald (2015) replied in part by narrowing the concept: disruption refers to a process that starts from a low-end or new-market foothold, and many successful entrants (they cite Uber in its home market) are not disruptive in this sense. The exchange illustrates a general lesson about theory from Chapter 2: a concept stretched to cover every case loses its explanatory power. Scholars who use the theory should measure its conditions rather than infer them from outcomes.
12.2.4 Applications in business
Netflix and Blockbuster. Christensen, Raynor, and McDonald (2015) use Netflix as an example of disruption done right. Its DVD-by-mail service, launched in the late 1990s, appealed to a small set of customers, among them early adopters of DVD players and online shoppers, but did not suit the typical Blockbuster customer who wanted a new release on impulse. Blockbuster had little reason to respond. Netflix’s move to streaming then improved the offering until it served the mainstream, and Blockbuster filed for bankruptcy in 2010. The case is analysed from the perspective of capability renewal in Chapter 5 (see Dynamic capabilities (Section 5.1)). Read through disruption theory, the instructive feature is that Netflix’s initial inferiority on immediacy was what kept the incumbent from fighting back.
Sample hypotheses.
- H1. Incumbents will be slower to enter a new product segment when the segment’s initial customers overlap little with their existing customer base.
- H2. The hazard of incumbent exit after the entry of a low-cost technology will be higher when the incumbent’s products exceed the performance demanded by the median customer.
Designs. Industry histories that code product performance and customer requirements over time. Event-history models of incumbent entry into new segments. Pre-registered ex ante classification of innovations as sustaining or disruptive, followed by prospective tracking.
Measures. Product performance on key attributes, customer-requirement surveys, overlap between new-segment and core customers, internal resource allocation to new versus core projects.
Calling every successful entrant disruptive. Disruption is a specific process with stated conditions: an inferior foothold product, a faster-improving trajectory, and an incumbent with rational reasons not to respond. Labelling a case “disruptive” because the incumbent lost is circular. Classify innovations before outcomes are known and report the cases that did not follow the predicted path.
12.3 Profiting from Innovation
Core claim. Innovators often fail to profit from their innovations. Whether the innovator, imitators, or the owners of complementary assets capture the value depends on the appropriability regime, the stage of the dominant design, and access to complementary assets.
Origins. Strategy and industrial organization. Teece (1986), revisited in Teece (2006).
Level of analysis. Firm (innovator, imitator, asset owner) within an industry.
Key constructs. Appropriability regime (tight or weak), legal protection, tacit versus codified knowledge, pre-paradigmatic and paradigmatic phases, complementary assets (generic, specialized, cospecialized), contracting versus integration.
Boundary conditions. Most relevant for product and process innovations that require downstream manufacturing, distribution, or service to reach customers. Less relevant for innovations sold as pure intellectual property in efficient markets for technology.
Related theories. Resource-based theory (Section 4.1), Transaction cost economics (Section 6.3), First-mover advantage (Section 11.5), Network effects (Section 17.6).
12.3.1 Origins and intellectual history
Teece (1986) began from a set of puzzling outcomes. EMI invented the CT scanner and lost the market. RC Cola introduced diet cola before Coca-Cola and Pepsi, yet the large brands dominated the category. Other pioneers, such as Pilkington with float glass, did capture the value of their inventions. Teece argued that these outcomes are not accidents of management but reflect three structural features of the innovation’s environment. The article became one of the most cited in strategic management and laid foundations for later work on ecosystems, platforms, and dynamic capabilities (Section 5.1) (Teece 2006).
12.3.2 Core logic and propositions
The first building block is the appropriability regime: the extent to which the innovator can prevent imitation. It depends on legal instruments (patents, copyright, trade secrets) and on the nature of the knowledge. Tacit knowledge that is hard to articulate is easier to protect than codified knowledge that can be read from a product or a patent. Regimes are tight when imitation is difficult and weak when it is easy. Teece stressed that tight regimes are the exception: in most industries patents are easy to invent around.
The second is the dominant design paradigm. Early in an industry’s life (the pre-paradigmatic phase), many designs compete. Once a dominant design emerges, competition shifts to price and scale. An innovator with a weak regime may find that its early design is not the one that wins (see Dominant design).
The third is complementary assets: the capabilities and assets needed to commercialize an innovation, such as manufacturing, distribution, service, brand, and complementary technologies. Generic assets are available on competitive terms. Specialized assets have a one-way dependence with the innovation. Cospecialized assets have a mutual dependence. When the regime is weak and the needed complementary assets are specialized and scarce, the owners of those assets are in a strong bargaining position and capture much of the value.
- P1 (Tight regimes favour innovators). Under a tight appropriability regime, the innovator is likely to capture a large share of the value it creates, whether by producing or by licensing.
- P2 (Weak regimes and timing). Under a weak regime, the innovator’s position deteriorates once a dominant design emerges and competition shifts to complementary assets.
- P3 (Asset ownership). When complementary assets are specialized and scarce, owners of those assets (incumbents or fast followers) tend to capture value at the innovator’s expense.
- P4 (Integration choice). An innovator should integrate into specialized complementary assets when the regime is weak, the assets are critical, and the innovator can afford to build or buy them in time, and should contract for them otherwise.
12.3.3 Mechanism
Figure 12.3 expresses the argument as a decision logic.
Figure 12.3: The logic of profiting from innovation. Tight appropriability favours the innovator. Under weak appropriability, value flows to whoever controls specialized complementary assets once a dominant design has emerged. Adapted from the argument in Teece (1986).
Table 12.3 summarizes who tends to win under each configuration, with examples Teece discussed.
| Configuration | Likely winner | Reason | Example in Teece (1986) |
|---|---|---|---|
| Tight regime, any asset position | Innovator | Imitation is blocked, so the innovator can produce or license on favourable terms | Pilkington float glass |
| Weak regime, generic complementary assets | Customers and many imitators | Anyone can copy and contract for the assets, so rents compete away | Many consumer products after a design stabilizes |
| Weak regime, specialized assets held by innovator | Innovator | Imitators cannot reach customers without assets the innovator controls | Integrated firms that own manufacturing and distribution |
| Weak regime, specialized assets held by others | Imitators or asset owners | Owners of manufacturing, brand, distribution, or service extract the value | EMI and the CT scanner, RC Cola and diet cola |
| Pre-paradigmatic phase, weak regime | Uncertain | The innovator’s design may not become dominant, and positioning for the eventual design matters most | Early entrants in many new product categories |
12.3.4 Evidence and extensions
Tripsas (1997) provided some of the most careful evidence. Across a century of the typesetter industry, incumbents that held specialized complementary assets survived waves of competence-destroying technology that would otherwise have removed them. Gans and Stern (2003) extended the framework to entrepreneurial strategy: a start-up should cooperate with incumbents (for instance by licensing or being acquired) when its intellectual property is strong and incumbents control the needed complementary assets, and compete in the product market when neither holds. In his reflections, Teece (2006) noted that the framework anticipated later work on business ecosystems and platforms, where control of a few critical complements, such as an operating system or an app store, can determine who captures value from many other firms’ innovations.
How weak are weak regimes? Teece’s emphasis on complementary assets assumes that patents are usually weak. In pharmaceuticals and specialty chemicals, patents are strong and innovators often capture value through licensing. In software and digital services, by contrast, network effects and data can act as complementary assets that are themselves created by the innovation, blurring the line between the innovation and its complements. Critics also note that the framework is easier to apply in hindsight than in prospect, because which assets will become specialized depends on which design wins.
12.3.5 Applications in business
EMI and the CT scanner. EMI’s scanner was a genuine breakthrough, but selling and supporting sophisticated equipment to hospitals required a sales force, service network, and relationships with radiologists, especially in the United States, that established medical-electronics firms possessed and EMI did not. The underlying ideas could be engineered around. Firms with those complementary assets, including General Electric, entered quickly, and EMI exited the scanner business within a decade of launch (Teece 1986). The lesson is not that EMI should not have innovated but that its commercialization strategy needed either a partner that owned the complementary assets or an early, deliberate investment in building them.
The iPhone and complementary assets. Apple’s 2007 iPhone was neither the first smartphone nor the first touchscreen phone, and many of its features were quickly imitated. Yet Apple has captured a share of industry profits well above its share of unit sales. Teece’s framework explains why. Apple held a portfolio of complementary assets that rivals could not easily replicate: a premium brand, its own retail stores (opened from 2001), the iTunes content and payment infrastructure, deep supply-chain relationships, and, from 2008, the App Store, which turned third-party developers into cospecialized complements. As a dominant design for touchscreen smartphones emerged, competition shifted to exactly these assets. Apple was a follower in the product category but an innovator in assembling complements around it.
Sample hypotheses.
- H1. The positive effect of being first to market on long-run market share will be weaker when patent protection in the industry is weak.
- H2. Technology start-ups will be more likely to license or be acquired than to enter the product market when incumbents control specialized manufacturing or distribution assets.
Designs. Industry histories with event-history models of survival, comparisons across industries that differ in patent effectiveness, and commercialization-mode choice models for start-ups.
Measures. Survey measures of appropriability (patent effectiveness, secrecy, lead time), ownership of downstream assets (sales force, service network, manufacturing plants), licensing and acquisition events.
Equating invention with value capture. Many business plans assume that a patent or a technical lead guarantees profits. Teece’s framework implies that the right question is “Who controls the assets needed to bring this to customers, and what happens after the design stabilizes?” Map the complementary assets before choosing whether to build, partner, or license.
12.4 Architectural Innovation
Core claim. Innovations that reconfigure how existing components are linked together, while leaving the components largely unchanged, can destroy the value of incumbents’ architectural knowledge and are especially hard for incumbents to recognize and exploit.
Origins. Technology management. R. M. Henderson and Clark (1990), based on the photolithographic alignment equipment industry.
Level of analysis. Product and firm, with the organization’s communication channels and information filters as the micro-mechanism.
Key constructs. Component knowledge, architectural knowledge, core design concepts, linkages, incremental, modular, architectural, and radical innovation, communication channels, information filters, problem-solving strategies.
Boundary conditions. Applies to complex products made of interacting components, developed by organizations whose structure mirrors the product’s architecture.
Related theories. Disruptive innovation, Absorptive capacity (Section 5.2), Knowledge-based view (Section 4.3), Dominant design.
12.4.1 Core logic
Earlier research had classified innovations as incremental or radical. R. M. Henderson and Clark (1990) observed that this dichotomy could not explain why incumbents sometimes failed in the face of seemingly modest innovations. They argued that designing a product requires two kinds of knowledge: component knowledge about each core concept and how it is implemented, and architectural knowledge about how components are integrated into a coherent whole. Crossing these dimensions yields four types of innovation, shown in Figure 12.4.
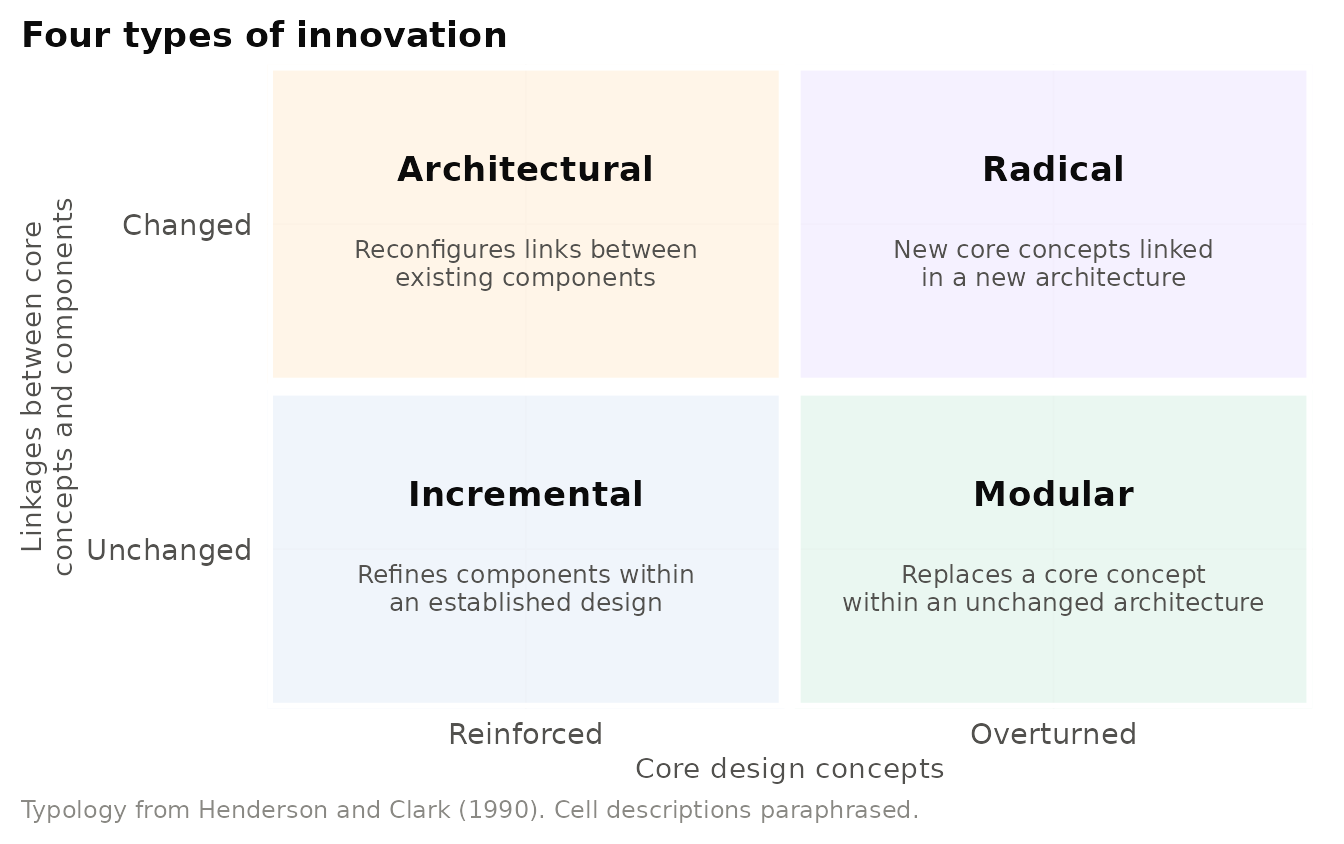
Figure 12.4: Henderson and Clark’s (1990) typology of innovation. Architectural innovation leaves core concepts intact but changes how components are linked, which is why incumbents often misread it as incremental.
Their own example is the room fan. Improving blade design or motor power within a standard ceiling fan is incremental. Replacing the motor with a fundamentally different one is modular. Designing a portable fan, which uses largely the same components but arranges them in a different configuration with different interactions among blade size, motor power, and housing, is architectural.
The difficulty for incumbents is that architectural knowledge becomes embedded in the organization. Teams are structured around components, communication channels link the people whose components interact, information filters highlight the variables that matter in the existing design, and problem-solving strategies become routine. Because these structures were built for the old architecture, they screen out precisely the information that signals a new one. An incumbent may therefore treat an architectural innovation as incremental, apply its familiar routines, and fail.
- P1. Incumbents are more likely to fail in architectural and radical innovations than in incremental and modular ones.
- P2. The more an organization’s communication structure mirrors the existing product architecture, the harder it is to recognize architectural change.
- P3. Architectural innovation is more damaging than its technical magnitude suggests because it is often misclassified as incremental (Table 12.4).
| Type | Component knowledge | Architectural knowledge | Typical incumbent outcome | Illustrative example |
|---|---|---|---|---|
| Incremental | Enhanced | Enhanced | Incumbent advantage | Successive improvements in a standard product |
| Modular | Destroyed | Enhanced | Incumbents can adapt by acquiring new component skills | Replacing an analogue component with a digital one |
| Architectural | Largely enhanced | Destroyed | Often fail, because the change is misread | Room fan to portable fan, contact to proximity aligners |
| Radical | Destroyed | Destroyed | Usually fail, but the threat is recognized | Shift to an entirely new technology base |
12.4.2 Evidence and extensions
In the photolithographic alignment equipment industry, a series of innovations that appeared modest in technical terms (for example, the move from contact to proximity aligners) was accompanied by changes in industry leadership, with established firms repeatedly losing to entrants (R. M. Henderson and Clark 1990, R. Henderson 1993). The concept has since been used to explain organizational design: firms that separate component development into modules may innovate quickly within the architecture but struggle to change it. It links naturally to absorptive capacity (Section 5.2) (W. M. Cohen and Levinthal 1990), because recognizing architectural change requires knowledge outside the current filters.
Architecture or cognition? Henderson and Clark locate the problem in organizational structure and routines. Later work emphasized managerial cognition. In their study of Polaroid’s move into digital imaging, Tripsas and Gavetti (2000) found that the firm built strong technical capabilities but that managers’ beliefs about the business model held it back. The two explanations are complementary but imply different remedies: restructuring communication channels versus changing managers’ mental models.
Kodak and the architecture of photography. Digital imaging was radical for Kodak’s chemistry, but it was also architectural for the photography business. The value chain shifted from film, processing, and prints to sensors, software, storage, and screens, and later to sharing through smartphones and social media. Kodak built an early digital camera in 1975 and invested in digital products, yet its organization, profit model, and information filters remained centred on film and photofinishing. H. C. Lucas and Goh (2009) attribute the failure less to ignorance of the technology than to an organization and culture unable to reconfigure around it. The company filed for Chapter 11 protection in 2012. The capability side of the story is covered in Chapter 5 under Dynamic capabilities (Section 5.1). The architectural lens adds that the hardest part to change was not knowledge of components but knowledge of how the business fitted together.
12.5 Dominant Design and Technology Cycles
Core claim. New industries begin with a period of experimentation in which many designs compete. A dominant design eventually emerges, after which the focus of innovation shifts from product to process, the number of firms falls, and competition turns to cost and scale until a new technological discontinuity restarts the cycle.
Origins. Technology management. Utterback and Abernathy (1975) and Abernathy and Utterback (1978) on the dynamics of product and process innovation. Tushman and Anderson (1986) and P. Anderson and Tushman (1990) on technological discontinuities and technology cycles. Synthesized in Utterback (1994).
Level of analysis. Industry and technology, with consequences for firm entry, exit, and survival.
Key constructs. Fluid, transitional, and specific phases, product versus process innovation, dominant design, era of ferment, era of incremental change, competence-enhancing versus competence-destroying discontinuities.
Boundary conditions. Fits assembled products with many interacting components better than non-assembled goods or services. The concept of a single dominant design is harder to apply in software and platform markets with continual updates.
Related theories. Product life cycle (Section 28.6), Network effects (Section 17.6), Organizational ecology (Section 7.5), Profiting from innovation.
12.5.1 Origins and intellectual history
Utterback and Abernathy (1975) proposed that the rate and type of innovation in a productive unit change as the unit matures. Early on, when performance requirements are unclear, firms experiment with product features, and production processes are flexible and inefficient. As the market learns what it wants, a design stabilizes, and innovation shifts to the production process, which becomes more specialized, capital-intensive, and efficient. Abernathy and Utterback (1978) named the three stages the fluid, transitional, and specific phases and illustrated them with the automobile industry, in which Ford’s Model T became a dominant design around which mass production was organized.
12.5.2 Core logic and propositions
A dominant design is the configuration that wins allegiance in the marketplace and that competitors and innovators must adhere to if they hope to command significant market share. It is rarely the most advanced technology. It usually combines features pioneered by several firms, and it can be shaped by network effects, complementary assets, regulation, and alliances as much as by technical merit (P. Anderson and Tushman 1990). Examples often given include the QWERTY typewriter keyboard, the Model T, the VHS video format, and the IBM-compatible personal computer.
P. Anderson and Tushman (1990) embedded the concept in a technology cycle. A technological discontinuity opens an era of ferment marked by competition among variants of the new technology and between the new and old technologies. The selection of a dominant design ends the era of ferment and opens an era of incremental change, which lasts until the next discontinuity. Tushman and Anderson (1986) added that discontinuities differ in their effect on incumbents. Competence-enhancing discontinuities build on existing know-how and tend to be introduced by incumbents. Competence-destroying discontinuities render existing know-how obsolete and tend to be introduced by new entrants.
- P1 (Phase shift). The rate of product innovation peaks before the emergence of a dominant design, and the rate of process innovation peaks after it.
- P2 (Shakeout). The number of firms in an industry rises during the era of ferment and falls sharply after a dominant design emerges.
- P3 (Competence effects). Competence-destroying discontinuities increase the share of new entrants among industry leaders, and competence-enhancing discontinuities consolidate incumbents’ positions.
- P4 (Selection is social). Which design becomes dominant cannot be predicted from technical merit alone.
Figure 12.5 shows the stylised pattern behind P1.
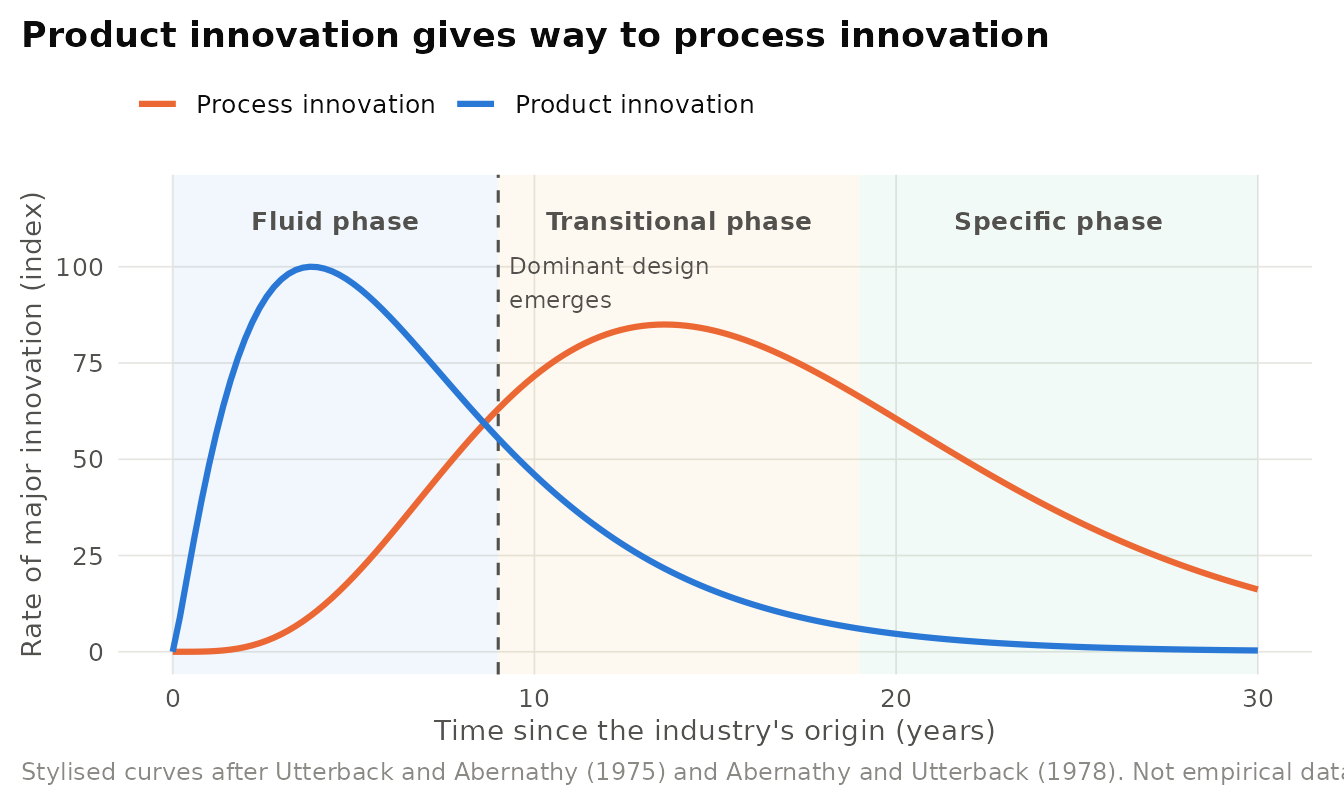
Figure 12.5: Stylised Abernathy-Utterback dynamics. Product innovation dominates the fluid phase. After a dominant design emerges, the rate of process innovation peaks and both rates eventually decline. Illustrative curves only.
12.5.3 Evidence and extensions
The empirical record broadly supports the cycle. P. Anderson and Tushman (1990) found the predicted sequence of discontinuity, ferment, and dominant design in the cement, glass, and minicomputer industries, and reported that the dominant design was seldom the technological frontier at the time of the discontinuity. Suárez and Utterback (1995) showed that the emergence of a dominant design shapes firm survival: across several industries, firms that entered before a dominant design emerged had better survival prospects than those that entered after. Klepper (1996) offered an economic explanation for shakeouts in which larger firms gain more from process innovation because they spread its cost over more output, so that early entrants that grow large come to dominate.
Is the dominant design a cause or a label? Critics point out that a dominant design is often identified only after the shakeout it is supposed to explain, which risks circularity. Others argue that in modular, software-based products, architectures evolve continuously and the cycle compresses or blurs. The competence-destroying versus competence-enhancing distinction has also been challenged: whether a technology destroys a firm’s competence depends on the particular firm, as the typesetter evidence on complementary assets shows (Tripsas 1997). The most defensible use of the framework is as a set of conditional expectations about where an industry is in its cycle, not as a deterministic timetable.
Table 12.5 presents the competence-enhancing versus competence-destroying discontinuities (after Tushman & Anderson, 1986).
| Feature | Competence-enhancing discontinuity | Competence-destroying discontinuity |
|---|---|---|
| Effect on know-how | Builds on existing skills and knowledge | Makes existing skills and knowledge obsolete |
| Typical initiator | Incumbent firms | New entrants |
| Effect on industry structure | Reinforces incumbents’ positions | Opens the door to new leaders |
| Managerial challenge | Keep investing in the current trajectory | Recognize the threat and build or buy new competences |
| Link to other theories | Profiting from innovation: incumbents’ assets retain value | Creative destruction, Liability of newness for entrants |
Format battles and the timing of commitment. In consumer electronics, the contest between VHS and Betamax in home video is a frequently cited case in which the eventual dominant design was not universally judged the technically superior one. Its victory owed much to licensing, recording time, and the availability of pre-recorded content: network effects and complementary assets rather than picture quality. For managers, the cycle has two practical implications. During the era of ferment, invest in flexibility and alliances that improve the odds of being on the winning design. Once a design is dominant, shift resources to process efficiency, cost, and the complementary assets that will determine profits.
Sample hypotheses.
- H1. After a dominant design emerges, the ratio of process to product patents in an industry will increase.
- H2. Firms entering an industry after the emergence of a dominant design will face a higher hazard of exit than firms that entered before it.
Designs. Long industry histories coded from trade directories, product catalogues, and patent data. Event-history models of entry and exit. Content analysis of product specifications to date dominant designs independently of outcomes.
Measures. Product-feature convergence across models, process versus product patent classes, number of producers over time, entry cohorts.
12.6 Open Innovation
Core claim. Firms can and should use purposive inflows and outflows of knowledge, bringing in external ideas and taking internal ideas to market through external paths, rather than relying solely on internal research and development.
Origins. Technology management. Chesbrough (2003), building on earlier work on absorptive capacity and user innovation. Laursen and Salter (2006) on the returns to external search. Dahlander and Gann (2010) on the forms of openness.
Level of analysis. Firm, and its relations with universities, suppliers, customers, start-ups, and communities.
Key constructs. Closed versus open innovation, inbound and outbound openness, search breadth and depth, pecuniary and non-pecuniary exchange, intellectual-property management, absorptive capacity.
Boundary conditions. Valuable where useful knowledge is widely distributed and markets for technology function. Less valuable where knowledge is highly tacit, integration costs are high, or appropriability concerns dominate.
Related theories. Absorptive capacity (Section 5.2), Structural holes (Section 9.4), Social capital (Section 9.5), Profiting from innovation.
12.6.1 Core logic
Chesbrough (2003) contrasted two paradigms. Under closed innovation, a firm generates its own ideas, develops them in its own laboratories, and brings them to market through its own channels. Under open innovation, the boundary of the firm is porous: valuable ideas can come from outside, and internal ideas that do not fit the current business can reach the market through licensing, spin-offs, or partnerships. Chesbrough argued that several erosion factors had undermined the closed model, notably the growing mobility of skilled workers, the availability of venture capital for spin-offs, and the rising capability of external suppliers and universities. His cautionary example was Xerox’s Palo Alto Research Center, which generated influential technologies whose value was largely captured by other firms (Table 12.6).
| Principle | Closed innovation | Open innovation |
|---|---|---|
| Source of talent | The best people in the field work for us | Not all the best people work for us, so we must work with those outside |
| Profiting from R&D | We must discover, develop, and ship it ourselves | External R&D can create value, and internal R&D captures part of it |
| Speed to market | Being first to discover wins | Building a better business model beats being first to discover |
| Intellectual property | Control it so competitors cannot benefit | Profit from others’ use of our IP and buy others’ IP when it advances our model |
| Unused ideas | Shelved | Licensed, spun off, or contributed to partners |
Dahlander and Gann (2010) clarified that openness comes in four forms by crossing direction with exchange type. Inbound openness includes sourcing external knowledge without payment (for example from users or scientific publications) and acquiring it through licences or purchases. Outbound openness includes revealing internal knowledge without immediate payment and selling it through licences or spin-offs. Each form has distinct costs and benefits.
12.6.2 Evidence and extensions
Laursen and Salter (2006) studied how the breadth (number of external sources used) and depth (intensity of use) of external search relate to innovation performance among UK manufacturing firms. Both were positively associated with the share of sales from new products, but with diminishing and eventually negative returns: an inverted-U. The explanation is attention. Each additional external relationship demands managerial time to identify, absorb, and integrate knowledge, and beyond some point the costs exceed the benefits. Figure 12.6 shows the shape with simulated data.
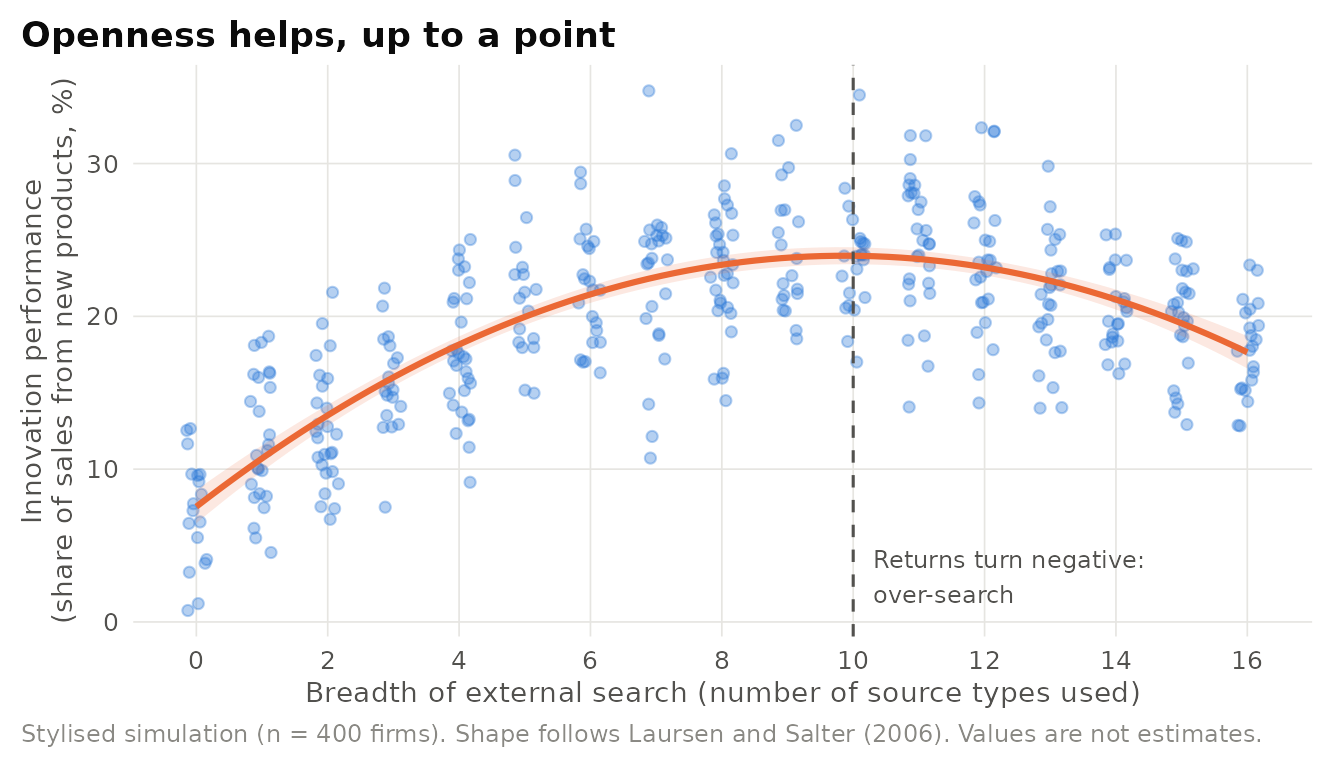
Figure 12.6: Illustrative simulation of the inverted-U relationship between breadth of external search and innovation performance reported by Laursen and Salter (2006). Points are simulated firms, the line is a quadratic fit.
Open innovation intersects with absorptive capacity (Section 5.2): firms need internal research to recognize and assimilate outside knowledge (W. M. Cohen and Levinthal 1990). It also connects to network theories, since external search draws on brokers and bridging ties (see Structural holes (Section 9.4)).
Is open innovation new? Critics argue that firms have long sourced ideas externally through acquisitions, licensing, and collaboration, and that open innovation relabels familiar practices. Defenders respond that the contribution lies in treating openness as a deliberate strategy with its own business model, and in measuring its forms and limits. A second concern is appropriability: revealing knowledge can help rivals as much as partners, which ties the theory back to Profiting from innovation.
12.6.3 Applications in business
Procter & Gamble’s Connect and Develop. In the early 2000s, P&G’s leadership concluded that internal research alone could not deliver the growth the company needed. It set a goal of sourcing half of its innovations from outside the company and created a programme, Connect and Develop, that used technology scouts, supplier networks, and online intermediaries to find external solutions to defined problems. Huston and Sakkab (2006), two P&G executives, describe how the firm specified needs in short technology briefs and searched its networks for existing solutions. One example they report is Pringles crisps printed with pictures and words, which used an ink-jet technique developed by a small bakery in Italy rather than one invented in-house. The programme illustrates inbound, pecuniary openness and the importance of internal capability to evaluate what is found outside.
Sample hypotheses.
- H1. The relationship between the number of external knowledge sources and new-product sales will be inverted-U shaped.
- H2. The optimal breadth of search will be higher for firms with greater internal R&D intensity (absorptive capacity).
Designs. Innovation surveys (such as the European Community Innovation Survey) with breadth and depth indices, panel studies of licensing and alliance portfolios, field studies of crowdsourcing contests.
Measures. Count of external source types used, intensity of use, in- and out-licensing revenues, share of new products with external origins.
More openness is always better. Openness has costs in attention, coordination, and appropriability. Firms that multiply partnerships without the capacity to absorb them can see innovation performance fall. Treat openness as a portfolio with an optimum, not a slogan.
12.7 Effectuation
Core claim. Under uncertainty, expert entrepreneurs often reason effectually: they start from the means they control and let goals emerge through commitments with stakeholders, rather than reasoning causally from a predetermined goal to the means needed to reach it.
Origins. Entrepreneurship and cognitive science. Sarasvathy (2001), drawing on think-aloud protocols with expert entrepreneurs and on Herbert Simon’s work on decision making. Elaborated in Sarasvathy (2008).
Level of analysis. Individual entrepreneur and the venture’s stakeholder network.
Key constructs. Causation, effectuation, means (who I am, what I know, whom I know), affordable loss, partnerships and pre-commitments, leveraging contingencies, non-predictive control.
Boundary conditions. Most applicable when the future is unpredictable, goals are ambiguous, and the environment is shaped by the actions of the participants (Knightian uncertainty). Causal reasoning is more effective when the market exists and outcomes are predictable.
Related theories. Bounded rationality (Section 23.1), Real options theory (Section 11.6), Opportunity discovery and creation, Bricolage.
12.7.1 Origins and core logic
Sarasvathy (2001) illustrated the difference with a chef. A chef reasoning causally is given a menu and buys the ingredients needed to cook it. A chef reasoning effectually looks in the cupboards and asks what meals can be made with what is there. Both are rational, but they suit different conditions. Causation is a logic of prediction: to the extent we can predict the future, we can control it. Effectuation is a logic of control: to the extent we can control the future, we do not need to predict it.
Sarasvathy’s later work organized effectuation into a set of principles that are now standard in entrepreneurship teaching (Sarasvathy 2008) (Table 12.7).
| Principle | Effectual logic | Causal contrast | Business illustration |
|---|---|---|---|
| Bird in hand (means) | Start with who you are, what you know, and whom you know | Start with a goal and acquire the means to reach it | A founder builds a product for the industry she has worked in for a decade |
| Affordable loss | Commit what you can afford to lose | Pursue the option with the highest expected return | Testing a concept with a weekend pop-up rather than a leased store |
| Crazy quilt (partnerships) | Bring in self-selected stakeholders who make commitments and shape goals | Analyse competitors and position against them | An early customer co-funds development in exchange for exclusivity |
| Lemonade (contingencies) | Treat surprises as resources to exploit | Avoid deviations from the plan | A failed feature reveals a different, more valuable use |
| Pilot in the plane (control) | Shape the future through action rather than forecast it | Forecast the market and plan for it | Creating an industry standard with partners instead of predicting one |
12.7.2 Mechanism
Effectuation describes a process rather than a single decision. Means suggest possible courses of action. Interactions with people yield commitments, which expand the venture’s means and constrain its goals. The cycle repeats until the emerging artifact, a firm, product, or market, is stable enough to manage causally (Figure 12.7).
Figure 12.7: The effectual cycle. Means suggest actions, interactions produce stakeholder commitments, and commitments expand means while converging goals, until a new market or venture takes shape. Adapted from the dynamic model in Sarasvathy (2008).
12.7.3 Evidence and extensions
In a meta-analysis, S. Read, Song, and Smit (2009) found positive associations between new-venture performance and several effectual elements, especially the use of existing means and partnerships, though the evidence was uneven across principles and many studies relied on cross-sectional, self-reported measures. Effectuation has become one of the most influential frameworks in entrepreneurship education, and its emphasis on cheap experiments and stakeholder commitments overlaps with the practitioner movement known as the lean startup.
Is effectuation a theory? Arend, Sarooghi, and Burkemper (2015) evaluated effectuation against criteria for theory and concluded that it falls short: its constructs are loosely defined, its predictions about performance are unclear, and it is hard to falsify. Proponents responded that effectuation is a theory of expertise and process, not a performance theory, and that its value lies in describing how entrepreneurs act under true uncertainty. The exchange is a useful case study in the criteria discussed in Chapter 2: precision, falsifiability, and scope. A further issue is causal direction. Experienced entrepreneurs may use effectual logic because they have succeeded rather than succeed because they use it.
12.7.4 Applications in business
Lean startups as structured experimentation. The lean startup method popularized by Ries (2011) and Blank (2013) advises founders to treat business ideas as hypotheses, build a minimum viable product, measure customer responses, and pivot or persevere on the basis of what they learn. The method shares effectuation’s distrust of long-range forecasts and its emphasis on affordable experiments, but it is more causal in spirit: it starts from a hypothesized customer problem and tests it. Evidence is emerging. In a randomized field experiment with Italian start-ups, Camuffo et al. (2020) found that founders trained to formulate and test hypotheses scientifically were more likely to pivot or abandon weak ideas and performed better than a control group. For managers in established firms, the same logic underlies internal venture programmes that fund small experiments with stage gates tied to evidence.
Sample hypotheses.
- H1. The positive relationship between effectual decision making and venture survival will be stronger in nascent markets than in established markets.
- H2. Ventures that secure pre-commitments from stakeholders before product launch will experience fewer and smaller losses on failure.
Designs. Think-aloud protocols and decision experiments comparing expert and novice entrepreneurs, longitudinal panels of nascent ventures, randomized training interventions.
Measures. Validated scales for causation and effectuation, counts of pre-commitments and partnerships, maximum funds at risk relative to founder wealth, number of pivots.
Treating effectuation as “no planning”. Effectuation is not improvisation without discipline. It specifies a logic: bounded downside, stakeholder commitments, and the deliberate use of surprises. Studies that equate it with the absence of a business plan measure something else.
12.8 Opportunity Discovery and Creation
Core claim. Entrepreneurship is the study of how opportunities to create future goods and services are discovered, evaluated, and exploited. Theories disagree on whether opportunities exist objectively, waiting to be discovered by alert individuals, or are created through entrepreneurs’ own actions.
Origins. Austrian economics and entrepreneurship research. Kirzner (1973) on entrepreneurial alertness. Shane and Venkataraman (2000) on the individual-opportunity nexus. Alvarez and Barney (2007) on discovery versus creation.
Level of analysis. Individual entrepreneur and market.
Key constructs. Entrepreneurial opportunity, alertness, prior knowledge, information asymmetry (Section 8.1), risk versus uncertainty, enactment.
Boundary conditions. Discovery logic fits markets disrupted by exogenous shocks with knowable outcomes. Creation logic fits settings where no market yet exists and outcomes cannot be known in advance.
Related theories. Effectuation, Information asymmetry (Section 8.1), Creative destruction, Sensemaking (Section 14.11).
12.8.1 Core logic
Kirzner (1973) offered a contrast to Schumpeter. Where Schumpeter’s entrepreneur disrupts equilibrium with new combinations, Kirzner’s entrepreneur moves markets toward equilibrium by noticing price discrepancies and unexploited possibilities that others overlook. The capacity to notice is alertness, and it requires no special resources, only perception.
Shane and Venkataraman (2000) argued that entrepreneurship research had focused too much on who entrepreneurs are and too little on opportunities. They defined the field as the study of the nexus between enterprising individuals and valuable opportunities, and they posed three questions: why, when, and how opportunities come into existence, why, when, and how some people rather than others discover and exploit them, and why, when, and how different modes of action are used. In a companion study, Shane (2000) traced eight sets of entrepreneurs who founded firms to exploit a single MIT three-dimensional printing invention. Each saw a different application, in markets connected to their prior work, which suggests that prior knowledge shapes which opportunities people discover.
Alvarez and Barney (2007) sharpened the debate by setting out two internally consistent theories (Table 12.8).
| Assumption | Discovery theory | Creation theory |
|---|---|---|
| Nature of opportunities | Exist independently of entrepreneurs, formed by exogenous shocks to markets or technology | Do not exist until created through entrepreneurs’ actions |
| Nature of entrepreneurs | Differ from others in alertness or prior knowledge | May not differ ex ante, differences may emerge through action |
| Decision context | Risky: outcomes and their probabilities can be estimated | Uncertain: outcomes cannot be known in advance |
| Implied actions | Search, evaluate, plan, and then exploit | Act, observe responses, and iterate |
| Associated approaches | Kirznerian alertness, information asymmetry | Effectuation, bricolage, enactment |
| Philosophical stance | Critical realism | Evolutionary realism and social construction |
12.8.2 Evidence and extensions
The discovery view has generated a large literature on alertness, prior knowledge, and the cognitive and network sources of opportunity recognition. The creation view connects to effectuation, bricolage, and sensemaking. Recent work has questioned the opportunity construct itself. Ramoglou and Tsang (2016) propose that opportunities are best understood as propensities: latent conditions for profitable demand that exist whether or not anyone acts, but that are only actualized through entrepreneurial action. This realist position tries to keep the objectivity of discovery while accommodating the role of action stressed by creation theory.
Can opportunities be observed before they are exploited? Critics argue that opportunities are identified only after successful exploitation, so “discovered opportunity” is often a retrospective label for success. This makes the construct hard to measure independently of outcomes. A practical response is to study beliefs about opportunities (perceived opportunities) and their formation, rather than opportunities as such, and to sample ventures that failed as well as those that succeeded.
Illustrative scenario: two founders, one technology. A university develops a low-cost sensor that detects moisture in materials. One founder, who previously worked in commercial roofing, sees a leak-detection product for flat roofs. A second founder, from agriculture, sees a soil-monitoring service for small farms. The discovery view explains the divergence through prior knowledge, as in Shane (2000). The creation view would add that each market takes shape only as the founders persuade early customers, adapt the product, and build distribution, so the eventual opportunity is partly a product of their actions. For a technology-transfer office, the implication is to license the same technology to several founders in different fields rather than search for the single best application.
12.9 Bricolage
Core claim. Resource-constrained entrepreneurs can create value by making do with resources at hand, recombining them for new purposes, and refusing to accept conventional limits on what those resources can do.
Origins. Anthropology and organization theory. Lévi-Strauss (1966) introduced the bricoleur. T. Baker and Nelson (2005) developed entrepreneurial bricolage from a field study of resource-constrained firms. Garud and Karnøe (2003) applied the idea to technology development.
Level of analysis. Venture and its local resource environment.
Key constructs. Resources at hand, making do, recombination, refusal to enact limitations, parallel versus selective bricolage, domains (physical inputs, labour, skills, customers, institutional rules).
Boundary conditions. Most relevant in resource-scarce environments. Persistent, wide-ranging bricolage may constrain growth.
Related theories. Effectuation, Resource-based theory (Section 4.1), Combinatorial creativity (Section 31.3).
12.9.1 Core logic
The anthropologist Claude Lévi-Strauss contrasted the bricoleur, who builds with a heterogeneous stock of materials at hand, with the engineer, who acquires materials designed for a project (Lévi-Strauss 1966). T. Baker and Nelson (2005) brought the concept into entrepreneurship. Their field study of small firms facing severe resource constraints found that some created something from nothing by treating undervalued or discarded resources (scrap materials, untrained but willing workers, ignored customers, ambiguous regulations) as raw material for new products and services. Resource environments, they argued, are partly constructed by the firms that act in them (Table 12.9).
| Domain | What bricolage looks like | Example |
|---|---|---|
| Physical inputs | Using discarded, idle, or unconventional materials | Repurposing equipment or waste streams from another industry |
| Labour | Involving customers, friends, and suppliers as workers | Customers who help build or test the product |
| Skills | Applying amateur or self-taught skills to professional tasks | A founder writes software without formal training |
| Customers and markets | Serving customers that others ignore | Offering a basic service to buyers who were not served at all |
| Institutional environment | Testing ambiguous rules and standards rather than accepting them | Operating in a gap between regulatory categories |
T. Baker and Nelson (2005) also distinguished two patterns. Parallel bricolage, applied habitually across many domains at once, tended to trap firms in a small, idiosyncratic niche, because customers, employees, and products all depended on improvisation. Selective bricolage, confined to a few domains and over a limited period, was associated with growth.
12.9.2 Evidence and extensions
Garud and Karnøe (2003) compared the emergence of wind-turbine industries in Denmark and the United States. The Danish path, a form of bricolage in which modest designs were improved incrementally through interaction among users, producers, and regulators, proved more successful than the American pursuit of technological breakthroughs. Senyard et al. (2014) found survey evidence that bricolage was positively associated with the innovativeness of resource-constrained new firms. The concept has been applied to social enterprises, frugal innovation in emerging markets, and crisis response.
Illustrative scenario: frugal clinic equipment. A start-up providing diagnostic services to rural clinics cannot afford new imaging equipment. Its founders refurbish units retired by urban hospitals, train local technicians whom larger providers do not recruit, and offer pay-per-scan pricing that clinics previously could not access. This is bricolage across physical inputs, labour, and customers. The theory’s warning is that if the firm keeps improvising in every domain, it may never achieve the reliability required to win hospital contracts. A deliberate shift from parallel to selective bricolage, standardizing equipment while keeping its low-cost model, is the growth path.
12.10 Liability of Newness
Core claim. New organizations have higher failure rates than older ones because they must learn new roles, build trust among strangers, and establish ties with customers and suppliers, while lacking the routines and legitimacy (Section @ref(legitimacy (Section 7.3))) that come with age.
Origins. Sociology. Stinchcombe (1965) in the Handbook of Organizations. Formalized and tested in organizational ecology by J. Freeman, Carroll, and Hannan (1983), with alternatives in Brüderl and Schüssler (1990) and Levinthal (1991).
Level of analysis. Organization within a population.
Key constructs. Age dependence, hazard of failure, role learning, trust, stable ties, reliability, accountability, initial endowments, liability of adolescence, liability of smallness.
Boundary conditions. Age effects can be confounded with size and initial resources. Very old organizations may face a liability of obsolescence.
Related theories. Organizational ecology (Section 7.5), Legitimacy (Section 7.3), Institutional theory (Section 7.2), Signaling theory (Section 8.2).
12.10.1 Core logic
Stinchcombe (1965) gave several reasons why new organizations are vulnerable. New roles must be learned, often by people who have not performed them before. Members of a new organization must develop trust and working relationships with strangers. Routines for coordination must be invented rather than inherited. And a new organization lacks stable ties with the customers, suppliers, and other parties on which it depends. Hannan and Freeman (1984) added that selection pressures favour organizations that perform reliably and can account rationally for their actions, properties that develop with age through the institutionalization of routines.
J. Freeman, Carroll, and Hannan (1983) tested the prediction that death rates decline with age using data on labour unions, newspaper publishers, and semiconductor manufacturers, and found the predicted negative age dependence. The liability of newness can also operate at the level of an entire new industry, whose firms lack both cognitive legitimacy (people do not understand what they do) and socio-political legitimacy (Aldrich and Fiol 1994).
- P1 (Newness). The hazard of organizational failure declines with age.
- P2 (Endowments). Initial resources such as capital, founders’ experience, and commitments delay the period of highest risk.
- P3 (Legitimacy). New organizations in new forms or industries face higher failure rates than new organizations in established forms.
12.10.2 Mechanism
Brüderl and Schüssler (1990) proposed a liability of adolescence. Using data on German business registrations, they found that the hazard of failure first rose and then fell with age. Their explanation is that founders commit initial resources that buffer the venture for a time, and that stakeholders suspend judgement until performance information accumulates. Failure peaks when the buffer is exhausted. Levinthal (1991) showed that a simple model in which organizational capital follows a random walk, with failure when it falls below a threshold, generates both patterns depending on initial endowments. Figure 12.8 compares the shapes.
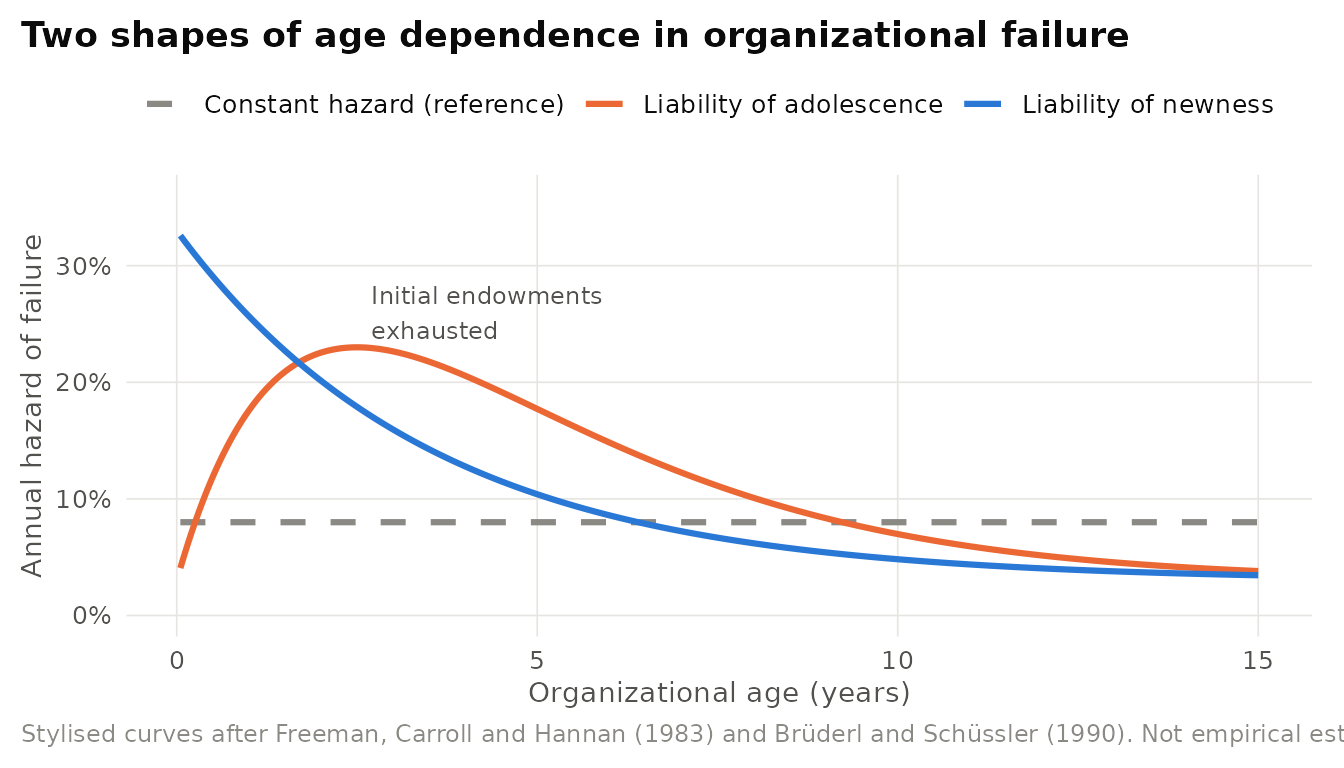
Figure 12.8: Stylised hazard rates of organizational failure by age. Liability of newness predicts a monotonic decline. Liability of adolescence predicts an initial rise while initial endowments buffer the venture, followed by a decline. Illustrative functional forms only.
Table 12.10 presents the age-related liabilities and their explanations.
| Liability | Predicted hazard pattern | Mechanism | Key source |
|---|---|---|---|
| Newness | Highest at founding, declining with age | Role learning, trust, routines, and external ties take time to build | Stinchcombe (1965), Freeman, Carroll & Hannan (1983) |
| Adolescence | Low at founding, rising, then declining | Initial endowments and suspended judgement buffer young firms | Brüderl & Schüssler (1990) |
| Smallness | Higher for small organizations at any age | Limited capital, staff, and legitimacy | Freeman, Carroll & Hannan (1983) |
| Newness of the form | Higher for all firms in a new industry | Lack of cognitive and socio-political legitimacy | Aldrich & Fiol (1994) |
| Random walk | Depends on initial capital relative to the failure threshold | Stochastic accumulation of organizational capital | Levinthal (1991) |
12.10.3 Evidence and extensions
Negative age dependence is among the most replicated findings in organizational ecology, but its interpretation has been contested. Because age and size are correlated, early studies that did not control for size may have attributed a liability of smallness to age. The adolescence pattern suggests that the riskiest period is not the founding moment but the point at which initial resources run out. Research on imprinting, also traced to Stinchcombe (1965), adds that conditions at founding leave durable marks on structure and strategy.
Newness, smallness, or selection? Liability of newness may partly reflect heterogeneity rather than learning. If a population of new firms contains both strong and weak ventures, the weak fail early, and the average hazard among survivors falls even if no individual firm becomes less risky with age. Event-history models with controls for unobserved heterogeneity, and studies of within-firm changes in capabilities, are needed to separate these explanations.
Managing the newness gap. Practitioners respond to the liability of newness by borrowing age and legitimacy. Start-ups recruit experienced executives and board members, seek endorsements from reputable investors and customers, join accelerators, and adopt recognizable organizational templates. Each move substitutes for the track record they lack and links to signaling theory (Section 8.2). Corporate venturing units face a mirror problem: they can borrow the parent’s legitimacy and resources but may inherit routines unsuited to the new business, which is why ambidexterity (Section 5.4) research recommends structural separation with senior integration.
Sample hypotheses.
- H1. The hazard of venture failure will first increase and then decrease with age, with the peak occurring later for ventures with larger initial funding.
- H2. Founding-team industry experience will reduce the hazard of failure more strongly in the first three years than thereafter.
Designs. Event-history (survival) analysis of founding cohorts from business registers, with time-varying covariates for size and funding. Piecewise-exponential or flexible hazard models to detect non-monotonic age dependence.
Measures. Founding and exit dates, initial capital, employment, founder experience, accelerator participation, investor reputation.
Confusing age with size or endowment. A negative coefficient on age in a survival model does not by itself demonstrate a liability of newness. Without controls for size, initial resources, and unobserved firm quality, the effect may reflect smallness, under-capitalization, or the early exit of weak ventures.
12.11 Chapter Summary
- Creative destruction frames innovation as the engine of economic change: new combinations earn temporary rents and make old products and firms obsolete (Schumpeter 1942, Aghion and Howitt 1992).
- Disruptive innovation explains why well-managed incumbents lose to inferior entrants that start in footholds the incumbents rationally ignore, but its conditions must be measured, not inferred from outcomes (Christensen 1997, Christensen, Raynor, and McDonald 2015, A. A. King and Baatartogtokh 2015).
- Profiting from innovation shows that value capture depends on appropriability, the dominant design, and control of complementary assets (Teece 1986).
- Architectural innovation reveals that reconfiguring existing components can defeat incumbents because their organizations embed the old architecture (R. M. Henderson and Clark 1990).
- Dominant designs and technology cycles describe how industries move from ferment to standardization, shifting innovation from product to process (Abernathy and Utterback 1978, P. Anderson and Tushman 1990).
- Open innovation treats external knowledge as a strategic resource with diminishing returns (Chesbrough 2003, Laursen and Salter 2006).
- Effectuation, opportunity creation, and bricolage describe how entrepreneurs act under uncertainty and scarcity, starting from means at hand (Sarasvathy 2001, Alvarez and Barney 2007, T. Baker and Nelson 2005).
- The liability of newness reminds founders and investors that young organizations face elevated failure risk until routines, ties, and legitimacy develop (Stinchcombe 1965, J. Freeman, Carroll, and Hannan 1983).
Table 12.11 presents the comparison of the chapter’s theories.
| Theory | Key mechanism | Signature prediction | Typical business use |
|---|---|---|---|
| Creative destruction | Innovation rents attract imitators and replace incumbents | Waves of entry, exit, and leadership turnover | Scanning for category-killing innovations |
| Disruptive innovation | Incumbents’ resource allocation favours core customers | Entrants from footholds overtake incumbents | Deciding whether and how to respond to low-end entrants |
| Profiting from innovation | Appropriability and complementary assets | Asset owners beat innovators under weak regimes | Build, partner, or license decisions |
| Architectural innovation | Organizational filters embed the old architecture | Incumbents fail at modest-looking reconfigurations | Diagnosing blind spots in product development |
| Dominant design | Market selection of a standard configuration | Shift from product to process innovation, shakeout | Timing entry and investment across the cycle |
| Open innovation | External knowledge flows and absorptive capacity | Inverted-U returns to search breadth | Designing partnership and licensing portfolios |
| Effectuation | Means-driven action and stakeholder commitments | Experts control rather than predict | Early-stage venture and internal-venture design |
| Discovery and creation | Alertness and prior knowledge versus enactment | Different actions under risk and uncertainty | Choosing planning versus iterative approaches |
| Bricolage | Recombining resources at hand | Selective bricolage supports growth | Frugal innovation and resource-constrained ventures |
| Liability of newness | Role learning, trust, and legitimacy take time | Failure hazard falls with age (or peaks in adolescence) | Venture funding, staging, and support |
12.12 Discussion Questions
- Choose a recent technology that commentators describe as “disruptive”. Using the conditions in Christensen, Raynor, and McDonald (2015), assess whether it fits the theory. What evidence, collected now, would let you test the prediction prospectively?
- Apply Teece’s framework to a start-up developing a new medical device. Which complementary assets will it need, who controls them, and should it seek to compete, partner, or be acquired?
- Henderson and Clark argue that architectural knowledge is embedded in communication channels. Design an organizational intervention that would help a product-development group detect architectural change earlier.
- Using the inverted-U finding of Laursen and Salter (2006), how would you decide how many external innovation partners a mid-sized firm should maintain? What moderators would shift the optimum?
- Design a study that distinguishes the discovery and creation views of opportunities. What sample would avoid selecting on success?
- A venture fund observes that its portfolio companies fail most often in their third year. Which theory of age dependence does this support, and what changes in funding or support would the theory recommend?
12.13 Further Reading
- Schumpeter (1942): the source of the phrase creative destruction and still the best statement of why innovation, not price competition, drives capitalism.
- Teece (1986): the foundational analysis of who captures value from innovation. Read with Teece (2006) for the author’s later reflections.
- Christensen (1997), then A. A. King and Baatartogtokh (2015): the classic statement of disruption and a rigorous test of how well its cases fit, read together for balance.
- R. M. Henderson and Clark (1990): a concise, highly cited article that shows how organizations embed product architecture in their structure.
- P. Anderson and Tushman (1990): the clearest account of technology cycles and dominant designs.
- Laursen and Salter (2006): an influential empirical study of the benefits and limits of open search.
- Sarasvathy (2001) and Alvarez and Barney (2007): two articles that reframed how entrepreneurship scholars think about uncertainty and opportunity.
- T. Baker and Nelson (2005): a rich field study that shows how founders create resources from what others overlook.