28 Marketing Strategy and Services
In the early 1990s many large manufacturers still described themselves by what came off their assembly lines. Thirty years later, aircraft-engine makers sell “hours of thrust”, software firms sell subscriptions rather than licences, and retailers compete on what they know about each customer as much as on what they stock. Why do some firms sense these shifts early and others late? Why does a bank with modern branches and competitive rates still lose customers to a rival that simply answers the phone? Why is a subscriber who stays one extra year worth so much more than a few points of price? And why do so many advertising plans still assume that consumers move neatly from awareness to purchase?
These questions belong to marketing strategy: the set of theories that explain how firms understand markets, create and deliver value, and allocate marketing resources over time. This chapter covers seven of the field’s most influential frameworks. Market orientation explains how organizations generate and act on market intelligence. Service-dominant logic reframes what is exchanged in markets. The gaps model of service quality diagnoses where service failures originate. Customer equity treats customers as financial assets. The hierarchy of effects models how advertising is supposed to work. The product life cycle describes how markets evolve, and the marketing mix organizes the decisions a manager controls. Each is widely taught and widely used, and each has attracted serious criticism. Understanding both the logic and the critique is what separates a theory-informed strategist from a framework user.
The seven frameworks fall into three groups. Market orientation and service-dominant logic are theories of how a firm should understand markets and value. The gaps model and customer equity are theories of how service and customer relationships translate into outcomes, perceived quality in one case and financial value in the other. The hierarchy of effects, the product life cycle, and the marketing mix are planning frameworks for managing programs over consumers’ decision processes, over a market’s evolution, and across the decisions a manager controls. The first group draws on the resource-based (Section 4.1) and learning traditions. The second draws on psychology and finance. The third is closest to everyday practice, and for that reason it is the most in need of the critical scrutiny that later research has supplied (Table 28.1).
| Theory | Core question | Level of analysis | Key source |
|---|---|---|---|
| Market orientation | Do firms that generate and act on market intelligence perform better? | Firm / business unit | Kohli & Jaworski (1990), Narver & Slater (1990) |
| Service-dominant logic | What is exchanged in markets, and who creates value? | Market / service ecosystem | Vargo & Lusch (2004) |
| Gaps model of service quality | Where do service-quality shortfalls originate? | Firm / customer | Parasuraman, Zeithaml & Berry (1985) |
| Customer equity | What are customers worth, and how should marketing be valued? | Customer / firm | Blattberg & Deighton (1996), Gupta et al. (2004) |
| Hierarchy of effects | Through which mental stages does advertising work? | Individual consumer | Lavidge & Steiner (1961) |
| Product life cycle | How do sales, competition, and strategy change as markets mature? | Product class / market | Levitt (1965) |
| Marketing mix | Which controllable variables make up a marketing program? | Firm / offering | Borden (1964), McCarthy (1960) |
28.1 Market Orientation
Core claim. Businesses that systematically generate intelligence about customers and competitors, share it across functions, and respond to it achieve superior performance.
Origins. Marketing strategy. Two parallel 1990 articles in the Journal of Marketing: a behavioural conceptualization by Kohli and Jaworski (1990) and a cultural one by Narver and Slater (1990). Meta-analysed by Kirca, Jayachandran, and Bearden (2005).
Level of analysis. Strategic business unit or firm.
Key constructs. Intelligence generation, intelligence dissemination, responsiveness, customer orientation, competitor orientation, interfunctional coordination, market turbulence, competitive intensity.
Boundary conditions. Benefits depend on whether customer needs are knowable and changing, on the cost of collecting intelligence, and on whether responding to current customers diverts resources from disruptive opportunities.
Related theories. Resource-based theory (Section 4.1), Market-based assets (Section 4.5), Dynamic capabilities (Section 5.1), Absorptive capacity (Section 5.2), Organizational learning (Section 14.3), Disruptive innovation (Section 12.2).
28.1.1 Origins and intellectual history
The marketing concept, the idea that a business should be organized around satisfying customer needs profitably, had been a staple of textbooks since the 1950s. What it lacked was a definition precise enough to measure. In 1990 two research teams independently supplied one. Kohli and Jaworski (1990) reviewed the literature and interviewed managers across functions and industries. They defined market orientation as the organization-wide generation of market intelligence about current and future customer needs, the dissemination of that intelligence across departments, and organization-wide responsiveness to it. Their definition is behavioural: market orientation is something a business does.
Narver and Slater (1990) took a cultural view. Market orientation, in their account, is the organizational culture (Section 14.6) that most effectively creates the behaviours needed to deliver superior value to buyers. It has three behavioural components, customer orientation, competitor orientation, and interfunctional coordination, and two decision criteria, a long-term focus and profitability. Using data from 140 strategic business units of a single corporation, they reported a substantial positive association between market orientation and profitability.
The two conceptualizations were soon operationalized in widely used scales: MARKOR for the behavioural view (Kohli, Jaworski, and Kumar 1993) and the Narver and Slater scale for the cultural view. Day (1994) then reframed the construct as a set of capabilities, notably market sensing and customer linking, connecting market orientation to the resource-based view (Section 4.1) and to later work on market-based assets (Section 4.5) (Srivastava, Shervani, and Fahey 1998) (Table 28.2).
| Feature | Behavioural view | Cultural view |
|---|---|---|
| Key source | Kohli & Jaworski (1990) | Narver & Slater (1990) |
| Definition | Generation, dissemination, and use of market intelligence | Culture that creates behaviours for superior customer value |
| Components | Intelligence generation, dissemination, responsiveness | Customer orientation, competitor orientation, interfunctional coordination |
| Typical measure | MARKOR (Kohli, Jaworski & Kumar, 1993) | Narver & Slater multi-item scale |
| Unit of focus | Activities and processes | Values, norms, and coordination |
| Managerial lever | Information systems, cross-functional routines, incentives | Leadership, shared values, hiring and socialization |
28.1.2 Core logic and propositions
The logic links information to action. Firms that know more about what customers value, and about what competitors are about to offer, can design better offerings and react faster. That knowledge has value only if it reaches the people who design, price, and deliver the offering, and only if they act on it. Hence the theory’s central propositions:
- P1 (Performance). Market orientation is positively related to business performance (Narver and Slater 1990, Jaworski and Kohli 1993).
- P2 (Antecedents). Top-management emphasis, interdepartmental connectedness, and market-based reward systems increase market orientation. Interdepartmental conflict and centralization reduce it (Jaworski and Kohli 1993).
- P3 (Mediation). The effect on performance runs largely through innovativeness, product and service quality, and customer loyalty (Kirca, Jayachandran, and Bearden 2005).
- P4 (Environment). Market orientation should matter more when customer preferences change quickly and competition is intense, although empirical support for this moderation is weak (Jaworski and Kohli 1993).
- P5 (Employee outcomes). Market orientation is associated with stronger employee commitment and esprit de corps (Jaworski and Kohli 1993).
Figure 28.1 summarizes this structure.
Figure 28.1: Mechanism of market orientation. Organizational antecedents shape the generation, dissemination, and use of market intelligence. Market orientation improves performance mainly through innovativeness, quality, and customer loyalty. Environmental conditions and the type of business moderate the effect. Synthesised from Jaworski and Kohli (1993) and Kirca et al. (2005).
28.1.3 Evidence and extensions
Hundreds of studies have tested the market orientation-performance link across industries and countries. The meta-analysis by Kirca, Jayachandran, and Bearden (2005) synthesised this literature and found a positive relationship with overall business performance, with innovativeness, customer loyalty, and quality acting as mediators. The relationship was stronger in manufacturing than in service firms and in national cultures with lower power distance and uncertainty avoidance, which links the theory to research on culture (Section 18.2). Top-management emphasis, interdepartmental connectedness, and market-based reward systems emerged as reliable antecedents.
A second stream asks what kind of market orientation matters. Narver, Slater, and MacLachlan (2004) distinguish responsive market orientation, which addresses customers’ expressed needs, from proactive market orientation, which tries to discover latent needs that customers cannot yet articulate. In their data, the proactive form was the stronger predictor of new-product success.
Can listening to customers be dangerous? Studies of disk-drive makers by Christensen and Bower (1996) showed that leading firms failed in part because they listened carefully to their largest existing customers, who did not want the smaller, lower-performing drives that later displaced them. Read narrowly, this looks like a refutation of market orientation. Read carefully, it shows that the theory’s boundary conditions matter: a responsive orientation focused on current mainstream customers can blind a firm to emerging segments and technologies (Christensen 1997). The proactive extension (Narver, Slater, and MacLachlan 2004) and the original definition’s emphasis on future needs (Kohli and Jaworski 1990) partly address the critique. Two methodological concerns remain. Most evidence relies on cross-sectional, single-informant surveys in which managers rate both orientation and performance, which inflates correlations through common-method variance. And because successful firms can afford more market research, reverse causality is hard to rule out.
28.1.4 Applications in business
Market orientation is a practical diagnostic. A business can audit each step in the intelligence chain. Is customer information collected beyond satisfaction surveys, including complaints, front-line observations, and lost-sale analysis? Does it reach product, operations, and finance, or does it stay in the marketing department? And is anyone accountable for acting on it within a defined time?
Market orientation in retailing. Two well-documented retailers illustrate different routes to the same capability. Tesco’s Clubcard loyalty programme, launched in the United Kingdom in the mid-1990s and analysed with the data science firm dunnhumby (which Tesco later took over), turned transaction data into intelligence used for ranging, promotions, and personalized offers. This is a strong form of intelligence generation and dissemination. Inditex’s Zara built responsiveness: store managers report what customers ask for and what sells, central design teams turn those signals into new items, and short production cycles let the firm act on intelligence within weeks rather than seasons. The lesson for managers is that data collection alone is not market orientation. Clubcard data created value because it changed decisions, and Zara’s store reports mattered because the supply chain could respond to them.
28.1.5 Using the theory in research
Sample hypotheses.
- H1. Market orientation will be positively related to new-product performance, and this effect will be mediated by product innovativeness.
- H2. The positive effect of responsive market orientation on performance will be weaker, and the effect of proactive orientation stronger, in markets with high technological turbulence.
- H3. Market-based reward systems will strengthen the link between intelligence dissemination and responsiveness.
Measures. MARKOR (Kohli, Jaworski, and Kumar 1993), the Narver and Slater scale (Narver and Slater 1990), responsive and proactive scales (Narver, Slater, and MacLachlan 2004). Objective performance from financial databases rather than self-reports where possible.
Designs. Multi-informant surveys with lagged objective outcomes, panel designs that track changes in orientation over time, and text analysis of annual reports or earnings calls as an unobtrusive measure of customer focus.
Equating market orientation with “doing what customers say”. The construct concerns the process of generating, sharing, and acting on intelligence about current and future needs and about competitors. Measuring only customer satisfaction or survey activity misses dissemination and responsiveness, and treating stated preferences as the whole of market intelligence invites the trap Christensen documented.
28.2 Service-Dominant Logic
Core claim. Service, the application of knowledge and skills for the benefit of another party, is the fundamental basis of all exchange. Goods are vehicles for service, and value is co-created by multiple actors and determined by the beneficiary in use.
Origins. Marketing theory. Vargo and Lusch (2004), refined in Vargo and Lusch (2008) and Vargo and Lusch (2016), building on services-marketing work such as Shostack (1977).
Level of analysis. Market, service ecosystem, and actor-to-actor exchange.
Key constructs. Service (singular), operant and operand resources, value co-creation, value-in-use, value proposition, resource integration, service ecosystem, institutions.
Boundary conditions. A lens or meta-theory rather than a set of directly testable hypotheses. Most useful where value depends heavily on how customers use and combine resources.
Related theories. Market orientation, Resource-advantage theory (Section 4.4), Social exchange theory (Section 9.1), Commitment-trust theory (Section 9.6), Institutional theory (Section 7.2).
28.2.1 Origins and core logic
Marketing grew out of economics, and economics grew up studying the production and exchange of tangible goods. Services were long treated as a residual category, defined by what they lacked: they were intangible, heterogeneous, inseparable from consumption, and perishable. Shostack (1977) argued that marketing needed to “break free” from product thinking, because most offerings combine tangible and intangible elements.
Vargo and Lusch (2004) went further. They argued that the goods-services distinction itself is the problem. In their service-dominant (S-D) logic, service, in the singular, is the process of using one’s competences for the benefit of another. People exchange service for service, and goods are simply distribution mechanisms for service: a car provides the service of transportation, and money is a claim on future service. The theory distinguishes operand resources, which must be acted on to be useful (raw materials, machines), from operant resources, which act on other resources (knowledge, skills, relationships). Operant resources, S-D logic argues, are the fundamental source of competitive advantage, which connects the theory to the resource-based view (Section 4.1) and to resource-advantage theory (Section 4.4) (Hunt and Morgan 1995).
The second core idea concerns value. Under goods-dominant logic, value is created by the firm, embedded in the product, and realized at the point of sale (value-in-exchange). Under S-D logic, value is realized when the beneficiary integrates the offering with its own resources in a context of use (value-in-use). The firm cannot deliver value on its own. It can only offer value propositions, and the customer is always a co-creator of value (Vargo and Lusch 2008). The 2016 update consolidated the framework into five axioms and added a fifth element: value co-creation is coordinated through actor-generated institutions and institutional arrangements, such as norms, rules, and shared meanings (Vargo and Lusch 2016).
Definition 28.1 The five axioms of service-dominant logic (Vargo and Lusch 2016). (1) Service is the fundamental basis of exchange. (2) Value is co-created by multiple actors, always including the beneficiary. (3) All social and economic actors are resource integrators. (4) Value is always uniquely and phenomenologically determined by the beneficiary. (5) Value co-creation is coordinated through actor-generated institutions and institutional arrangements.
The axioms shift the unit of analysis away from the firm-customer dyad. Because every actor integrates resources from many sources, a customer’s value-in-use depends on complementary offerings, other customers, and the rules of the setting, not only on the focal firm. A smartphone delivers value through apps, networks, and the user’s own skills. A hospital stay delivers value through clinicians, family members, and insurance arrangements. S-D logic calls these nested systems service ecosystems, which links it to research on network effects (Section 17.6) and two-sided markets (Section 17.7) (Table 28.3).
| Dimension | Goods-dominant logic | Service-dominant logic |
|---|---|---|
| Unit of exchange | Goods (and services as a residual category) | Service: applied knowledge and skills |
| Role of goods | End product that embodies value | Vehicle or appliance for delivering service |
| Primary resource | Operand resources (materials, equipment) | Operant resources (knowledge, skills, relationships) |
| Locus of value | Value-in-exchange, realized at sale | Value-in-use, determined by the beneficiary |
| Role of customer | Target and recipient of value | Co-creator and resource integrator |
| Firm’s role | Produce and deliver value | Offer value propositions and support co-creation |
| Relationship focus | Transactions | Ongoing relationships within service ecosystems |
| Business model example | Selling an engine | Charging per hour of engine availability |
Figure 28.2 represents value co-creation as resource integration within an institutional context.
Figure 28.2: Value co-creation in service-dominant logic. The firm offers a value proposition. The customer integrates it with its own operant and operand resources in a context of use, and value-in-use is determined by the beneficiary. Institutions coordinate the process. Redrawn from the logic of Vargo and Lusch (2008, 2016).
28.2.2 Evidence and extensions
Because S-D logic is a perspective rather than a falsifiable theory, its “evidence” is mostly conceptual uptake and the empirical programmes it has inspired. Two are especially productive. The first is servitization, the movement of manufacturers into services. Vandermerwe and Rada (1988) coined the term to describe firms offering “bundles” of goods, services, support, and knowledge. Baines et al. (2009) review the literature on servitized manufacturing and identify the challenges firms face, including designing integrated product-service offerings and building service cultures within product organizations. The second is research on service ecosystems and platforms, where value emerges from interactions among many actors rather than from a firm-customer dyad.
Insight or relabelling? Critics raise three concerns. First, if everything is service, the concept risks losing discriminating power: a theory that classifies every exchange the same way may explain little about why exchanges differ. Second, the claim that customers always co-create value is true by definition under S-D logic, and therefore cannot be tested. Empirical work instead studies variation in the degree of customer participation. Third, S-D logic’s foundational premises were revised several times (Vargo and Lusch 2008, 2016), which supporters see as healthy evolution and critics see as a moving target. A fair assessment is that S-D logic is most valuable as a reframing device. It directs attention to use contexts, customer resources, and business models that capture value over time, and specific mid-range theories are needed to generate testable predictions.
28.2.3 Applications in business
Servitization at Rolls-Royce. The aircraft-engine business is the best-known illustration of S-D logic in practice. Rolls-Royce traces its “Power by the Hour” concept to the early 1960s and today offers engine care under its TotalCare programme. Instead of buying an engine and then paying separately for spare parts and repairs, an airline pays for engine availability, typically per flying hour, and the manufacturer assumes responsibility for maintenance. The shift changes incentives on both sides. Under a parts-and-repair model, the supplier earns more when engines break. Under a per-hour model, it earns more when engines stay on the wing, which aligns its incentives with the airline’s value-in-use. The model also changes what the firm must know: engine health monitoring data become an operant resource, and long-term service contracts create the relationship continuity that S-D logic emphasises. The risk moves too. The manufacturer now bears the cost of unexpected failures, so pricing requires accurate reliability forecasting, a point that links servitization to transaction cost economics (Section 6.3) and agency theory (Section 6.1).
Research uses. Treat S-D logic as a framing that motivates specific hypotheses. Examples: (1) outcome-based contracts will increase supplier investment in reliability relative to transactional contracts, (2) customers with greater operant resources (expertise, complementary assets) will realise more value-in-use from the same offering, (3) servitized manufacturers will show more stable revenue but face a service-paradox period in which profitability falls before it rises. Designs. Contract-level data from B2B firms, field studies of usage data, comparative case studies of servitization transitions.
Using “co-creation” as a slogan. Asking customers to do more work (assembly, self-service, data entry) is not value co-creation unless it increases value-in-use for them. Researchers should measure the customer’s resources and outcomes, not only the firm’s intent.
28.3 The Gaps Model of Service Quality
Core claim. Customers judge service quality by comparing what they expected with what they perceive they received. That customer gap results from four internal gaps in the provider’s understanding, design, delivery, and communication.
Origins. Services marketing. Parasuraman, Zeithaml, and Berry (1985) proposed the gaps model and Parasuraman, Zeithaml, and Berry (1988) developed the SERVQUAL measurement instrument. Challenged by Cronin and Taylor (1992).
Level of analysis. The firm (internal gaps) and the individual customer (perceived quality).
Key constructs. Expected service, perceived service, the five gaps, tangibles, reliability, responsiveness, assurance, empathy.
Boundary conditions. Applies to services in which customers form expectations and can evaluate delivery. Measurement of expectations is contested, and the five dimensions do not replicate cleanly in every industry.
Related theories. Expectancy disconfirmation (Section 27.1), Peak-end rule (Section 25.7), Market orientation, Service-dominant logic.
28.3.1 Origins and intellectual history
Services posed a measurement problem. A car’s quality can be assessed by inspecting it, but a bank teller’s courtesy or an airline’s handling of a missed connection exists only as an experience. European work by Grönroos (1984) distinguished technical quality (what the customer receives) from functional quality (how it is delivered). In the United States, Parasuraman, Zeithaml, and Berry (1985) conducted focus groups with consumers and interviews with executives in several service categories, including retail banking, credit cards, securities brokerage, and product repair. They concluded that customers assess quality as the difference between expectations and perceptions, and that the size of that difference depends on a chain of internal shortfalls.
28.3.2 Core logic and the five gaps
The model identifies five gaps:
- Gap 1, the knowledge gap. Management’s perception of customer expectations differs from what customers actually expect.
- Gap 2, the standards gap. Service-quality specifications do not reflect management’s perception of expectations.
- Gap 3, the delivery gap. Actual service delivery departs from the specifications.
- Gap 4, the communication gap. External communications promise something other than what is delivered.
- Gap 5, the customer gap. Perceived service falls short of expected service. This is perceived service quality, and the model treats it as a function of gaps 1 to 4 (Parasuraman, Zeithaml, and Berry 1985).
Customer expectations are shaped by word of mouth (Section 26.3), personal needs, past experience, and the firm’s own communications. This last link is what makes Gap 4 so consequential: advertising that over-promises raises expectations and widens Gap 5 even when delivery is unchanged. Figure 28.3 redraws the model.
Figure 28.3: The gaps model of service quality. Solid arrows show influences on customer expectations and perceptions. Dashed arrows mark the five gaps, including the three links along which the provider translates perceived expectations into specifications, delivery, and communications. The customer gap (Gap 5) between expected and perceived service is a function of four provider gaps. Redrawn from Parasuraman, Zeithaml and Berry (1985).
28.3.3 Measuring the customer gap: SERVQUAL
To measure Gap 5, Parasuraman, Zeithaml, and Berry (1988) developed SERVQUAL, a 22-item instrument in which respondents rate both what they expect from excellent firms in a category and what they perceive from the focal firm. The difference score, perception minus expectation, is computed for each item. The ten determinants identified in the 1985 study were consolidated into five dimensions (Table 28.4).
| Dimension | Definition | Retail banking illustration | Airline illustration |
|---|---|---|---|
| Tangibles | Physical facilities, equipment, and appearance of personnel | Clean branches, a usable app | Cabin condition, gate facilities |
| Reliability | Ability to perform the promised service dependably and accurately | Error-free statements and transfers | On-time departures, baggage arrives |
| Responsiveness | Willingness to help customers and provide prompt service | Fast resolution of a blocked card | Rebooking after a cancellation |
| Assurance | Knowledge and courtesy of employees and their ability to inspire trust | Competent, confident advisers | Calm, knowledgeable crew |
| Empathy | Caring, individualized attention | Advice suited to a customer’s situation | Help for families or passengers with special needs |
Figure 28.4 shows what a gap analysis looks like in practice, using simulated survey data for two services.
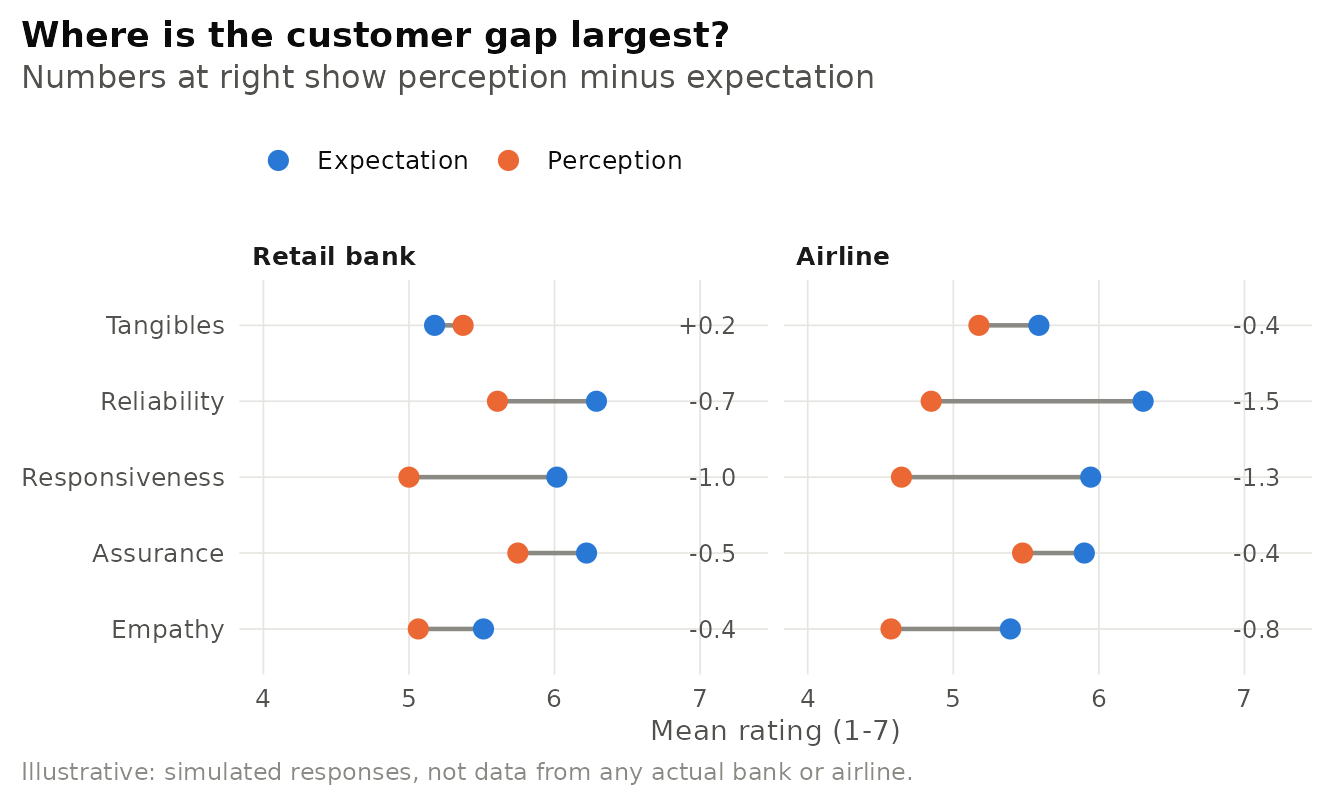
Figure 28.4: Illustrative SERVQUAL gap analysis with simulated survey data (250 respondents per service, 7-point scales). Each line connects the mean perception (orange) with the mean expectation (blue). Longer lines indicate larger customer gaps. The largest stylised gaps are in reliability and responsiveness, the dimensions most directly under operational control.
28.3.4 Evidence and the SERVQUAL-SERVPERF debate
SERVQUAL became one of the most widely applied instruments in marketing, and also one of the most criticised. Cronin and Taylor (1992) argued that the difference-score formulation was neither theoretically nor empirically justified. Testing alternatives in banking, pest control, dry cleaning, and fast food, they found that a performance-only measure, later called SERVPERF, explained more variance in overall quality than the gap scores. They also concluded that service quality is an antecedent of customer satisfaction, and that satisfaction had a stronger influence on purchase intentions than service quality did. Teas (1993) questioned what respondents mean by “expectations”: an ideal standard, a predicted level, or what a firm should provide. Parasuraman, Zeithaml, and Berry (1994) responded that expectation measures retain diagnostic value, because they show managers where shortfalls are largest relative to what customers want, even if performance-only scores predict overall judgements better (Table 28.5).
| Issue | SERVQUAL position | SERVPERF position |
|---|---|---|
| What is measured | Perceptions minus expectations | Perceptions only |
| Theoretical basis | Disconfirmation of expectations | Quality as an attitude toward performance |
| Predictive validity | Lower in head-to-head comparisons | Higher variance explained in overall quality |
| Diagnostic value | Identifies where shortfalls relative to expectations are largest | Identifies weak dimensions, not relative shortfalls |
| Respondent burden | Two ratings per item | One rating per item |
| Key sources | Parasuraman et al. (1988, 1994) | Cronin & Taylor (1992) |
Are the gaps real, and are there five dimensions? Three issues remain open. First, difference scores have known psychometric problems: they are often less reliable than their components and correlate with them mechanically. Second, the five-dimension structure does not replicate consistently across industries. Dimensions often merge, and researchers frequently adapt items to context. Third, expectations are dynamic: they rise with good experiences and with competitors’ improvements, which makes the comparison standard a moving target. These critiques weaken SERVQUAL as a universal measure, but they do not undermine the gaps model as a managerial diagnostic. The internal gaps (1 to 4) remain a useful way to locate the organizational source of a quality problem.
The downstream evidence is more consistent. Service quality is associated with favourable behavioural intentions, such as loyalty, willingness to pay more, and positive word of mouth (Zeithaml, Berry, and Parasuraman 1996). The service-profit chain extends the argument inside the firm: internal service quality drives employee satisfaction and retention, which improves the value delivered to customers, which drives loyalty and profit (Heskett et al. 1994).
28.3.5 Applications in business
Service quality in banking and airlines. Retail banking was one of the categories in which the gaps model was developed (Parasuraman, Zeithaml, and Berry 1985), and it remains a natural fit: much of what customers value, accurate transactions and prompt problem resolution, is invisible until it fails. A bank that invests in new branches (tangibles) while call-centre waits lengthen (responsiveness) can see satisfaction fall despite rising spending, because it has improved the dimension with the smallest gap. Airlines illustrate Gap 4. Advertising that emphasises premium cabins and attentive service raises expectations for every passenger, including those in economy who will experience delays and crowded boarding. In the United States, the Department of Transportation publishes carriers’ on-time performance and complaint statistics, which turns reliability, a dimension customers weight heavily, into a publicly observable attribute. The practical sequence is the same in both industries: measure the customer gap by dimension, trace each large gap to its internal source (knowledge, standards, delivery, or communication), and fix the source rather than the symptom.
Sample hypotheses. H1. Advertising intensity that emphasises service features will widen the customer gap when operational capacity is constrained (Gap 4). H2. The effect of perceived reliability on loyalty will be stronger than the effect of tangibles. H3. Employee satisfaction will mediate the effect of internal service quality on customer-perceived quality.
Measures. SERVQUAL and SERVPERF scales (Parasuraman, Zeithaml, and Berry 1988, Cronin and Taylor 1992), behavioural intentions (Zeithaml, Berry, and Parasuraman 1996), operational metrics (wait time, first-contact resolution, on-time rates) as objective counterparts.
Designs. Matched employee-customer surveys across branches or stores, multilevel models, field experiments on service scripts, and natural experiments from public disclosure of service metrics.
Running SERVQUAL without the gaps model. A survey that reports gap scores but never asks why the gap exists treats a diagnostic tool as a scorecard. The value of the model lies in tracing the customer gap back to one of the four provider gaps, each of which calls for a different remedy: research for Gap 1, standards and design for Gap 2, staffing and training for Gap 3, and communication discipline for Gap 4.
28.4 Customer Equity and Customer Lifetime Value
Core claim. Customers are assets whose value equals the discounted stream of profits they are expected to generate. The sum of these values, customer equity, is a proxy for firm value and the right yardstick for marketing decisions.
Origins. Marketing science and database marketing. Blattberg and Deighton (1996) proposed the customer equity test. S. Gupta, Lehmann, and Stuart (2004) linked customer value to firm value and Rust, Lemon, and Zeithaml (2004) linked customer equity to marketing investments.
Level of analysis. Individual customer, cohort, and firm.
Key constructs. Customer lifetime value (CLV), margin, retention rate, discount rate, acquisition cost, customer equity, value equity, brand equity (Section 27.3), relationship equity.
Boundary conditions. Works best when customers can be identified and their purchases observed. Estimating retention is harder in noncontractual settings, where defection is unobserved.
Related theories. Market-based assets (Section 4.5), Customer-based brand equity (Section 27.3), Commitment-trust theory (Section 9.6), Service quality gap model, Resource-based theory (Section 4.1).
28.4.1 Origins and core logic
Traditional marketing metrics, such as market share and sales, count transactions. Customer lifetime value (CLV) counts relationships. The idea came from direct and database marketers, who could track each customer’s purchases and therefore estimate what a customer was worth over time. Blattberg and Deighton (1996) argued that firms should manage marketing by a customer equity test: spending on acquisition and retention should be set to maximise the total value of the customer base, not short-term sales. That framing changes practical decisions. Acquiring a customer at a loss can be rational if expected future margins are high enough, and a retention programme that looks expensive per period can be cheap per unit of lifetime value.
S. Gupta, Lehmann, and Stuart (2004) took the idea to the capital markets. Following their formulation, the lifetime value of a customer acquired today is the discounted sum of expected margins, weighted by the probability that the customer is still active, minus the cost of acquiring the customer:
\[ \text{CLV} = \sum_{t=0}^{T} \frac{(p_t - c_t)\, r^{t}}{(1+i)^{t}} - \text{AC}, \]
where \(p_t - c_t\) is the margin in period \(t\), \(r\) is the per-period retention rate, \(i\) is the per-period discount rate, \(T\) is the horizon, and AC is the acquisition cost. With a constant margin \(m\) and an infinite horizon, the sum is a geometric series with the closed form
\[ \text{CLV} = m\,\frac{1+i}{1+i-r} - \text{AC}. \]
The formula makes the theory’s key implication visible. Because \(r\) sits in the denominator, CLV is convex in retention: each additional point of retention is worth more than the last. S. Gupta, Lehmann, and Stuart (2004) valued the customer bases of several public firms and found that a 1% improvement in retention improved firm value by about 5%, compared with about 1% for an equivalent improvement in margin and about 0.1% for acquisition cost. Customer equity, the sum of CLV across current and future customers, then becomes a lower-bound estimate of the value of the firm’s operating assets.
Rust, Lemon, and Zeithaml (2004) opened the black box of retention. They decomposed customer equity into three drivers: value equity (the customer’s objective assessment of quality, price, and convenience), brand equity (subjective, emotional appraisal, see customer-based brand equity (Section 27.3) (Keller 1993)), and relationship equity (the customer’s tendency to stay beyond objective and subjective assessments, built through loyalty programmes and switching costs). Linking each marketing initiative to these drivers, and the drivers to switching probabilities, yields a projected return on marketing.
The customer equity perspective also reframes the classic budgeting question of acquisition versus retention. Blattberg and Deighton (1996) argued that each has diminishing returns: the first acquisition dollars reach the most responsive prospects, and the first retention dollars save the customers who were easiest to keep. The optimal allocation equates the marginal contribution of the last dollar spent on each to customer equity. Two consequences follow. A firm that has under-invested in retention will see a high return from shifting money toward it, but the advantage shrinks as spending grows. And because the value of acquiring a customer depends on how long that customer will stay, acquisition and retention budgets cannot be set independently. Raising retention raises the value of every new customer, which justifies more acquisition spending (Table 28.6).
| Driver | What it captures | Typical levers | Example metric |
|---|---|---|---|
| Value equity | Objective assessment of what the offering delivers for its cost | Quality, price, convenience | Perceived value ratings, price index |
| Brand equity | Subjective, emotional appraisal beyond objective value | Advertising, brand experience, ethics | Brand awareness and attitude |
| Relationship equity | Propensity to stay beyond objective and subjective appraisal | Loyalty programmes, community, switching costs | Retention rate, share of wallet |
28.4.2 Computing customer lifetime value in R
The code below implements both forms of the formula for an illustrative subscription business and compares the effect of 1% relative improvements in each input. The numbers are stylised, not estimates for any real firm.
# Customer lifetime value with constant margin, retention, and discount rate.
# Margins arrive at the start of each period (t = 0, 1, 2, ...).
clv <- function(margin, retention, discount, acquisition_cost = 0, horizon = Inf) {
  if (is.infinite(horizon)) {
    value <- margin * (1 + discount) / (1 + discount - retention)
  } else {
    t <- 0:horizon
    value <- sum(margin * retention^t / (1 + discount)^t)
  }
  value - acquisition_cost
}

# Illustrative subscription: monthly margin 6, monthly retention 0.95,
# monthly discount rate 0.008 (about 10% a year), acquisition cost 40
base <- clv(margin = 6, retention = 0.95, discount = 0.008, acquisition_cost = 40)
three_years <- clv(6, 0.95, 0.008, acquisition_cost = 40, horizon = 35)

# Effect of a 1% relative improvement in each input
scenarios <- data.frame(
  change = c("Base case", "Retention +1%", "Margin +1%",
             "Acquisition cost -1%", "Discount rate -1%"),
  clv = c(base,
          clv(6, 0.95 * 1.01, 0.008, 40),
          clv(6 * 1.01, 0.95, 0.008, 40),
          clv(6, 0.95, 0.008, 40 * 0.99),
          clv(6, 0.95, 0.008 * 0.99, 40))
)
scenarios$pct_change <- round(100 * (scenarios$clv / base - 1), 1)
scenarios$clv <- round(scenarios$clv, 2)
round(c(infinite_horizon = base, three_year_horizon = three_years), 2)
#> infinite_horizon three_year_horizon
#> 64.28 51.93
scenarios#> change clv pct_change
#> 1 Base case 64.28 0.0
#> 2 Retention +1% 84.70 31.8
#> 3 Margin +1% 65.32 1.6
#> 4 Acquisition cost -1% 64.68 0.6
#> 5 Discount rate -1% 64.41 0.2Even in this toy example the ordering reported by S. Gupta, Lehmann, and Stuart (2004) appears: a 1% improvement in retention raises CLV far more than the same relative change in margin, acquisition cost, or the discount rate. The magnitudes differ from theirs because the inputs differ, which is itself a lesson. Retention sensitivity grows as retention rises, as Figure 28.5 shows.
Use the clv() function to answer three questions. (1) At what monthly
retention rate does the illustrative subscriber exactly repay the acquisition
cost of 40? (2) How much would the firm have to raise the monthly margin to
offset a fall in retention from 0.95 to 0.93? (3) Repeat question 1 with a
36-month horizon. Why does the break-even retention rate rise?
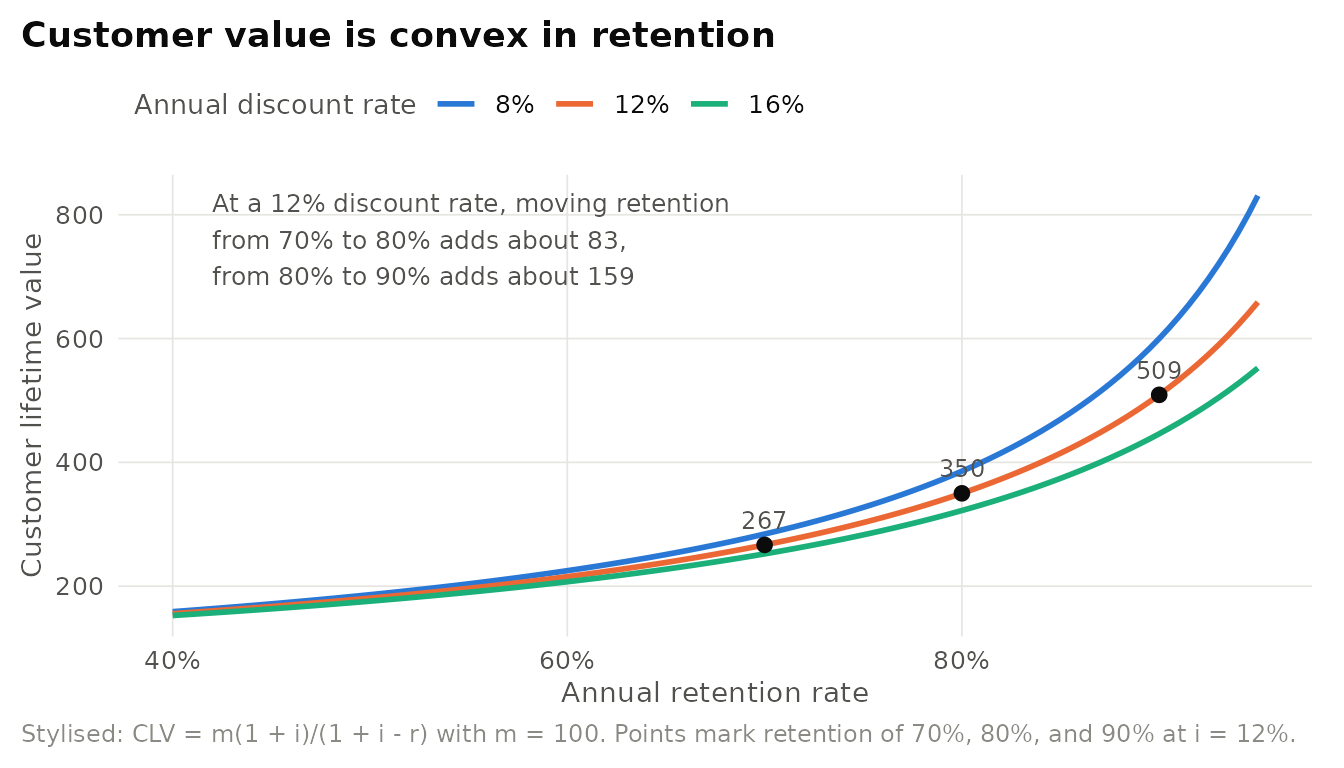
Figure 28.5: Stylised sensitivity of customer lifetime value to the annual retention rate for an annual margin of 100 and three discount rates (infinite horizon, acquisition cost excluded). Value rises slowly at low retention and steeply at high retention, so the same retention gain is worth more to a firm that already retains well.
28.4.3 Evidence and extensions
Two empirical programmes have refined the theory. The first concerns noncontractual settings, such as retailing, in which customers do not announce that they have left. Schmittlein, Morrison, and Colombo (1987) developed the Pareto/NBD model to infer from purchase histories how many customers are still “alive”, and Fader, Hardie, and Lee (2005) offered the simpler BG/NBD alternative that is now widely used for CLV estimation. The second concerns the link between loyalty and profit. Reinartz and Kumar (2000) studied a catalogue retailer and found that long-life customers were not necessarily the most profitable, which challenges the assumption that retention always pays. Retention is valuable only when retained customers generate margins that exceed the cost of keeping them.
How far can customer metrics go? Critics raise three issues. First, CLV models are only as good as their retention estimates, and small errors in \(r\) produce large errors in value because of the convexity shown above. Second, valuing a firm by its customers requires forecasting the acquisition of future customers, which reintroduces the uncertainty that customer metrics were supposed to remove. S. Gupta, Lehmann, and Stuart (2004) found that customer-based valuations tracked market values closely for some firms but not for others, such as fast-growing internet firms. Third, a single-minded focus on CLV can lead firms to “fire” low-value customers or to price-discriminate in ways that damage trust and brand equity. Customer equity is a powerful accounting lens, but it does not by itself say how to build value.
28.4.4 Applications in business
Subscription businesses and CLV. Streaming services, software-as-a-service providers, telecom carriers, and meal-kit firms report churn, average revenue per user, and customer-acquisition cost because these quantities map directly onto the CLV formula. The convexity result explains several common practices. Firms offer discounts to customers who try to cancel, because a saved high-tenure customer is worth more than a new one. They track cohort retention curves rather than averages, because early-life churn and late-life churn have different causes. And they compare the ratio of lifetime value to acquisition cost by channel to decide where to spend. The pitfalls are equally common: counting revenue rather than margin, assuming that a promotional cohort will retain like an organic one, and using an implausibly low discount rate. A useful discipline is to report CLV as a range across plausible retention and discount assumptions, as in Figure 28.5, rather than as a single number.
Sample hypotheses. H1. Customers acquired through price promotions will have lower retention and CLV than customers acquired through referrals. H2. Improvements in service quality will raise customer equity mainly through the relationship-equity driver. H3. Firms that disclose customer metrics will have lower analyst forecast dispersion.
Data and methods. Transaction logs and CRM data, BG/NBD and Pareto/NBD models for noncontractual settings (Fader, Hardie, and Lee 2005, Schmittlein, Morrison, and Colombo 1987), survival models for contractual churn, brand-switching matrices (Rust, Lemon, and Zeithaml 2004), and firm-level valuation from public disclosures (S. Gupta, Lehmann, and Stuart 2004).
Confusing revenue with value and averages with individuals. CLV uses margins, not revenue, and should be computed by cohort or segment. An average CLV hides the heterogeneity that makes customer equity actionable, and a retention rate estimated in one period can change sharply when the competitive environment or the acquisition channel changes.
28.5 Hierarchy of Effects
Core claim. Advertising moves consumers through a sequence of mental stages, from awareness and knowledge through liking, preference, and conviction to purchase. Each stage is a prerequisite for the next and can serve as an intermediate measure of advertising effectiveness.
Origins. Advertising research. Lavidge and Steiner (1961), drawing on a long tradition of sales-stage models such as AIDA (attention, interest, desire, action). Reviewed critically by Barry and Howard (1990) and Vakratsas and Ambler (1999).
Level of analysis. Individual consumer, aggregated to campaign metrics.
Key constructs. Cognitive stage (awareness, knowledge), affective stage (liking, preference), conative stage (conviction, purchase), involvement.
Boundary conditions. The “learn, feel, do” order is most plausible for high-involvement, considered purchases. For low-involvement and habitual purchases, experience often precedes attitude.
Related theories. Elaboration likelihood model (Section 26.1), Mere exposure effect (Section 29.1), Information processing model (Section 31.1), Theory of planned behavior (Section 10.3), SOR framework (Section 31.5).
28.5.1 Core logic
Lavidge and Steiner (1961) proposed that advertising should be evaluated not only by sales, which are influenced by many factors, but by its ability to move consumers up a series of steps: awareness, knowledge, liking, preference, conviction, and purchase. The six steps map onto the three classic components of attitude: the cognitive (thoughts), the affective (feelings), and the conative (motives and behaviour). The model had two lasting consequences. It justified intermediate advertising objectives, such as raising awareness, which could be measured before sales effects materialised. And it gave rise to the marketing funnel, the most widely used planning heuristic in advertising and digital marketing (Figure 28.6).
Figure 28.6: The hierarchy of effects. Advertising is assumed to move consumers sequentially through cognitive, affective, and conative stages. Involvement and product type moderate whether the sequence holds. Redrawn from Lavidge and Steiner (1961), with the moderator drawn from Vaughn (1980).
28.5.2 Evidence and critiques
The sequence was questioned almost from the start. Research on low-involvement learning suggested that for many inexpensive, frequently purchased products, consumers buy first and form attitudes afterwards, and exposure alone can raise liking without much thought (see the mere exposure effect (Section 29.1)). Vaughn (1980) organised these alternatives in the FCB grid, which crosses involvement (high versus low) with the nature of the decision (thinking versus feeling) and assigns a different order of stages to each quadrant (Table 28.7).
| Model | Assumed sequence | Where it fits best | Source |
|---|---|---|---|
| Lavidge-Steiner hierarchy | Awareness, knowledge, liking, preference, conviction, purchase | High-involvement, considered purchases | Lavidge & Steiner (1961) |
| FCB grid: informative | Learn, feel, do | High involvement, thinking (insurance, appliances) | Vaughn (1980) |
| FCB grid: affective | Feel, learn, do | High involvement, feeling (fashion, perfume) | Vaughn (1980) |
| FCB grid: habitual | Do, learn, feel | Low involvement, thinking (household staples) | Vaughn (1980) |
| FCB grid: satisfaction | Do, feel, learn | Low involvement, feeling (snacks, soft drinks) | Vaughn (1980) |
| Integrative space | Cognition, affect, and experience interact without a fixed order | All categories, filtered by motivation and ability | Vakratsas & Ambler (1999) |
The most influential critique came from Vakratsas and Ambler (1999), who reviewed more than 250 studies on how advertising works. They found little support for a fixed temporal sequence of effects. They proposed instead that advertising effects are best understood in a space defined by cognition, affect, and experience, with consumers’ motivation and ability acting as filters, and with effects varying by product category, competitive context, and consumers’ prior experience with the brand.
Is the funnel dead? Defenders argue that the hierarchy remains a useful planning model even if it is a poor process model: firms still need to create awareness before consideration, and stage metrics are easier to track than sales. Critics respond that treating stages as sequential leads managers to over-invest in awareness, to ignore post-purchase experience as a driver of attitudes, and to misattribute sales to the last touchpoint in a digital funnel. Barry and Howard (1990) concluded that the hierarchy has intuitive and practical appeal but weak empirical support for strict sequencing. The productive middle ground is to keep the constructs, which are measurable and meaningful, while dropping the assumption that they occur in a fixed order.
Digital marketing has given the hierarchy a second life and a new set of problems. Online funnels track impressions, clicks, visits, add-to-cart events, and purchases, which look like a measurable hierarchy of effects. Yet these stages are behavioural traces, not mental states, and they suffer from selection: people who were already likely to buy are more likely to click. Attributing a purchase to the last ad clicked, or to each stage in proportion to its position, assumes the sequential causal structure the hierarchy proposes. Randomised holdout experiments, in which some consumers are prevented from seeing a campaign, are the most reliable way to test whether each stage actually adds incremental effect.
28.5.3 Applications in business
Illustrative scenario: diagnosing a campaign with stage metrics. A consumer-electronics brand launches a new pair of earbuds with a television and online video campaign. Brand tracking shows prompted awareness rising sharply, but consideration and purchase intent barely move, and sales lag. A strict hierarchy reading would recommend more reach. A Vakratsas and Ambler reading asks a different question: is the bottleneck cognitive (consumers do not know why the product is better), affective (they do not like the brand), or experiential (they have tried a competitor and are satisfied)? If reviews and retail demos show that people who try the earbuds rate them highly, the binding constraint is experience, and in-store trials or a generous return policy may outperform additional advertising. The stage constructs remain valuable as diagnostics. What changes is the assumption about the order in which they must be built.
Sample hypotheses. H1. Advertising effects on purchase will be mediated by awareness and attitude for high-involvement categories, but will operate mainly through trial and post-purchase evaluation for low-involvement categories. H2. Exposure frequency will raise brand liking even without changes in brand knowledge in low-involvement categories. Designs. Brand-tracking panels linked to purchase data, geo-randomised advertising experiments, and path models that compare sequential and non-sequential specifications.
Treating funnel metrics as causal stages. Correlated movements in awareness, liking, and purchase do not show that one causes the next. Purchase and experience can drive attitudes, and the same advertising can affect several stages at once. Test the order rather than assume it.
28.6 Product Life Cycle
Core claim. Products pass through a predictable sequence of stages, introduction, growth, maturity, and decline, each with characteristic patterns of sales, profit, competition, and appropriate strategy.
Origins. Marketing strategy. Popularised by T. Levitt (1965). Critically assessed by Dhalla and Yuspeh (1976) and Day (1981).
Level of analysis. Product class or product form (weaker for individual brands).
Key constructs. Introduction, growth, maturity, decline, takeoff, slowdown, product class versus product form versus brand.
Boundary conditions. The curve describes product classes better than brands, and its shape and timing vary widely. It is partly endogenous to marketing decisions.
Related theories. Bass model (Section 10.2), Diffusion of innovations (Section 10.1), Dominant design (Section 12.5), Disruptive innovation (Section 12.2), Competitive dynamics (Section 11.3).
28.6.1 Core logic
T. Levitt (1965) urged managers to “exploit” the product life cycle by anticipating each stage rather than reacting to it. In the introduction stage, sales grow slowly as buyers learn about the product, and profits are negative because of development and launch costs. In growth, sales accelerate as adoption spreads and competitors enter. In maturity, sales level off, competition intensifies, and price pressure squeezes margins. In decline, sales fall as substitutes and changing tastes erode demand. Levitt’s practical advice was to plan, while a product is still growing, the moves that will extend its life: more frequent use by current users, more varied use, new users, and new uses for the basic material.
The PLC is the managerial counterpart of the diffusion process studied in diffusion of innovations (Section 10.1) (Rogers 2003) and formalised in the Bass model (Section 10.2) (F. M. Bass 1969): the growth stage corresponds to the steep part of the adoption S-curve, and maturity to the period when most potential adopters have adopted and sales depend on replacement and repeat purchase. Figure 28.7 shows the stylised curve.
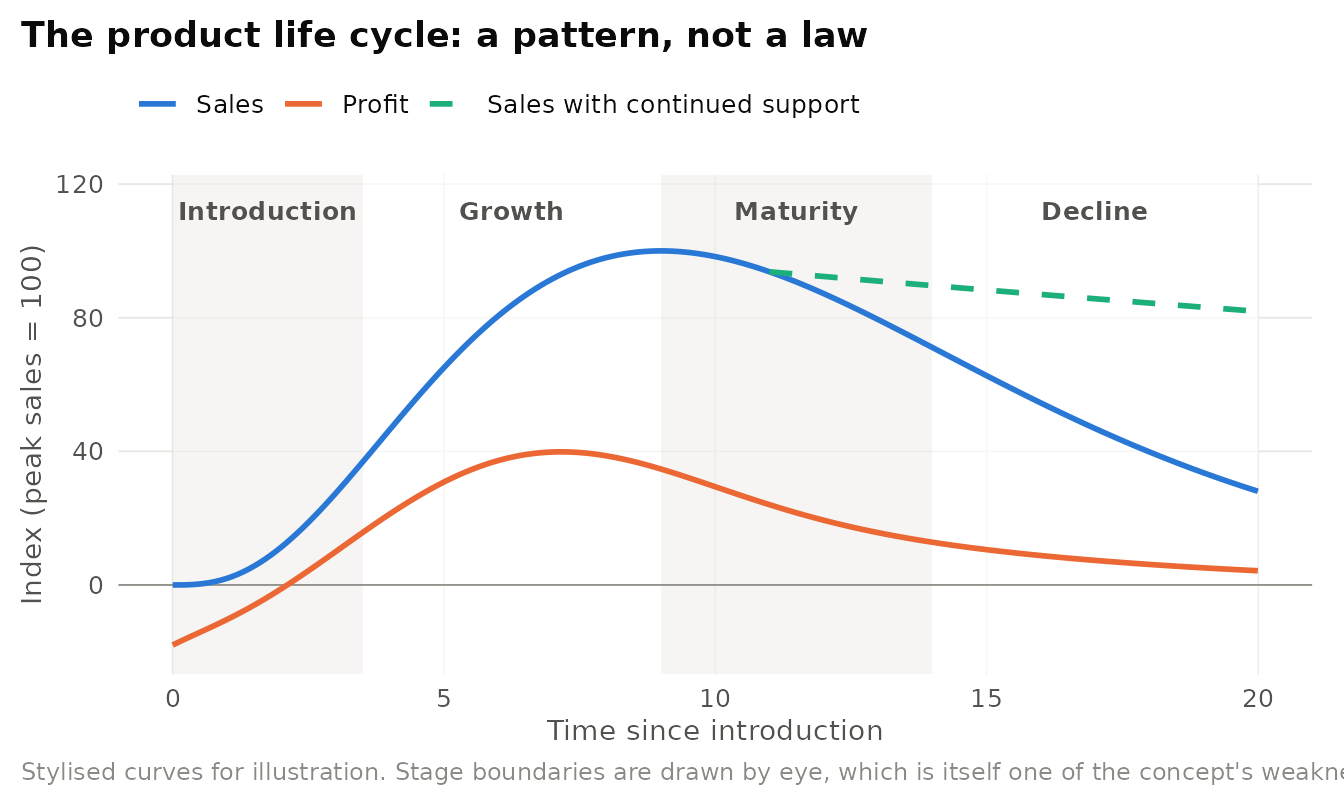
Figure 28.7: Stylised product life cycle for a product class. Sales (blue) follow an S-shaped rise and eventual decline. Profit (orange) is negative at launch and peaks before sales do, as competition compresses margins. The dashed line shows the alternative emphasised by Dhalla and Yuspeh (1976): continued support or repositioning can sustain a mature product, so decline is partly a consequence of strategy.
Table 28.8 presents the conventional characteristics of product life cycle stages, as described in Levitt (1965) and later textbook treatments.
| Stage | Sales | Profits | Competition | Typical marketing emphasis |
|---|---|---|---|---|
| Introduction | Low, slow growth | Negative | Few rivals | Build awareness and trial, educate the market |
| Growth | Rapid growth | Rising, often peaking late in the stage | Entry increases | Build preference, expand distribution |
| Maturity | Slowing, then flat | Declining as price competition grows | Many rivals, shake-out | Defend share, differentiate, extend uses |
| Decline | Falling | Low or negative | Exit by weaker rivals | Harvest, reposition, or divest |
28.6.2 Evidence and critiques
Forget the product life cycle? Dhalla and Yuspeh (1976) published one of the most cited attacks on a marketing concept. They argued that the PLC lacks empirical support at the brand level, that its stages cannot be identified in advance, and that its prescriptions can be self-fulfilling. A manager who believes a brand has entered decline cuts its support, and sales then decline because support was withdrawn. The PLC, in their view, is a dependent variable shaped by marketing decisions, not an independent force that should dictate them. Day (1981) offered a more balanced review. He distinguished product classes, product forms, and brands, and argued that the concept is most defensible for product forms, least defensible for brands, and useful mainly as a framework for thinking about how market conditions evolve rather than as a forecasting tool.
Later empirical research has replaced the generic curve with models of specific turning points. Golder and Tellis (1997) modelled the takeoff of new consumer durables, the point at which slow early sales give way to rapid growth, and Golder and Tellis (2004) studied the slowdown that ends the growth stage. They explained the PLC’s sharp turns partly through informational cascades, in which consumers’ adoption decisions follow the observed decisions of others. These studies keep the PLC’s core insight, that markets pass through qualitatively different phases, while making the phases measurable and predictable.
28.6.3 Applications in business
Extending mature products. Levitt’s strategy of finding new uses has a classic illustration in Arm & Hammer baking soda. In the early 1970s the brand promoted placing an open box in the refrigerator to absorb odours, giving a mature, slow-growing product a new and recurring use. The revival of vinyl records since the late 2000s shows the limits of PLC determinism from another angle: a product form widely assumed to be in terminal decline found new demand among collectors and younger buyers, supported by record labels and retailers that kept supply alive. Both cases support the Dhalla and Yuspeh critique. Whether a product is “mature” or “declining” depends partly on how managers define its market and whether they continue to invest. For forecasting genuinely new categories, managers are better served by diffusion models such as the Bass model (Section 10.2) than by a generic curve.
Research uses. Model stage transitions as events (hazard models of takeoff and slowdown), estimate diffusion parameters by product form, or test whether marketing-mix elasticities differ across stages. Sample hypothesis: advertising elasticity will be higher in the growth stage than in maturity, whereas price elasticity will be higher in maturity. Data. Category sales histories, scanner data, and industry association statistics.
Reading the stage, then cutting the budget. Labelling a brand as “in decline” on the basis of a few flat quarters, then harvesting it, can turn a temporary slowdown into a permanent one. Diagnose why sales are flattening (saturation, substitution, or under-investment) before concluding that the product has entered a new stage.
28.7 Marketing Mix
Core claim. A marketing program is a combination of controllable decision variables that managers blend to reach target customers. The best-known classification is McCarthy’s 4Ps: product, price, place, and promotion.
Origins. Marketing management. Borden (1964) popularised the “marketing mix”, McCarthy (1960) condensed it into the 4Ps, and Booms and Bitner (1981) added three Ps for services. Critically reviewed by Constantinides (2006).
Level of analysis. Firm and offering.
Key constructs. Product, price, place (distribution), promotion (communication), people (participants), physical evidence, process.
Boundary conditions. An organizing framework rather than a causal theory. Most suited to consumer goods. Less complete for services, relationships, and digital platforms.
Related theories. Market orientation, Service-dominant logic, Product life cycle, Five forces (Section 31.4).
28.7.1 Origins and core logic
Borden (1964) described the marketing manager as a “mixer of ingredients”, a phrase he credited to his Harvard colleague James Culliton, who blends a set of elements into a program suited to the firm’s market. Borden’s list was long, covering product planning, pricing, branding, channels of distribution, personal selling, advertising, promotions, packaging, display, servicing, physical handling, and fact finding and analysis. McCarthy (1960) condensed the idea into four categories, product, price, place, and promotion, a framework that became the organizing structure of introductory marketing textbooks.
Services researchers argued that four Ps were not enough. Because services are produced and consumed at the same time, the people who deliver them, the setting in which they are delivered, and the steps customers go through are part of the offering. Booms and Bitner (1981) therefore added participants (usually called people), physical evidence, and process, yielding the 7Ps. The physical-evidence element connects to research on servicescapes, the designed physical environment of service delivery (Bitner 1992) (Table 28.9).
| Element | Core decision | Airline illustration | Origin |
|---|---|---|---|
| Product | What is offered: features, quality, brand, service level | Routes, cabin classes, baggage allowance | McCarthy (1960) |
| Price | What customers pay and how | Fare classes, dynamic pricing, fees | McCarthy (1960) |
| Place | How the offering reaches customers | Direct website and app, travel agents, alliances | McCarthy (1960) |
| Promotion | How the firm communicates | Advertising, loyalty-programme offers | McCarthy (1960) |
| People | Who delivers and co-produces the service | Gate agents, cabin crew, other passengers | Booms & Bitner (1981) |
| Physical evidence | Tangible cues to quality | Lounge design, cabin interior, uniforms | Booms & Bitner (1981) |
| Process | How the service is delivered | Check-in, boarding sequence, rebooking | Booms & Bitner (1981) |
28.7.2 Evidence and critiques
As a classification scheme, the marketing mix is not “tested” in the way a causal theory is. Its empirical legacy lies instead in research on how the elements work: price and advertising elasticities, distribution effects, and the interactions among them. The critiques concern whether the classification directs managerial attention well.
Is the 4P framework obsolete? Constantinides (2006) reviewed critiques of the mix across consumer, relationship, services, retail, and industrial marketing, and e-commerce. A common theme is that the 4Ps are internally oriented: they list what the firm controls rather than what customers experience, they treat the customer as a passive target, and they say little about relationships, interaction, or co-creation. Relationship marketing scholars argued that retention and trust do not fit in any P (see commitment-trust theory (Section 9.6) (R. M. Morgan and Hunt 1994)). S-D logic goes further and questions the idea that value is something the firm “mixes” at all (Vargo and Lusch 2004). Defenders reply that the 4Ps were never intended as a theory of value. They are a checklist that ensures no major decision is forgotten, and their simplicity is the source of their longevity. Numerous alternative lists have been proposed, but none has displaced the original.
Digital markets stretch each element. Product increasingly includes software that changes after purchase. Price is set by algorithms that respond to demand in real time and by subscription and freemium structures that separate the price of access from the price of use. Place is often a platform owned by someone else, such as an app store or marketplace, which shifts bargaining power toward the intermediary. And promotion now includes content created by customers themselves, which the firm can encourage but not control. None of these changes makes the mix irrelevant. They do make the boundary between controllable and uncontrollable variables less clear, which is precisely the concern raised by critics who argue that marketing is a process of interaction rather than a set of levers.
28.7.3 Applications in business
Designing a coherent mix. The practical power of the marketing mix lies in consistency among elements. A premium price must be supported by product quality, selective distribution, and communication that justifies the price. Starbucks, under Howard Schultz, articulated its stores as a “third place” between home and work. In 7P terms, that positioning was delivered as much through physical evidence (store design), people (baristas), and process (how orders are taken and drinks prepared) as through product and price. A common failure is an inconsistent mix, such as a luxury product sold through discount channels or a low-cost service that promises personal attention it cannot deliver. The latter is also Gap 4 in the gaps model.
Research uses. Marketing-mix models (time-series regressions of sales on price, advertising, distribution, and promotion) estimate element-level elasticities and support budget allocation. Sample hypothesis: the effect of advertising on sales will be stronger when distribution breadth is high (complementarity among mix elements). Designs. Store-week scanner data, geo-experiments, and hierarchical Bayesian models that pool elasticities across markets.
Optimising each P separately. Separate budget owners for pricing, promotion, and distribution often optimise their own lever at the expense of the whole. Interactions among elements are the point of a mix. Model them explicitly, and evaluate the program from the customer’s perspective as well as the firm’s.
28.8 Chapter Summary
- Market orientation, the generation, dissemination, and use of market intelligence, is positively associated with performance, mainly through innovation, quality, and loyalty (Kohli and Jaworski 1990, Narver and Slater 1990, Kirca, Jayachandran, and Bearden 2005). A proactive orientation guards against the trap of serving only current customers (Narver, Slater, and MacLachlan 2004).
- Service-dominant logic reframes all exchange as service and locates value in use, co-created by customers (Vargo and Lusch 2004, 2016). It is a powerful lens for servitization and outcome-based business models, but it needs mid-range theories to generate testable predictions.
- The gaps model traces the customer’s quality gap to four internal gaps in knowledge, standards, delivery, and communication (Parasuraman, Zeithaml, and Berry 1985). SERVQUAL’s difference scores are contested, and performance-only measures often predict better (Cronin and Taylor 1992).
- Customer equity values customers as assets. CLV is convex in retention, so retention improvements often matter more than margin or acquisition-cost improvements (Blattberg and Deighton 1996, S. Gupta, Lehmann, and Stuart 2004, Rust, Lemon, and Zeithaml 2004).
- The hierarchy of effects remains a useful set of measurable constructs, but evidence does not support a fixed sequence from cognition to affect to behaviour (Lavidge and Steiner 1961, Vakratsas and Ambler 1999).
- The product life cycle describes how markets evolve, but stage boundaries are hard to identify and the curve is partly shaped by managers’ own decisions (T. Levitt 1965, Dhalla and Yuspeh 1976).
- The marketing mix organises controllable decisions. The 7Ps extend it to services, and critics argue that it remains firm-centric (Borden 1964, Booms and Bitner 1981, Constantinides 2006).
Table 28.10 presents the comparison of the chapter’s theories.
| Theory | Unit of analysis | Core mechanism | Main critique | Typical business use |
|---|---|---|---|---|
| Market orientation | Business unit | Intelligence generation, dissemination, responsiveness | Common-method bias, can favour current customers | Organizational audits, cross-functional routines |
| Service-dominant logic | Service ecosystem | Value co-creation in use | Broad and hard to falsify | Servitization, outcome-based contracts |
| Gaps model of service quality | Firm and customer | Expectations versus perceptions, four provider gaps | Difference-score psychometrics | Service diagnostics and improvement |
| Customer equity | Customer and firm | Discounted margins weighted by retention | Sensitive to retention estimates | Subscription metrics, acquisition budgets |
| Hierarchy of effects | Consumer | Sequential cognitive, affective, conative stages | Little support for fixed order | Campaign objectives and funnel tracking |
| Product life cycle | Product class | Diffusion, saturation, competition | Self-fulfilling and descriptive | Stage-based planning, portfolio reviews |
| Marketing mix | Offering | Consistent blend of controllable variables | Internally oriented | Program design and budget allocation |
28.9 Discussion Questions
- Market orientation and disruptive innovation seem to give opposite advice about listening to customers. Reconcile the two using the distinction between responsive and proactive market orientation, and propose a measure that would let you test your reconciliation.
- Service-dominant logic has been described as a perspective rather than a theory. Derive two falsifiable hypotheses from it for an equipment manufacturer considering a shift to outcome-based contracts.
- A hotel chain’s SERVQUAL survey shows the largest gap in responsiveness. Using the gaps model, list the internal sources that could produce this gap and the data you would collect to distinguish among them.
- Using the CLV function in this chapter, find the retention rate at which a subscription business with a monthly margin of 6 and an acquisition cost of 40 breaks even. How sensitive is your answer to the discount rate?
- Design a field experiment that tests whether the hierarchy of effects holds for a low-involvement grocery product. What pattern of results would support Vakratsas and Ambler’s critique?
- A consumer-goods firm wants to cut support for a brand it believes has entered the decline stage. What evidence would you request before agreeing, and how does the Dhalla and Yuspeh critique inform your request?
28.10 Further Reading
- Kohli and Jaworski (1990): the defining statement of market orientation as a behavioural construct, with propositions that still organise the field.
- Kirca, Jayachandran, and Bearden (2005): the meta-analytic synthesis of what market orientation does and does not predict.
- Vargo and Lusch (2004): the article that launched service-dominant logic. Read it with Vargo and Lusch (2016) to see how the framework evolved.
- Parasuraman, Zeithaml, and Berry (1985): the gaps model. Pair it with Cronin and Taylor (1992) for the measurement debate.
- S. Gupta, Lehmann, and Stuart (2004): a clear demonstration that customer metrics can value a firm, and a template for CLV analysis.
- Vakratsas and Ambler (1999): the essential review of how advertising works, and why the hierarchy is too simple.
- Dhalla and Yuspeh (1976): a short, forceful critique that every user of the product life cycle should read.
- Constantinides (2006): a comprehensive review of critiques of the marketing mix.