10 Innovation Diffusion and Technology Adoption
Why did hybrid seed corn, which offered American farmers markedly higher yields, take more than a decade to spread through communities in which its benefits were plain to see? Why do some technology products sell briskly to enthusiasts and then stall, while others glide into the mainstream? Why does a firm that spends heavily on a new enterprise system often find, a year later, that employees still keep their real work in spreadsheets? And how can a company forecast the sales of a product that has never existed before?
These questions concern the adoption of new ideas, products, and technologies by individuals and organizations, and the diffusion of those innovations through a population over time. This chapter brings together two traditions that address them at different levels. The macro tradition, diffusion of innovations theory and the Bass model, explains the aggregate shape of adoption over time: why cumulative adoption follows an S-curve and how communication among adopters drives it. The micro tradition, the theory of reasoned action, the theory of planned behavior, the technology acceptance model, and the unified theory of acceptance and use of technology, explains why a given individual decides to adopt and use a technology. Each tradition supplies what the other lacks: diffusion models describe the curve but say little about individual decisions, while acceptance models explain individual decisions but say little about social dynamics (Table 10.1).
| Theory | Core question | Level of analysis | Key source |
|---|---|---|---|
| Diffusion of innovations | How and why do innovations spread through social systems? | Population / social system | Rogers (2003) |
| Bass diffusion model | How can the time path of first purchases of a new product be forecast? | Market | Bass (1969) |
| Theory of reasoned action / planned behavior | What determines intentions and behaviour? | Individual | Fishbein & Ajzen (1975), Ajzen (1991) |
| Technology acceptance model (TAM) | Why do people accept or reject information technology? | Individual | Davis (1989) |
| UTAUT / UTAUT2 | What unified set of factors predicts technology intention and use? | Individual (in organizations / consumer markets) | Venkatesh et al. (2003, 2012) |
10.1 Diffusion of Innovations
Core claim. Innovations spread through a social system over time via communication channels. The rate of adoption depends on how potential adopters perceive the innovation’s attributes, and adoption over time typically follows an S-shaped cumulative curve as early adopters influence later ones.
Origins. Rural sociology (B. Ryan and Gross 1943), agricultural economics (Griliches 1957), and medical sociology (Coleman, Katz, and Menzel 1966). Synthesized by Rogers (2003), first published in 1962.
Level of analysis. The social system (community, market, industry, or organization), with individual adoption decisions as the micro-foundation.
Key constructs. Innovation, communication channels, time, social system, perceived attributes (relative advantage, compatibility, complexity, trialability, observability), adopter categories, opinion leaders, change agents, innovation-decision process, re-invention, critical mass.
Boundary conditions. Adoption is voluntary (or partly so), information about the innovation spreads through observable channels, and potential adopters are connected. Mandated adoption, network-externality goods, and fads follow different dynamics.
Related theories. Bass model, Strength of weak ties (Section 9.3), Technology acceptance model, Institutional theory (Section 7.2), Social influence (Chapter 22).
10.1.1 Origins and intellectual history
Diffusion research has unusually concrete origins. B. Ryan and Gross (1943) interviewed farmers in two Iowa communities about their adoption of hybrid seed corn, an innovation that offered clear yield advantages. Adoption nonetheless unfolded over many years: a few farmers planted hybrid seed early, most followed only after seeing it work on neighbours’ farms, and a minority held out much longer. Salespeople were an important source of first knowledge about the seed, but neighbours were more influential in the decision to adopt: an early demonstration that awareness and persuasion run through different channels. Farmers also typically tried hybrid seed on part of their acreage before converting fully, illustrating the importance of trialability.
Griliches (1957) analysed the same innovation from an economic perspective. Fitting logistic curves to adoption across American states and crop-reporting districts, he showed that differences in when adoption began, how fast it proceeded, and where it levelled off could be explained largely by economic factors: the profitability of hybrid corn in each area and the availability of hybrids adapted to local conditions. The Ryan-Gross and Griliches studies are often read as rival sociological and economic accounts, but together they establish that both perceived profitability and social communication shape diffusion.
Coleman, Katz, and Menzel (1966) extended the paradigm to medicine with their Medical Innovation study of physicians’ adoption of a new antibiotic in four Illinois cities. Doctors who were more integrated into professional networks adopted earlier, and the authors interpreted the pattern as evidence of social contagion. The study became the classic demonstration of network effects (Section 17.6) in diffusion, and, decades later, a cautionary tale (see the debate box below).
Rogers (2003) synthesized these and thousands of later studies into a general theory. In his account, diffusion is the process through which an innovation is communicated, via particular channels and over time, among the members of a social system, a definition that identifies four main elements: the innovation, communication channels, time, and the social system.
10.1.2 Core logic: perceived attributes and the decision process
Rogers argued that the rate of adoption is shaped above all by how potential adopters perceive an innovation. Five perceived attributes recur across studies (Table 10.2). A meta-analysis by Tornatzky and Klein (1982) found that relative advantage, compatibility, and complexity were the attributes most consistently related to adoption, and G. C. Moore and Benbasat (1991) developed a widely used instrument for measuring perceived innovation characteristics in information systems research.
| Attribute | Definition | Effect on rate of adoption | Business lever |
|---|---|---|---|
| Relative advantage | Degree to which the innovation is perceived as better than the idea it supersedes | Positive | Quantify savings, price below value, demonstrate ROI |
| Compatibility | Consistency with existing values, past experience, and needs | Positive | Integrations, familiar interfaces, position as an upgrade |
| Complexity | Degree to which the innovation is perceived as difficult to understand and use | Negative | Simplify onboarding, default settings, training |
| Trialability | Degree to which it can be experimented with on a limited basis | Positive | Free trials, pilots, freemium tiers, test drives |
| Observability | Degree to which results are visible to others | Positive | Case studies, visible design, referral programmes, usage dashboards |
At the individual level, Rogers described an innovation-decision process with five stages: knowledge (exposure and understanding), persuasion (forming a favourable or unfavourable attitude), decision (adoption or rejection), implementation (putting the innovation to use, often with re-invention, or modification by the user), and confirmation (seeking reinforcement and possibly reversing the decision). Mass-media channels matter most at the knowledge stage. Interpersonal channels, especially with near-peers, matter most at the persuasion stage.
The core propositions can be summarized as follows:
- P1 (Perceived attributes). Innovations perceived as having greater relative advantage, compatibility, trialability, and observability, and less complexity, are adopted more rapidly.
- P2 (Interpersonal influence). Interpersonal communication with prior adopters, especially similar others, is the main driver of the persuasion stage. Diffusion therefore accelerates as the number of adopters grows.
- P3 (S-curve). Cumulative adoption follows an S-shaped curve: slow at first, rapid once interpersonal networks are activated, and slowing as the pool of non-adopters is exhausted.
- P4 (Opinion leadership). Adoption by opinion leaders, members whose views others seek, accelerates adoption by their followers.
- P5 (Adopter heterogeneity). Earlier adopters differ systematically from later adopters in socio-economic status, personality, and communication behaviour.
10.1.3 Mechanism: adopter categories and the S-curve
Rogers partitioned adopters by the timing of their adoption relative to the average, using standard deviations of a normal distribution of adoption times. The resulting categories (Figure 10.1) are innovators (the first 2.5 per cent), early adopters (the next 13.5 per cent), the early majority (34 per cent), the late majority (34 per cent), and laggards (the final 16 per cent). The percentages follow by construction from the normal curve. They are an ideal type, not an empirical regularity.
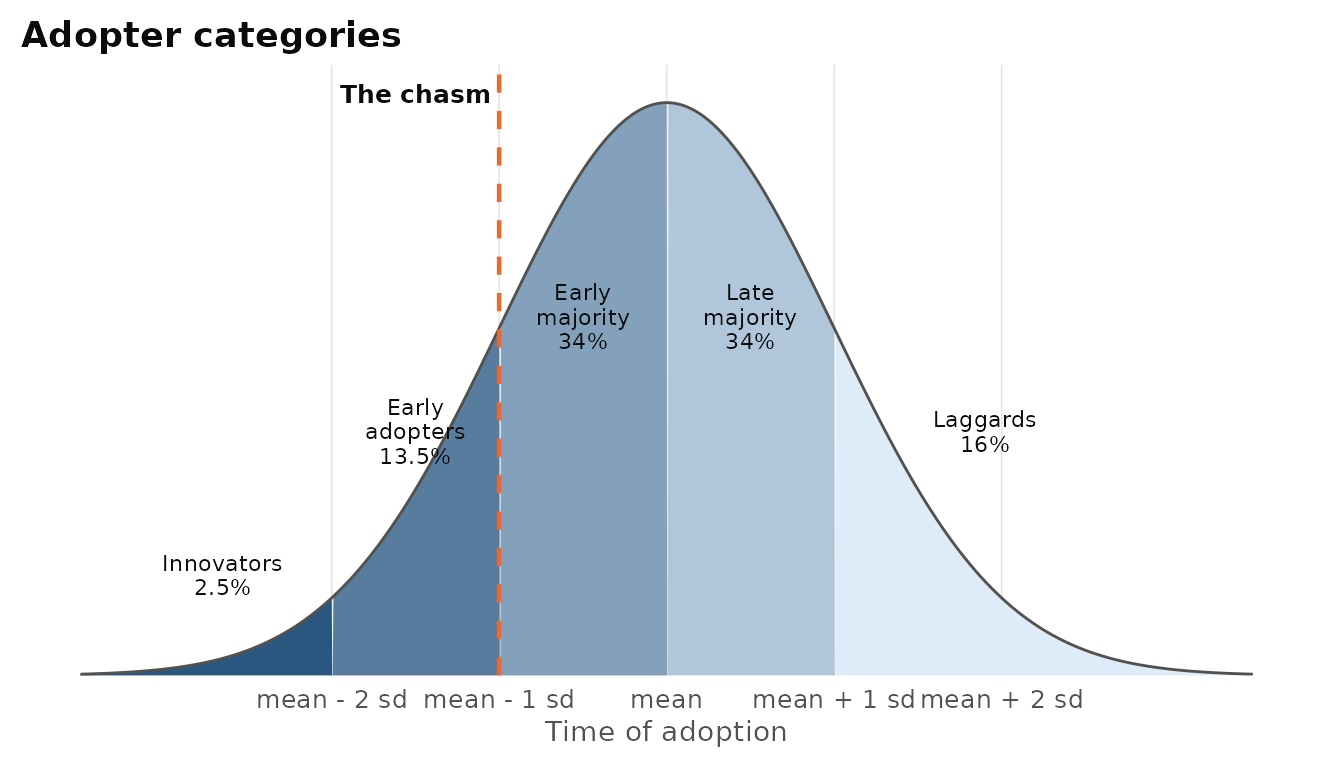
Figure 10.1: Rogers’s adopter categories, defined by standard deviations from the mean adoption time of a normal distribution. The dashed line marks where Moore (1991) locates the ‘chasm’ between early adopters and the early majority. The percentages follow from the normal curve by construction.
The same distribution, accumulated over time, produces the S-curve in Figure 10.2. Adoption is slow while only innovators and early adopters are involved, accelerates as the early majority joins, and decelerates as the remaining non-adopters are increasingly late majority and laggards.
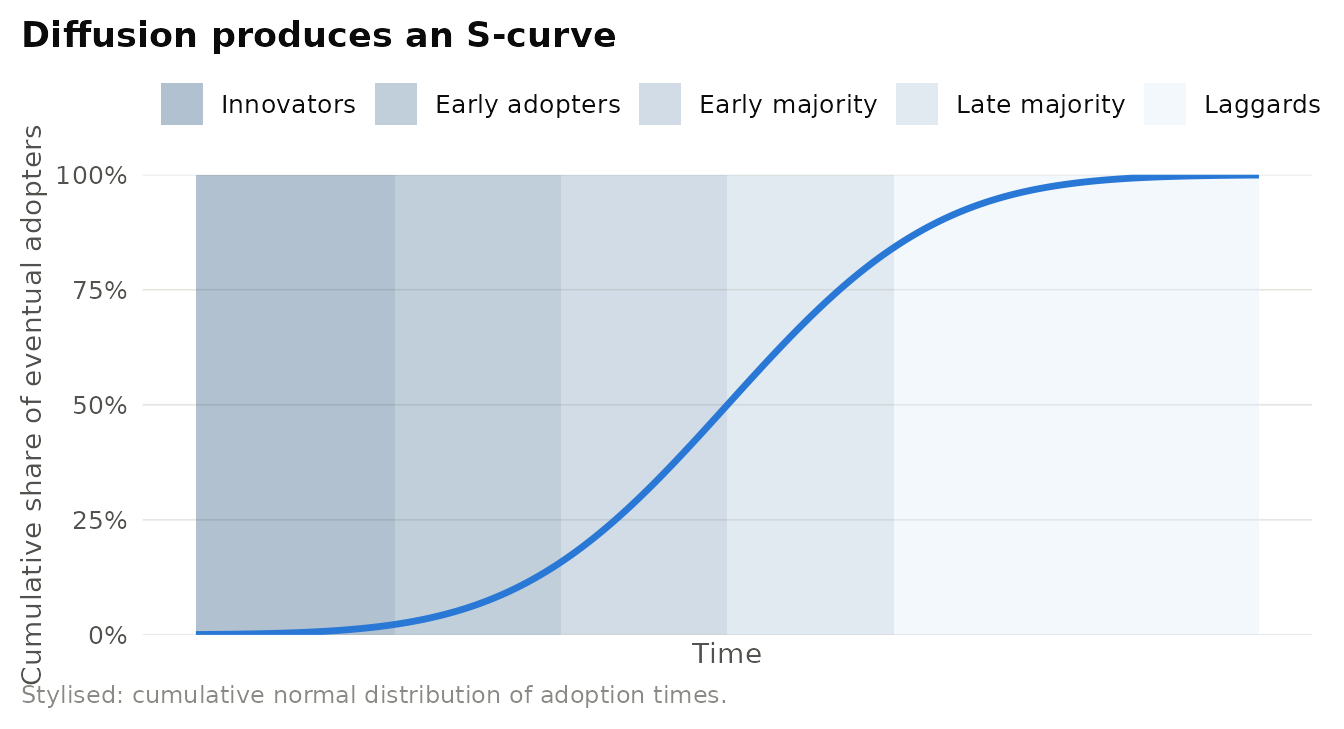
Figure 10.2: Stylised S-shaped cumulative adoption curve implied by normally distributed adoption times, with the period in which each adopter category adopts shaded.
Table 10.3 summarizes the characteristics Rogers associated with each category. Opinion leadership is concentrated among early adopters, which is why they are often the most strategically important segment for marketers: they are close enough to the mainstream to be emulated, yet venturesome enough to adopt before the evidence is in.
| Category | Share (ideal type) | Typical orientation | What they need from the seller |
|---|---|---|---|
| Innovators | 2.5% | Venturesome, tolerate uncertainty, cosmopolitan networks | Access to the technology itself |
| Early adopters | 13.5% | Respected locally, high opinion leadership | A vision of strategic advantage |
| Early majority | 34% | Deliberate, adopt once others have | Proven, complete solutions and references from peers |
| Late majority | 34% | Sceptical, adopt from necessity or peer pressure | Low cost, low risk, standardization |
| Laggards | 16% | Traditional, oriented to the past | Compatibility with existing practices, or no choice |
10.1.4 Evidence and extensions
The diffusion paradigm has been applied to agricultural practices, medical technologies, consumer durables, management practices, policies, and social movements (Strang and Soule 1998). Four extensions are particularly important for business research.
- Organizational adoption. Organizations face knowledge barriers that individuals do not. Attewell (1992) argued that the diffusion of business computing was paced less by awareness than by the burden of organizational learning, and that intermediaries such as service bureaus lowered that burden. Fichman and Kemerer (1999) documented assimilation gaps: many firms that acquired software process innovations had not deployed them, so acquisition-based diffusion curves overstated real adoption.
- Management fashions. Abrahamson (1991) showed that administrative innovations can diffuse, and be rejected, for reasons unrelated to their efficiency, through fad and fashion processes driven by imitation and by fashion-setting organizations such as consultancies.
- Network structure. Thresholds matter: people adopt once enough of their contacts have (M. Granovetter 1978). In an online experiment, Centola (2010) found that a health behaviour spread farther and faster in clustered networks with redundant ties than in random networks, suggesting that behaviours requiring social reinforcement are complex contagions that travel through dense clusters rather than the long, weak bridges that carry information (compare the weak-ties argument (Section 9.3)).
- Contagion versus homophily (Section @ref(homophily (Section 30.2))). Correlated adoption among connected people need not mean that one influenced the other. Aral, Muchnik, and Sundararajan (2009) showed that a large share of apparent contagion in the adoption of a mobile service could be attributed to homophily: similar people adopting for similar reasons.
Was Medical Innovation really about contagion? Van den Bulte and Lilien (2001) reanalysed the Coleman, Katz, and Menzel data together with the volume of pharmaceutical advertising during the diffusion period. Once marketing effort was controlled, the evidence for social contagion largely disappeared: doctors in the same networks adopted together because they were exposed to the same marketing, not because they influenced one another. Later work using richer data on a different drug found evidence of contagion over network ties even after controlling for marketing, with influence depending on who was influencing whom (R. Iyengar, Van den Bulte, and Valente 2011). The lesson is methodological: distinguishing contagion from common exposure and homophily requires designs that measure all three.
Pro-innovation bias. Rogers himself noted that diffusion research tends to assume that innovations should be adopted, that non-adopters are deficient, and that faster diffusion is better. This bias leads researchers to neglect rejection, discontinuance, and re-invention, and to study successful innovations whose diffusion was traceable after the fact.
10.1.5 Moore’s chasm: a practitioner extension
G. A. Moore (1991) argued, from experience marketing high-technology products, that the adoption curve is not continuous. Early adopters, “visionaries” seeking breakthrough advantage, buy for different reasons than the early majority: “pragmatists” seeking proven, incremental improvement and references from peers like themselves. Because pragmatists do not regard visionaries as credible references, products can win the early market and then stall. Moore’s prescription is to cross this chasm by concentrating on a narrow beachhead segment of pragmatic customers and delivering a whole product, the core technology plus the complementary services, integrations, and support that make it usable for that segment, before expanding to adjacent segments.
Academic research has partly vindicated the idea. 1 documented a saddle in the sales of many consumer electronics products: an initial peak, a trough, and a later recovery that eventually exceeds the initial peak. They explained it with a model in which the early market and the main market communicate weakly with one another, so that the early market’s adoption does not fully transfer to the mainstream: essentially a formalization of Moore’s chasm in network terms. Golder and Tellis (1997) showed that the takeoff of really new consumer durables is closely associated with price declines, underscoring the role of relative advantage.
Electric-vehicle diffusion (conceptual analysis). Rogers’s attributes offer a structured diagnosis of electric-vehicle adoption. Relative advantage is mixed: lower running costs and strong acceleration against higher purchase prices in many markets. Compatibility depends on whether a household has home charging and how its driving patterns match vehicle range. Complexity includes learning about charging networks and battery health. Trialability is limited by the cost of the product but can be increased through test drives, rentals, and car-sharing. Observability is high: electric vehicles are visible on the road, and neighbourhood clustering of adoption is consistent with interpersonal influence (though homophily is an alternative explanation). Policy levers map onto the attributes: purchase incentives raise relative advantage, public charging raises compatibility, and fleet programmes increase observability. Norway, where sustained tax incentives preceded electric vehicles becoming the majority of new passenger-car sales in the early 2020s, is the most frequently cited example of policy accelerating diffusion.
Treating adopter percentages as data. The 2.5/13.5/34/34/16 split is a definition based on the normal curve, not an empirical finding. Real adoption distributions are often skewed, and many innovations never reach the “late majority” at all. Use the categories as a segmentation heuristic and estimate the actual distribution of adoption times from data.
10.2 The Bass Diffusion Model
Core claim. The probability that a not-yet-adopter adopts at time \(t\) is the sum of an innovation effect (external influence, independent of prior adopters) and an imitation effect proportional to the share of the market that has already adopted. This simple hazard produces the S-shaped diffusion curve and the bell-shaped curve of new adoptions.
Origins. Marketing science. F. M. Bass (1969), building on epidemic models and on Rogers’s adopter categories. Reviewed by Mahajan, Muller, and Bass (1990) and Peres, Muller, and Mahajan (2010).
Level of analysis. The market for a new product or technology (first purchases).
Key constructs. Market potential (\(m\)), coefficient of innovation (\(p\)), coefficient of imitation (\(q\)), hazard rate, time to peak, takeoff.
Boundary conditions. Applies to first-time adoption of a new product category with a fixed market potential and no repeat purchase. Extensions are needed for repeat purchases, multiple product generations, and strong supply constraints or marketing-mix changes.
Related theories. Diffusion of innovations, Wisdom of the crowd (Section 30.5).
10.2.1 Core logic
F. M. Bass (1969) formalized Rogers’s insight that early adopters and later adopters respond to different influences. Let \(F(t)\) be the cumulative fraction of the eventual adopter population that has adopted by time \(t\), and \(f(t)\) its derivative. The Bass model specifies the hazard of adoption, the probability of adopting at \(t\) given no adoption before \(t\), as
\[ \frac{f(t)}{1 - F(t)} = p + q\,F(t), \]
where \(p\) is the coefficient of innovation (external influence, such as advertising and media) and \(q\) is the coefficient of imitation (internal influence, such as word of mouth (Section 26.3) from previous adopters). With market potential \(m\), the number of new adopters at \(t\) is \(n(t) = m\,f(t)\). Solving the differential equation with \(F(0) = 0\) gives the closed form
\[ F(t) = \frac{1 - e^{-(p+q)t}}{1 + \frac{q}{p}\, e^{-(p+q)t}} . \]
Three implications are especially useful for managers. When \(q > p\), new adoptions rise to a peak and then decline. The peak occurs at \(t^{*} = \ln(q/p) / (p+q)\), when cumulative penetration equals \(\tfrac{1}{2} - \tfrac{p}{2q}\), and the peak rate of adoption is \(m\,(p+q)^2 / (4q)\). A larger \(q\) relative to \(p\) produces a later, sharper peak. A larger \(p\) produces faster early sales and an earlier, flatter peak.
Definition 10.1 Coefficient of innovation (\(p\)). The baseline probability of adoption that does not depend on how many others have adopted: the influence of external communication.
Coefficient of imitation (\(q\)). The increase in the probability of adoption per unit increase in the cumulative adopted share: the influence of prior adopters (F. M. Bass 1969, Mahajan, Muller, and Bass 1990).
10.2.2 Mechanism
Figure 10.3 simulates three stylised products. The benchmark uses parameters of the order reported as averages across many published applications in the meta-analysis of Sultan, Farley, and Lehmann (1990) (\(p \approx 0.03\), \(q \approx 0.38\)). The word-of-mouth-driven product has a very small \(p\) and a large \(q\). The advertising-driven product has a large \(p\) and a small \(q\).
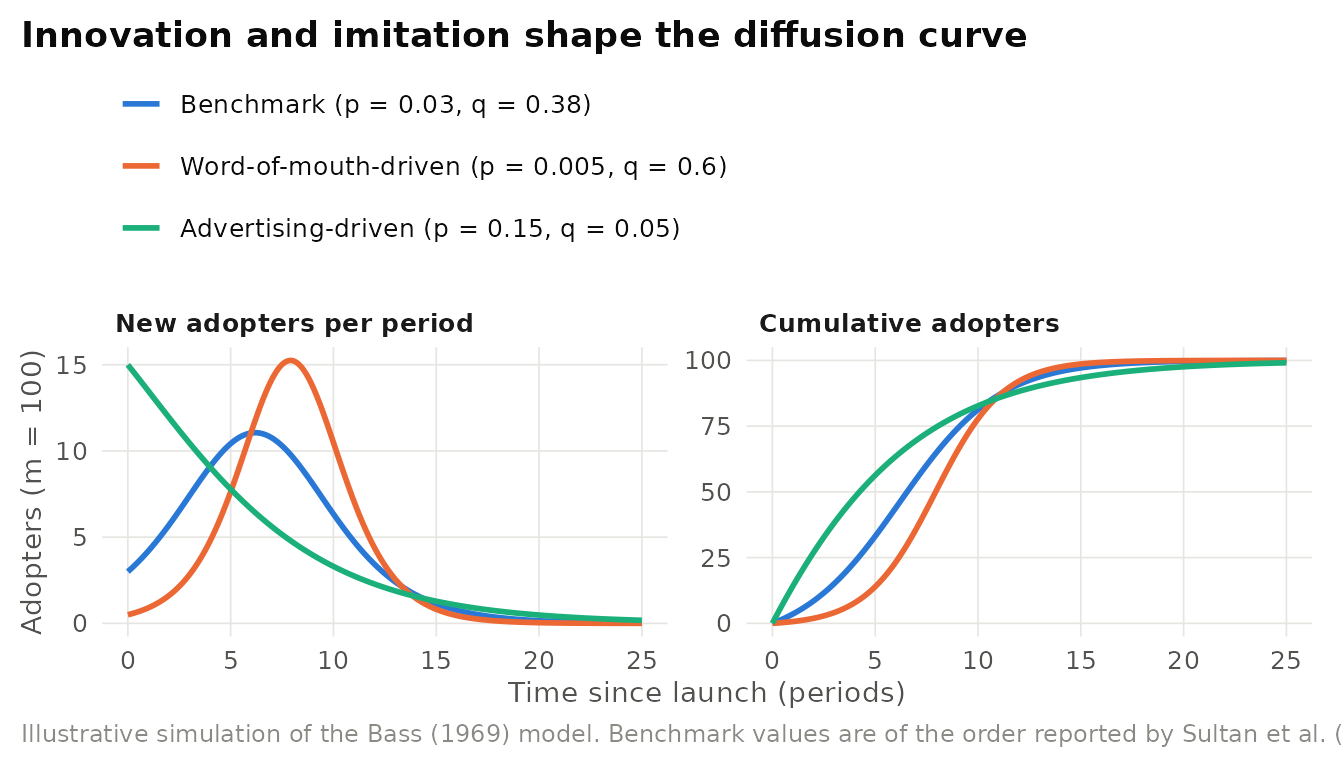
Figure 10.3: Illustrative Bass-model simulations for three stylised products with market potential m = 100. The left panel shows new adopters per period. The right panel shows cumulative adoption. Imitation-driven diffusion produces a late, sharp peak. Innovation-driven diffusion produces an early, flat one.
Table 10.4 computes the managerial quantities implied by each scenario directly from the formulas above.
| Scenario | q / p | Time to peak | Peak adopters per period (m = 100) | Penetration at peak |
|---|---|---|---|---|
| Benchmark (p = 0.03, q = 0.38) | 12.7 | 6.2 | 11.1 | 46% |
| Word-of-mouth-driven (p = 0.005, q = 0.6) | 120.0 | 7.9 | 15.3 | 50% |
| Advertising-driven (p = 0.15, q = 0.05) | 0.3 | 0.0 | 15.0 | 0% |
10.2.3 Estimating the model in R
The Bass model can be estimated from early sales data by nonlinear least squares on per-period adoptions (Srinivasan and Mason 1986). The code below is self-contained and can be adapted by replacing the simulated sales vector with real data. It simulates nine periods of noisy sales for a product with known parameters, then recovers them.
# Bass model: cumulative fraction adopted and per-period adoptions
bass_F <- function(t, p, q) (1 - exp(-(p + q) * t)) / (1 + (q / p) * exp(-(p + q) * t))
bass_sales <- function(t, m, p, q) m * (bass_F(t, p, q) - bass_F(t - 1, p, q))

# Illustrative data: true m = 1,000,000, p = 0.02, q = 0.45, plus noise
set.seed(1969)
period <- 1:9
sales <- round(bass_sales(period, m = 1e6, p = 0.02, q = 0.45) *
                 exp(rnorm(length(period), 0, 0.06)))

# Nonlinear least squares with bounds that keep m, p, q positive
fit <- nls(sales ~ bass_sales(period, m, p, q),
           start = list(m = 8e5, p = 0.03, q = 0.3),
           algorithm = "port", lower = c(1, 1e-4, 1e-4))
round(coef(fit), 3)
#> m p q
#> 929385.913 0.019 0.485Figure 10.4 uses the fitted model to forecast the remainder of the life cycle.
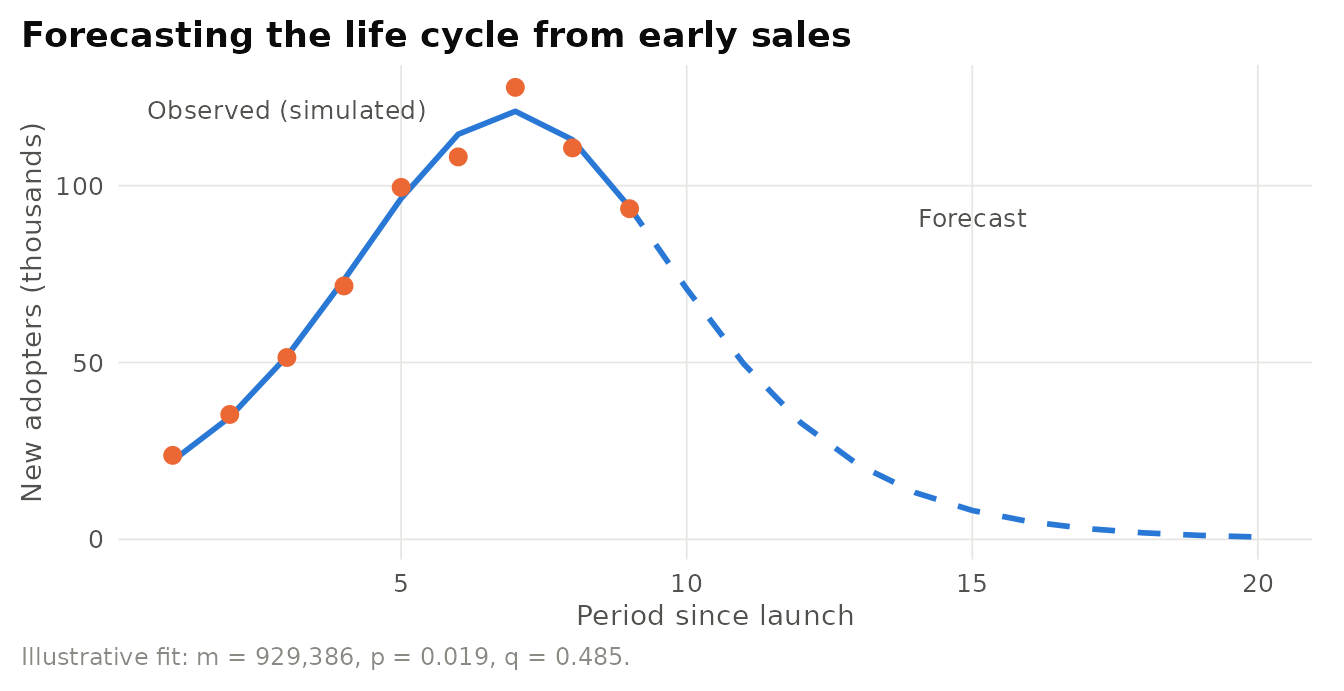
Figure 10.4: Illustrative Bass-model forecast. Points are simulated sales for the first nine periods. The line is the fitted model, extended as a forecast. Simulated data, not an actual product.
10.2.4 Evidence and extensions
The Bass model has become one of the most widely applied models in marketing science (Mahajan, Muller, and Bass 1990, Peres, Muller, and Mahajan 2010). Several findings and extensions are particularly relevant:
- Parameter regularities. Across published applications, \(q\) is typically much larger than \(p\): word of mouth dominates external influence in shaping the curve’s form (Sultan, Farley, and Lehmann 1990). In the absence of sales data, analysts often forecast by analogy, borrowing parameters from similar past products.
- Marketing-mix variables. The original model contains no price or advertising terms. F. M. Bass, Krishnan, and Jain (1994) developed a Generalized Bass Model that includes current marketing effort and showed why the original model fits well anyway: when marketing variables change at roughly constant rates, their effect is absorbed into the estimated parameters.
- Alternative explanations of the S-curve. An S-curve can arise from heterogeneity in adopters’ thresholds or incomes rather than from contagion. Van den Bulte and Stremersch (2004) found that the ratio \(q/p\) was higher in countries with greater income inequality, consistent with an income-heterogeneity interpretation of what the Bass model labels “imitation”.
- Beyond first purchase. Extensions cover repeat purchases, successive technology generations, cross-country diffusion, competition among brands, and network externalities (Peres, Muller, and Mahajan 2010).
Is \(q\) really “imitation”? The Bass model is a reduced form: it reproduces the shape of diffusion without identifying the mechanism. A large estimated \(q\) is consistent with word of mouth, but also with falling prices, expanding distribution, learning by the firm, or heterogeneous adoption thresholds (F. M. Bass, Krishnan, and Jain 1994, Van den Bulte and Stremersch 2004). Estimates from early data are also notoriously unstable, parameters can change substantially as data points beyond the inflection point are added, so forecasts made before the peak should be presented with wide uncertainty bands and cross-checked against analogies.
Illustrative scenario: forecasting a new product launch. A consumer electronics firm is launching a home device in a new category. Before launch, it has no sales history, so it forecasts by analogy: it collects estimated \(p\) and \(q\) values for comparable past categories, adjusts market potential \(m\) using purchase-intention surveys and household penetration of complementary products, and simulates the life cycle. The analysis yields three uses. First, capacity planning: the forecast peak sales rate determines manufacturing and inventory commitments. Second, marketing allocation: if diffusion is imitation-driven (high \(q/p\)), early spending on seeding, referral incentives, and reviews may yield more than heavy launch advertising. Third, re-estimation: once several periods of sales are observed, the model is refit (as in the code above), and the forecast is updated, with explicit uncertainty, because pre-peak estimates are unstable.
Modify the code above to fit the model using only the first five periods of simulated sales. How much do the estimates of \(m\), \(p\), and \(q\) change? What does this imply for forecasting a product’s peak from its launch year alone?
10.3 Theories of Reasoned Action and Planned Behavior
Core claim. Behaviour is determined by the intention to perform it. Intentions are in turn determined by attitudes toward the behaviour, subjective norms, and, in the theory of planned behavior, perceived behavioral control, each of which rests on underlying beliefs.
Origins. Social psychology: the theory of reasoned action (TRA) of Fishbein and Ajzen (1975) and Ajzen and Fishbein (1980). The theory of planned behavior (TPB) of Ajzen (1991).
Level of analysis. Individual.
Key constructs. Behavioural, normative, and control beliefs, attitude toward the behaviour, subjective norm, perceived behavioral control, intention, behaviour.
Boundary conditions. Best suited to deliberate behaviours under volitional control, measured at a matching level of specificity (the principle of compatibility: same action, target, context, and time). Weaker for habitual, impulsive, or highly constrained behaviours.
Related theories. Technology acceptance model, UTAUT, Social norms (Section 22.5), Self-regulation (Chapter 20).
The theory of reasoned action provides the micro-foundation on which most technology-acceptance models are built. Fishbein and Ajzen (1975) proposed that the proximal determinant of a volitional behaviour is the person’s intention to perform it. Intention depends on two factors: the person’s attitude toward the behaviour (a summary evaluation based on beliefs about its consequences, weighted by the evaluation of those consequences) and the subjective norm (the perceived expectations of important others, weighted by the motivation to comply with them). In a meta-analysis, Sheppard, Hartwick, and Warshaw (1988) found that the theory predicted intentions and behaviour well, even in some situations that fell outside its original boundary conditions.
Ajzen (1991) extended the TRA to behaviours that are not fully under volitional control by adding perceived behavioral control (PBC): the perceived ease or difficulty of performing the behaviour, based on control beliefs about the presence of resources and obstacles. PBC influences intention and, to the extent that it reflects actual control, also predicts behaviour directly (Figure 10.5). A meta-analysis by Armitage and Conner (2001) found that the TPB accounted for substantial variance in intentions and somewhat less in behaviour, and that PBC added explanatory power beyond attitudes and subjective norms, while subjective norm was the weakest predictor of intention.
Figure 10.5: The theory of planned behavior (Ajzen, 1991). The theory of reasoned action (Fishbein & Ajzen, 1975) is the same model without perceived behavioral control. The dashed path from control to behaviour reflects the extent to which perceived control approximates actual control.
The intention-behaviour gap. Correlational support for the TPB is strong, but experimental evidence is more sobering. Webb and Sheeran (2006) meta-analysed experiments that changed intentions and found that the resulting change in behaviour was considerably smaller than the change in intention. Sniehotta, Presseau, and Araújo-Soares (2014) went further, arguing that the TPB’s limited predictive validity and its weak record as a guide to behaviour-change interventions warrant retiring it. Defenders reply that the theory was never designed as an intervention manual, and that the gap reflects habits, implementation problems, and measurement mismatches that the theory’s boundary conditions already acknowledge.
10.4 Technology Acceptance Model
Core claim. People’s intention to use an information technology is determined mainly by two beliefs: perceived usefulness (the degree to which they believe the system would improve their job performance) and perceived ease of use (the degree to which they believe using it would be free of effort). Ease of use also increases perceived usefulness.
Origins. Information systems: F. D. Davis (1989) and F. D. Davis, Bagozzi, and Warshaw (1989), adapting the theory of reasoned action. Extended in TAM2 (Venkatesh and Davis 2000) and TAM3 (Venkatesh and Bala 2008).
Level of analysis. Individual users, typically within organizations.
Key constructs. Perceived usefulness (PU), perceived ease of use (PEOU), attitude toward using, behavioural intention, system use, external variables (in TAM2: subjective norm, image, job relevance, output quality, result demonstrability, experience, voluntariness).
Boundary conditions. Developed for workplace productivity technologies, assumes individual choice over use. Explanatory power falls when use is mandated, when adoption is collective, or when hedonic or social motives dominate.
Related theories. Theory of planned behavior, UTAUT, Diffusion of innovations.
10.4.1 Origins and core logic
F. D. Davis (1989) developed and validated scales for two beliefs that he argued were fundamental determinants of user acceptance. Perceived usefulness captured the instrumental benefits of a system. Perceived ease of use captured its effort cost. In his studies, usefulness was more strongly linked to usage than ease of use, and ease of use appeared to operate partly through usefulness: a system that is easier to use leaves more effort available for productive work. F. D. Davis, Bagozzi, and Warshaw (1989) compared TAM with the theory of reasoned action in a longitudinal study of MBA students’ use of a word-processing system. Perceived usefulness strongly influenced intentions at both measurement points. Ease of use had a smaller effect that faded as users gained experience, and TAM, despite its parsimony, predicted intentions at least as well as the TRA.
TAM simplified the TRA in two ways that proved decisive for its popularity. It replaced the elicitation of salient beliefs for each new behaviour with two general beliefs that apply to almost any technology, and it dropped the subjective norm, which Davis and colleagues found to have little effect on intentions in their setting. The result was a short, reliable survey that could be deployed in virtually any IT implementation (Figure 10.6).
Figure 10.6: The technology acceptance model (Davis, 1989, Davis et al., 1989) with the TAM2 extensions of Venkatesh and Davis (2000). Social-influence and cognitive-instrumental processes shape perceived usefulness. Experience and voluntariness moderate the effect of subjective norm.
10.4.2 Evidence and extensions
TAM became one of the most cited models in information systems. Venkatesh and Davis (2000) proposed TAM2, which explained perceived usefulness and intention in terms of social influence processes (subjective norm, image, voluntariness) and cognitive instrumental processes (job relevance, output quality, result demonstrability, and perceived ease of use). In four longitudinal field studies, subjective norm affected intention directly in mandatory settings, and its effects weakened as users gained experience. Venkatesh and Bala (2008) then proposed TAM3, adding determinants of perceived ease of use, such as computer self-efficacy (Section 21.5), perceptions of external control, computer anxiety, and perceived enjoyment, and an agenda for designing interventions before and after implementation.
Meta-analytic evidence supports the model’s core relationships. W. R. King and He (2006) found the TAM measures to be highly reliable and the path from perceived usefulness to intention to be strong across many studies, with ease of use operating largely through usefulness. S. Taylor and Todd (1995) compared TAM with the TPB and a “decomposed” TPB: TAM predicted usage nearly as well as the richer models, though the decomposed TPB offered a more complete understanding of the determinants of intention. Legris, Ingham, and Collerette (2003), reviewing the literature, noted the model’s predictive usefulness but also its reliance on self-reported use and student samples, and argued that it should be integrated into broader models that include organizational and social factors.
Post-adoption research addresses what happens after initial acceptance. Bhattacherjee (2001) proposed an expectation-confirmation model of continuance, in which satisfaction, driven by the confirmation of pre-adoption expectations, and post-adoption perceived usefulness determine whether users keep using a system. Continuance, not initial adoption, is often what determines the return on a technology investment.
Enterprise software rollout and user acceptance. Consider a firm replacing its legacy customer-relationship management system with a cloud platform. Licences and integration are costly, but the investment pays off only if sales staff actually use the system. TAM and TAM2 translate into a practical rollout plan. Perceived usefulness is raised by configuring the system around salespeople’s own goals (pipeline visibility, faster quoting) rather than management’s reporting needs alone, and by demonstrating results (TAM2’s result demonstrability) through pilot teams. Perceived ease of use is raised through training, sensible defaults, and integration with email and calendar. Because use is often mandatory, subjective norm matters early, managers modelling use and reviewing pipelines in the system, but its influence fades with experience, so long-run use must rest on usefulness. Finally, the assimilation-gap warning of Fichman and Kemerer (1999) applies inside the firm: licences deployed are not the same as the system used.
10.5 Unified Theory of Acceptance and Use of Technology
Core claim. Four constructs, performance expectancy, effort expectancy, social influence, and facilitating conditions, are the main determinants of technology intention and use, with their effects moderated by gender, age, experience, and voluntariness of use. UTAUT2 adapts the model to consumers by adding hedonic motivation, price value, and habit.
Origins. Information systems: Venkatesh et al. (2003) integrated eight prior models. Venkatesh, Thong, and Xu (2012) extended the theory to consumer contexts (UTAUT2).
Level of analysis. Individual users in organizations (UTAUT) and consumers (UTAUT2).
Key constructs. Performance expectancy, effort expectancy, social influence, facilitating conditions, behavioural intention, use behaviour, hedonic motivation, price value, habit, moderators.
Boundary conditions. Strongest for individual adoption of discrete technologies. The many moderators make the full model hard to test in small samples, and the constructs are general rather than specific to particular system features.
Related theories. Technology acceptance model, Theory of planned behavior, Diffusion of innovations.
10.5.1 Core logic
By the early 2000s, researchers could choose among many overlapping models of technology acceptance. Venkatesh et al. (2003) reviewed eight of them, the theory of reasoned action, TAM, the motivational model, the theory of planned behavior, a model combining TAM and the TPB, the model of PC utilization, innovation diffusion theory, and social cognitive theory, and compared them empirically in longitudinal studies in organizations. They then formulated a unified model in which:
- Performance expectancy (the belief that using the system will help attain gains in job performance. It subsumes perceived usefulness and relative advantage) affects intention, more strongly for men and younger workers.
- Effort expectancy (the ease associated with use. It subsumes perceived ease of use and complexity) affects intention, more strongly for women, older workers, and in early stages of experience.
- Social influence (the perception that important others believe one should use the system. It subsumes subjective norm and image) affects intention, mainly in mandatory settings and with complex moderation by gender, age, and experience.
- Facilitating conditions (the belief that organizational and technical infrastructure exists to support use. It subsumes perceived behavioral control and compatibility) affect use directly rather than intention, more strongly for older workers with more experience.
In their validation data, the unified model explained more variance in usage intention than any of the eight original models, which helped make UTAUT a standard framework. Figure 10.7 shows its structure.
Figure 10.7: The unified theory of acceptance and use of technology (UTAUT. Venkatesh et al., 2003), with the constructs added in UTAUT2 for consumer contexts (Venkatesh et al., 2012) shown in orange. Moderators: gender, age, experience, and (in UTAUT) voluntariness of use.
10.5.2 UTAUT2: from employees to consumers
Venkatesh, Thong, and Xu (2012) adapted UTAUT for consumer technology use, studying mobile Internet use. Three constructs were added. Hedonic motivation (the fun or pleasure derived from using a technology) reflects the fact that consumers often use technology for enjoyment, not job performance. Price value (the consumer’s trade-off between perceived benefits and monetary cost) matters because consumers, unlike employees, usually pay for the technology themselves. Habit (the extent to which people perform behaviours automatically because of learning) affects both intention and use directly, capturing the fact that much technology use becomes routine. Voluntariness was dropped as a moderator because consumer use is voluntary, and facilitating conditions were allowed to affect intention as well as use. Table 10.5 traces how the constructs evolved across the model family.
| Construct | TAM | TAM2 | UTAUT | UTAUT2 | Root constructs in earlier models |
|---|---|---|---|---|---|
| Usefulness / performance expectancy | Perceived usefulness | Perceived usefulness | Performance expectancy | Performance expectancy | Relative advantage (IDT), outcome expectations (SCT) |
| Ease / effort expectancy | Perceived ease of use | Perceived ease of use | Effort expectancy | Effort expectancy | Complexity (IDT) |
| Social influence |
|
Subjective norm, image | Social influence | Social influence | Subjective norm (TRA, TPB) |
| Facilitating conditions |
|
|
Facilitating conditions | Facilitating conditions | Perceived behavioral control (TPB), compatibility (IDT) |
| Hedonic motivation |
|
|
|
Hedonic motivation | Intrinsic motivation (motivational model) |
| Price value |
|
|
|
Price value | Consumer value trade-offs |
| Habit |
|
|
|
Habit | Habit and automaticity research |
| Key moderators |
|
Experience, voluntariness | Gender, age, experience, voluntariness | Gender, age, experience |
|
10.5.3 Critiques and the future of acceptance research
A paradigm in need of a shift? In a special issue of the Journal of the Association for Information Systems devoted to TAM, Bagozzi (2007) argued that the model’s parsimony had become its weakness. He identified several shortcomings: the neglect of the gap between intention and actual behaviour. The treatment of adoption as a terminal goal rather than a means to users’ broader goals. The absence of group, social, and cultural aspects of decision making, and the proliferation of ad hoc extensions that fragmented the field. He proposed grounding acceptance research in a richer theory of goal-directed decision making and self-regulation. In the same issue, Benbasat and Barki (2007) argued that TAM’s popularity had diverted research away from the IT artifact itself: because perceived usefulness and ease of use are treated as black boxes, the research offers little guidance on which design features make a system useful or easy, and the stream of incremental extensions had produced diminishing returns. They called for research on the antecedents of usefulness in system design and on a wider range of post-adoption behaviours such as adaptation and learning.
UTAUT has drawn related criticisms: its many moderators make the full model difficult to replicate, and its general constructs can be applied to any technology without engaging with what is distinctive about it. Taken together, the critiques do not deny that usefulness and ease of use matter. They question whether further variations on the same constructs advance understanding.
Generative-AI tool adoption in firms (conceptual analysis). When a firm makes a generative-AI writing or coding assistant available to employees, the acceptance models suggest where adoption will succeed or stall. Performance expectancy depends on task fit: employees whose work involves drafting, summarizing, or routine code see clearer gains than those whose work is mostly relational. Field evidence from customer-support work found that access to a generative-AI assistant raised productivity on average, with the largest gains for less experienced workers (Brynjolfsson, Li, and Raymond 2025): suggesting that perceived usefulness may be highest, and acceptance fastest, among newer employees. Effort expectancy includes learning to write effective prompts and to verify outputs. Social influence operates through managers and peers who model use, or who signal, implicitly, that using the tool is a form of shortcut. Facilitating conditions include data-governance rules, integration with existing software, and clarity about what information may be shared with the tool. The critiques of TAM apply with force: concerns about accuracy, accountability, and job security fall outside the core constructs, and the most important question is often not whether employees use the tool but how, the post-adoption behaviours that Benbasat and Barki (2007) urged researchers to study. Diffusion theory adds that observability matters: firms that make successful uses visible (shared prompt libraries, internal case studies) are applying Rogers’s attribute directly.
10.5.4 Using the acceptance models in research
Sample hypotheses.
- H1. Performance expectancy will have a stronger effect on intention to use a generative-AI assistant for employees in roles with a high share of writing tasks than for employees in roles with a low share.
- H2. The effect of social influence on intention will be stronger when use is mandated, and will weaken with experience.
- H3. Habit will predict continued use of a consumer app over and above intention after six months of use.
Designs. Longitudinal surveys at pre-implementation, early use, and established use. Linkage of survey constructs to logged system use rather than self-reports. Field experiments that vary training, defaults, or social information. Multilevel models for employees nested in teams.
Measures. Validated scales for TAM, UTAUT, and UTAUT2 constructs (F. D. Davis 1989, Venkatesh et al. 2003, Venkatesh, Thong, and Xu 2012), perceived innovation characteristics (G. C. Moore and Benbasat 1991), objective usage logs, continuance (Bhattacherjee 2001).
Predicting intention and calling it adoption. Many studies measure the predictors and the intention in the same survey and stop there. Common-method variance inflates the relationships, and intentions translate imperfectly into use (Webb and Sheeran 2006). Measure actual use, preferably from system logs and at a later time, and test whether the model explains behaviour, not just stated plans.
10.6 Information Systems Success Model
Core claim. The success of an information system is multidimensional. System quality, information quality, and service quality shape use and user satisfaction, which in turn produce net benefits for individuals, groups, and organizations. Net benefits feed back into further use and satisfaction.
Origins. Information systems. DeLone and McLean (1992) synthesized the fragmented measures of IS success into six interrelated categories. DeLone and McLean (2003) updated the model in response to a decade of tests and critiques, notably Seddon (1997). Petter, DeLone, and McLean (2008) reviewed the evidence.
Level of analysis. Individual users, workgroups, and organizations.
Key constructs. System quality, information quality, service quality, intention to use and use, user satisfaction, net benefits (in the 1992 model, individual impact and organizational impact).
Boundary conditions. Use is an informative success measure only when it is at least partly voluntary. When use is mandated, satisfaction, the quality of use, and net benefits carry more information. The relative weight of each quality dimension depends on the system: service quality matters most when users depend on an IT function or provider for support.
Related theories. Technology acceptance model, UTAUT, Task-technology fit, Service quality gap model (Section 28.3), Expectancy disconfirmation (Section 27.1).
10.6.1 Origins and core logic
The acceptance models in this chapter explain whether people use a technology. Managers who fund systems also need to know whether the systems work: whether they deliver accurate information, satisfy users, and improve performance. By the late 1980s, IS researchers had measured “success” in dozens of incompatible ways, from system response time to user satisfaction to return on investment. DeLone and McLean (1992) called this the search for the dependent variable of IS research. Drawing on communication theory’s distinction between the technical level (is the message transmitted accurately?), the semantic level (does it convey the intended meaning?), and the effectiveness level (does it influence the receiver?), they reviewed the empirical literature and organized its measures into six categories: system quality, information quality, use, user satisfaction, individual impact, and organizational impact. Their central argument was that these categories are interdependent and that studies should measure several of them rather than choosing one.
The original model was criticized for mixing two kinds of model. Seddon (1997) argued that it combined a process model (a system is built, then used, then has impacts) with a causal or variance model (more quality causes more use and more benefits), and that “use” was ambiguous: more use can reflect a valuable system or an inefficient one that consumes users’ time. DeLone and McLean (2003) responded with an updated model that made three changes. They added service quality to capture the support users receive from the IS function or provider. They distinguished intention to use (an attitude) from use (a behaviour). And they combined individual and organizational impacts into a single net benefits construct whose referent (individual, group, firm, society) should be chosen to fit the research question. Figure 10.8 shows the updated model.
Figure 10.8: The updated DeLone and McLean model of information systems success (DeLone and McLean, 2003). Three quality dimensions shape intention to use, use, and user satisfaction, which jointly produce net benefits. Dashed arrows show the feedback of net benefits to subsequent use and satisfaction.
Table 10.6 lists the dimensions with typical measures. Because each dimension can be measured objectively (from logs and audits) or perceptually (from user surveys), the model also serves as a checklist for system evaluation.
| Dimension | What it captures | Example measures |
|---|---|---|
| System quality | Desirable technical characteristics of the system | Reliability, response time, availability, ease of use, flexibility |
| Information quality | Desirable characteristics of the system’s outputs | Accuracy, completeness, timeliness, relevance, format |
| Service quality | Quality of support from the IS function or provider | Responsiveness, assurance, empathy of support staff, resolution time |
| Intention to use / use | Extent and nature of system utilization | Frequency, duration, breadth of features used, logged transactions |
| User satisfaction | Users’ overall evaluation of the system | Multi-item satisfaction scales, net promoter style ratings, complaints |
| Net benefits | Contribution to individuals, groups, organizations | Decision quality, productivity, cost savings, revenue, customer outcomes |
10.6.2 Evidence and extensions
Petter, DeLone, and McLean (2008) reviewed tests of each relationship in the model. Support was strongest for links involving user satisfaction, for example from system quality and information quality to satisfaction and from satisfaction to net benefits at the individual level. Evidence was weaker and more mixed for links involving system use, for service quality, and for net benefits at the organizational level, where many other factors intervene between a system and firm performance. The model is widely used as an evaluation framework for enterprise systems, e-commerce sites, e-government services, and knowledge management systems.
The launch of HealthCare.gov. When the US federal health-insurance marketplace opened on 1 October 2013, many visitors were unable to create accounts or complete applications because the site suffered from outages, slow responses, and errors. In the language of the model, deficiencies in system quality blocked use and destroyed user satisfaction, so that the intended net benefits (enrolment in coverage) could not materialize regardless of the quality of the plan information on the site. The recovery effort that followed concentrated on reliability and capacity, the system quality dimension, before the site could deliver its intended benefits. The episode illustrates why the model insists on measuring several dimensions: a system can be well specified at the information level and still fail at the technical level.
Sample hypotheses. H1. Service quality will have a stronger effect on user satisfaction for cloud software purchased by small firms (which lack internal IT support) than for large firms. H2. The effect of use on net benefits will be weaker when use is mandated. H3. Information quality will mediate the effect of a data-integration project on managers’ decision quality.
Designs. Multi-wave surveys linked to usage logs and performance data, comparisons of business units before and after system implementation, structural equation models that test the full set of paths.
Measures. Validated scales for each quality dimension and satisfaction (Petter, DeLone, and McLean 2008), logged use, objective performance outcomes.
Measuring one dimension and calling it success. Many evaluations report only satisfaction or only usage. The model’s main lesson is that the dimensions are distinct and can diverge: a heavily used system may be unsatisfying, and a satisfying system may produce no net benefit. Measure several dimensions and state which level of net benefits is the target.
10.7 Task-Technology Fit
Core claim. A technology improves individual performance when its capabilities fit the tasks its users must perform. Use alone is not enough: use of a poorly fitting technology adds little or nothing to performance.
Origins. Information systems. Goodhue and Thompson (1995) proposed the technology-to-performance chain. Goodhue (1995) examined user evaluations of fit. Extensions to group support systems (Zigurs and Buckland 1998) and integration with TAM (Dishaw and Strong 1999).
Level of analysis. Individual user and task. Extended to groups.
Key constructs. Task characteristics, technology characteristics, individual characteristics, task-technology fit, utilization, performance impacts.
Boundary conditions. Fit matters most when tasks are well defined and technology is a significant input to performance. Fit is judged relative to a specific task, so the same system may fit one task and not another.
Related theories. Technology acceptance model, UTAUT, IS success model, Contingency theory (Section 7.6).
10.7.1 Core logic
Goodhue and Thompson (1995) observed that acceptance models focus on utilization and that IS success models assume that more use produces more benefit. They argued that both overlook the match between technology and task. A spreadsheet is an excellent tool for financial modelling and a poor tool for managing a customer database. Their technology-to-performance chain combines two links. First, the fit between the requirements of a task and the functionality of a technology, shaped by the characteristics of tasks, technologies, and individuals, determines how much a technology can contribute to performance. Second, utilization depends on beliefs about the consequences of use, social norms, habit, and facilitating conditions, and these beliefs are themselves informed by fit. Performance impacts follow from fit and utilization together. The core propositions are:
- P1. Task-technology fit is a function of task characteristics, technology characteristics, and individual characteristics.
- P2. Task-technology fit influences beliefs about the consequences of use and therefore utilization.
- P3. Performance impacts depend on both utilization and task-technology fit. Utilization of a technology with low fit produces little benefit.
Figure 10.9 shows the chain.
Figure 10.9: The technology-to-performance chain (after Goodhue and Thompson, 1995). Task-technology fit arises from task, technology, and individual characteristics. It shapes utilization through beliefs about the consequences of use, and it affects performance both directly and through utilization.
To measure fit, Goodhue and Thompson (1995) surveyed users across many departments and technologies and identified eight dimensions of user-evaluated fit, listed in Table 10.7.
| Dimension | What users evaluate |
|---|---|
| Quality | Currency, right level of detail, and accuracy of data for the task |
| Locatability | Ease of finding data and understanding what it means |
| Authorization | Having access to the data needed for the job |
| Compatibility | Consistency of data from different sources |
| Ease of use and training | Ease of using the system and adequacy of training |
| Production timeliness | Whether scheduled operations and reports arrive on time |
| Systems reliability | Dependability and availability of the system |
| Relationship with users | Understanding, interest, and responsiveness of IS staff |
10.7.2 Evidence and extensions
In their survey, Goodhue and Thompson (1995) found that task-technology fit, together with utilization, predicted users’ perceptions of the performance impacts of their systems, while support for the link from fit to utilization was weaker. The result supported their argument that fit is central to performance even when it does not strongly drive use. Dishaw and Strong (1999) combined TAM and TTF constructs in a study of software maintenance tools and found that the integrated model explained use better than either model alone. Zigurs and Buckland (1998) extended the logic to group support systems by classifying group tasks by complexity and specifying which combinations of communication support, process structuring, and information processing would fit each task type. Figure 10.10 illustrates the central implication: utilization pays off only when fit is high.
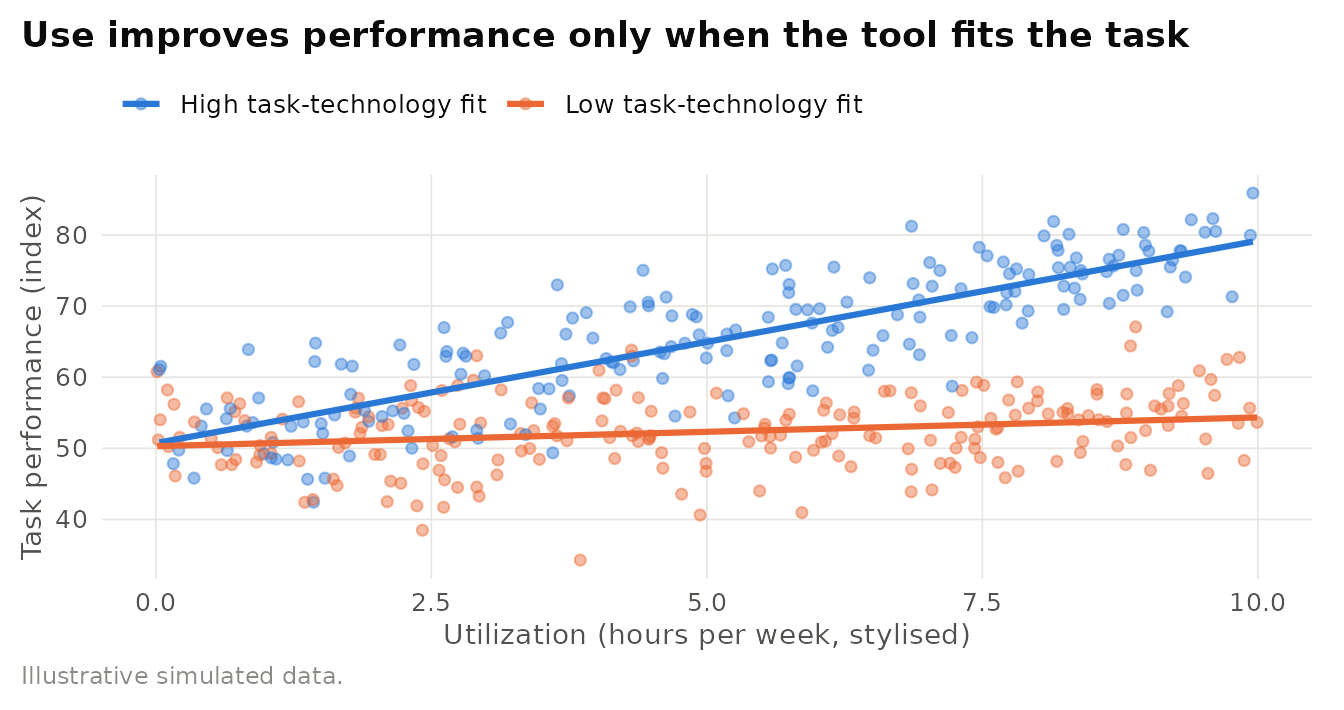
Figure 10.10: Illustrative simulation of proposition P3. For workers whose tasks fit the technology well, more utilization raises performance. For workers with low fit, more utilization adds little. Simulated data (n = 400), not results from a published study.
Illustrative scenario: deploying a generative-AI assistant. A professional services firm gives all consultants access to a generative-AI writing assistant and tracks adoption. Usage is high, but measured productivity gains are uneven. A task-technology fit analysis explains why. For drafting summaries and first versions of standard documents, task requirements (fluent text, quick turnaround) fit the tool’s capabilities. For tasks that require verified client data or precise calculations, fit is low on the quality and authorization dimensions, and heavy use may even reduce performance if outputs are not checked. The managerial implication is to map tasks before mandating tools: encourage use where fit is high, redesign or restrict use where it is low, and invest in integrations (for example, secure access to internal data) that raise fit on the weakest dimensions.
Sample hypotheses. H1. The effect of CRM utilization on salesperson performance will be stronger for salespeople whose tasks involve managing many accounts than for those managing a few strategic accounts. H2. Perceived task-technology fit will predict perceived usefulness, which will mediate its effect on intention to use. H3. Task-technology fit will moderate the effect of mandated use on performance.
Designs. Surveys of users across multiple tasks and technologies, multilevel models with tasks nested in individuals, field experiments that vary tool functionality for different task types, log data linked to output quality.
Measures. Goodhue and Thompson’s fit dimensions adapted to the context, task characteristics (non-routineness, interdependence), utilization from logs, objective and perceived performance.
10.8 Chapter Summary
- Diffusion is the communication of an innovation through channels over time among members of a social system. Cumulative adoption typically follows an S-curve (Rogers 2003).
- Perceived attributes, relative advantage, compatibility, complexity, trialability, and observability, shape the rate of adoption (Rogers 2003, Tornatzky and Klein 1982).
- Classic studies of hybrid corn and medical innovation established both the economic and the social drivers of diffusion, but apparent contagion can reflect common exposure or homophily (Griliches 1957, Van den Bulte and Lilien 2001, Aral, Muchnik, and Sundararajan 2009).
- Moore’s chasm and the empirical saddle describe discontinuities between early and mainstream markets (G. A. Moore 1991, Goldenberg, Libai, and Muller 2002).
- The Bass model decomposes adoption into innovation (\(p\)) and imitation (\(q\)) and is a practical tool for forecasting from early sales or by analogy (F. M. Bass 1969, Mahajan, Muller, and Bass 1990).
- The TRA and TPB explain behaviour through intentions formed from attitudes, norms, and perceived control, but intentions translate imperfectly into behaviour (Ajzen 1991, Webb and Sheeran 2006).
- TAM, TAM2, UTAUT, and UTAUT2 identify usefulness, ease of use, social influence, facilitating conditions, hedonic motivation, price value, and habit as determinants of technology acceptance (F. D. Davis 1989, Venkatesh et al. 2003, Venkatesh, Thong, and Xu 2012).
- Critics argue that acceptance research should open the black box of the IT artifact and study post-adoption behaviour (Bagozzi 2007, Benbasat and Barki 2007).
Table 10.8 presents the comparison of the chapter’s theories.
| Theory | Level | Key mechanism | Signature prediction | Typical business use |
|---|---|---|---|---|
| Diffusion of innovations | Social system | Perceived attributes, interpersonal communication | S-shaped cumulative adoption, early adopters influence the majority | Launch strategy, segmentation, policy design |
| Bass model | Market | Innovation (p) and imitation (q) | Bell-shaped new adoptions, peak at ln(q/p)/(p+q) | Sales and capacity forecasting |
| TRA / TPB | Individual | Attitudes, norms, perceived control -> intention | Intention predicts volitional behaviour | Behaviour-change campaigns, consumer research |
| TAM / TAM2 | Individual | Perceived usefulness and ease of use | Usefulness dominates intention, ease works partly through usefulness | Enterprise system rollout, user-centred design |
| UTAUT / UTAUT2 | Individual | Four core determinants plus hedonic, price, habit | Moderated effects by age, gender, experience | Workplace and consumer technology adoption |
| IS success model | Individual / organization | System, information, service quality -> use and satisfaction -> net benefits | Quality drives satisfaction and net benefits, with feedback to use | Evaluating enterprise systems and digital services |
| Task-technology fit | Individual / task | Fit between task requirements and technology functionality | Use improves performance only when fit is high | Tool selection, system design, AI deployment |
10.9 Discussion Questions
- Ryan and Gross emphasized social communication, Griliches emphasized profitability. Design a study that could estimate the relative contribution of each to the diffusion of a modern agricultural or business technology.
- For a product you know well, rate each of Rogers’s five attributes. Which attribute would you change first to accelerate adoption, and how?
- Using the code in this chapter, explain why Bass-model forecasts made before the sales peak are unstable. What practical safeguards would you recommend to a product manager?
- Van den Bulte and Lilien (2001) showed that marketing effort could explain apparent contagion. What data would you need to separate contagion, homophily, and common exposure in the adoption of a new software tool within a firm?
- Bagozzi and Benbasat & Barki criticize TAM’s focus on two general beliefs. Propose a research design that examines how a specific design feature of a generative-AI tool affects perceived usefulness and actual use.
- Is Moore’s chasm a distinct phenomenon or a consequence of heterogeneity
that the Bass model already captures? Defend your answer with reference to
10.10 Further Reading
- Rogers (2003): the definitive synthesis of diffusion research. The starting point for any study of adoption.
- Griliches (1957): a classic economic analysis of hybrid corn that shows how profitability shapes the diffusion curve.
- Van den Bulte and Lilien (2001): a model reanalysis that every student of social contagion should read.
- F. M. Bass (1969): the original Bass model, brief and still widely used.
- Peres, Muller, and Mahajan (2010): a modern review of diffusion models, including network effects and cross-country diffusion.
- Ajzen (1991): the theory of planned behavior in the author’s own words.
- Venkatesh et al. (2003): the unified theory, with a careful comparison of the eight models it integrates.
- Benbasat and Barki (2007): a short, influential critique of the TAM research programme.