Event studies constitute one of the most enduring and widely deployed empirical methodologies in financial economics. At their core, event studies measure the impact of a specific event on the value of a firm by examining abnormal security returns around the time the event occurs. The methodology rests on a simple premise: if capital markets are informationally efficient, the effect of an event will be reflected immediately in security prices, and any deviation from “normal” expected returns can be attributed to the event itself.
Since the pioneering work of Eugene F. Fama et al. (1969), who studied how stock prices adjust to new information around stock splits, event studies have become a cornerstone of empirical research across finance, accounting, economics, and law. Ball and Brown (2013) demonstrated that accounting earnings announcements convey information to the market, a finding that launched decades of research in accounting and disclosure. The methodology has since been refined through contributions by Brown and Warner (1980) and Brown and Warner (1985), who established the statistical properties of event study methods, and MacKinlay (1997) codified best practices that remain standard today.
The enduring popularity of event studies stems from several compelling properties:
Direct measurement of economic significance. Unlike regression-based approaches that estimate associations, event studies directly quantify the dollar impact of events on firm value. A cumulative abnormal return (CAR) of 3% for a firm with $10 billion market capitalization translates to $300 million in wealth creation, which is a tangible, economically meaningful magnitude.
Minimal maintained assumptions. The methodology requires only semi-strong market efficiency (i.e., prices reflect publicly available information), a weaker assumption than many alternatives.
Statistical power. Daily event studies have remarkable power to detect abnormal performance, even with modest sample sizes. Brown and Warner (1985) demonstrated that the market model detects abnormal returns of 1% or more with high reliability using samples as small as 20 securities.
Versatility. The basic framework accommodates events that are firm-specific or market-wide, anticipated or surprising, and can be adapted to various asset classes and market structures.
41.1 Literature Review and Methodological Evolution
41.1.1 The Classical Framework (1969-1985)
The modern event study traces its origins to Eugene F. Fama et al. (1969), hereafter FFJR, who examined monthly stock returns around 940 stock splits between 1927 and 1959. Their key innovation was the use of the market model to decompose returns into expected (normal) and unexpected (abnormal) components.
Ball and Brown (2013) independently developed a similar approach to study earnings announcements, establishing the information content of accounting data. It was a finding with profound implications for both the efficient markets hypothesis and the relevance of financial reporting.
Brown and Warner (1980) provided the first systematic analysis of event study methodology using simulation. Their study of monthly data established several important results: (i) the simple market model performs at least as well as more complex models, (ii) value-weighted market indices can lead to misspecification when the sample is tilted toward smaller firms, and (iii) the standard cross-sectional test has well-specified size under the null hypothesis. Their follow-up study (Brown and Warner 1985) extended the analysis to daily data, documenting the importance of non-normality in daily returns and the increased power of daily versus monthly studies.
41.1.2 Risk Model Refinements (1992-2015)
The advent of the Fama-French three-factor model(Eugene F. Fama and French 1993) represented a major advance in modeling expected returns. Adding size (SMB) and value (HML) factors to the market model improved the cross-sectional fit of expected returns considerably. Carhart (1997) augmented this with a momentum factor (UMD), yielding the four-factor model that became standard in event studies through the 2000s. Eugene F. Fama and French (2015) subsequently introduced profitability (RMW) and investment (CMA) factors in their five-factor model.
The choice of risk model matters for event studies primarily in long-horizon settings. Kothari and Warner (2007) showed that for short-window studies (3-5 days), the market model and multi-factor models produce virtually identical results because the incremental factors explain very little daily return variation for individual firms. However, for event windows exceeding 20 trading days, model choice can materially affect inferences.
41.1.3 Testing for Abnormal Returns (1976-2010)
The statistical testing of abnormal returns has evolved considerably:
Table 41.1: Summary of major event study test statistics
Test
Year
Key Property
Reference
Patell Z
1976
Standardizes by estimation-period \(\sigma\); weights firms inversely by volatility
Cumulative abnormal returns (CARs) sum daily abnormal returns, while buy-and-hold abnormal returns (BHARs) compound returns and subtract the compounded benchmark. Barber and Lyon (1997) demonstrated that BHARs better capture the actual investor experience, since investors earn compound, not cumulative, returns. However, Eugene F. Fama (1998) and Mitchell and Stafford (2000) showed that BHARs exhibit severe cross-sectional dependence and positive skewness. For short event windows (under 10 days), the difference between CARs and BHARs is negligible. For longer windows, both should be reported.
41.1.5 Emerging Market Considerations
Event studies in emerging markets face distinct challenges:
Thin trading. Many emerging market securities trade infrequently, inducing bias in market model beta estimates. Scholes and Williams (1977) and Dimson (1979) proposed corrections using leading and lagging market returns.
Factor availability. While Fama-French factors are readily available for developed markets, emerging market factors must often be constructed locally.
Market microstructure. Price limits (\(\pm\) 7% on HOSE, \(\pm\) 10% on HNX, \(\pm\) 15% on UPCOM in Vietnam), T+2 settlement, and the absence of short-selling affect the speed of price adjustment. Researchers should consider wider event windows to accommodate slower information incorporation (Bhattacharya et al. 2000; Griffin, Kelly, and Nardari 2010).
41.2 Mathematical Framework
This section presents the complete mathematical specification of the event study methodology. We follow the notation conventions of Campbell et al. (1998) and Kothari and Warner (2007).
41.2.1 Timeline and Windows
The event study timeline is defined relative to the event date, denoted \(\tau = 0\). All dates are measured in trading days:
Estimation window: \(L_1\) trading days over which the risk model parameters are estimated
Gap: \(G\) trading days separating estimation and event windows, preventing contamination by pre-event information leakage
Event window: \(L_2 = \tau_2 - \tau_1 + 1\) trading days centered around the event date
For example, with \(L_1 = 150\), \(G = 15\), \(\tau_1 = -10\), \(\tau_2 = +10\): the estimation window covers trading days \([-175, -25]\) relative to the event, and the event window covers \([-10, +10]\).
41.2.2 Normal Return Models
Let \(R_{it}\) denote the return on security \(i\) on trading day \(t\), \(R_{ft}\) the risk-free rate, and \(R_{mt}\) the market return. We implement six models:
Model 0: Market-Adjusted Returns. Assumes \(\beta_i = 1\) and \(\alpha_i = 0\) for all firms:
class RiskModel(Enum):"""Supported risk models for expected return computation.""" MARKET_ADJ ="market_adjusted" MARKET_MODEL ="market_model" FF3 ="ff3" CARHART ="carhart" FF5 ="ff5" CUSTOM ="custom"@dataclassclass EventStudyConfig:"""Complete configuration for an event study. Attributes ---------- estimation_window : int Length of estimation period in trading days. Brown and Warner (1985) suggest ≥100 days; MacKinlay (1997) recommends 120 as standard. event_window_start : int Start of event window relative to event date (e.g., -10). event_window_end : int End of event window relative to event date (e.g., +10). gap : int Trading days between estimation and event windows. Prevents contamination from pre-event information leakage. min_estimation_obs : int Minimum non-missing returns required in estimation period. risk_model : RiskModel Risk model for computing expected returns. custom_factors : list Column names for user-specified factors (CUSTOM model only). thin_trading_adj : str or None None, 'scholes_williams', or 'dimson'. dimson_lags : int Number of leads/lags for Dimson (1979) correction. """ estimation_window: int=150 event_window_start: int=-10 event_window_end: int=10 gap: int=15 min_estimation_obs: int=120 risk_model: RiskModel = RiskModel.MARKET_MODEL custom_factors: List[str] = field(default_factory=list) thin_trading_adj: Optional[str] =None dimson_lags: int=1@propertydef event_window_length(self) ->int:returnself.event_window_end -self.event_window_start +1def validate(self):assertself.estimation_window >0assertself.event_window_start <=self.event_window_endassertself.gap >=0assertself.min_estimation_obs <=self.estimation_windowifself.risk_model == RiskModel.CUSTOM:assertlen(self.custom_factors) >0returnTrue# Demonstrateconfig_demo = EventStudyConfig( estimation_window=150, event_window_start=-10, event_window_end=10, gap=15, min_estimation_obs=120, risk_model=RiskModel.FF3)config_demo.validate()print(f"Event window length: {config_demo.event_window_length} days")print(f"Model: {config_demo.risk_model.value}")
Event window length: 21 days
Model: ff3
41.3.4 Step 1: Trading Calendar Construction
A correct trading calendar is fundamental. It maps any event date to the exact calendar dates for the start/end of estimation and event windows, accounting for weekends, holidays, and non-trading days.
Build trading calendar
def build_trading_calendar(trading_dates, config):"""Build a trading calendar mapping event dates to window boundaries. For each potential event date, identifies the calendar dates for the start/end of the estimation period and event window using only actual trading days. Parameters ---------- trading_dates : array-like Sorted unique trading dates in the market. config : EventStudyConfig Returns ------- pd.DataFrame with columns: estper_beg, estper_end, evtwin_beg, evtdate, evtwin_end, cal_index """ dates = pd.Series(sorted(pd.to_datetime(trading_dates).unique())) n =len(dates) L1 = config.estimation_window G = config.gap s = config.event_window_start L2 = config.event_window_length# Offsets (FIRSTOBS logic) o0 =0# estper_beg o1 = L1 -1# estper_end o2 = L1 + G # evtwin_beg o3 = L1 + G - s # evtdate o4 = L1 + G + L2 -1# evtwin_end max_offset = o4 valid = n - max_offsetif valid <=0:raiseValueError(f"Need ≥{max_offset+1} trading dates, have {n}") cal = pd.DataFrame({'estper_beg': dates.iloc[o0:o0+valid].values,'estper_end': dates.iloc[o1:o1+valid].values,'evtwin_beg': dates.iloc[o2:o2+valid].values,'evtdate': dates.iloc[o3:o3+valid].values,'evtwin_end': dates.iloc[o4:o4+valid].values, }) cal['cal_index'] =range(1, len(cal)+1)# Validate window lengths using a sample row idx =min(10, len(cal)-1) row = cal.iloc[idx] est_n = dates[(dates >= row['estper_beg']) & (dates <= row['estper_end'])].shape[0] evt_n = dates[(dates >= row['evtwin_beg']) & (dates <= row['evtwin_end'])].shape[0]assert est_n == L1, f"Estimation window: {est_n} ≠ {L1}"assert evt_n == L2, f"Event window: {evt_n} ≠ {L2}"return cal# Demodemo_dates = pd.bdate_range('2018-01-01', '2023-12-31', freq='B')demo_cal = build_trading_calendar(demo_dates, config_demo)print(f"Calendar: {len(demo_cal)} potential event dates")print(demo_cal.head(3).to_string(index=False))
def run_event_study(events, prices, factors, config, id_col='symbol', date_col='date', ret_col='ret', event_date_col='event_date', mkt_col='mkt_excess', rf_col='risk_free', group_col=None, verbose=True):"""Run a complete event study from raw inputs to test statistics. This is the main entry point. Provide your events, price data, factor data, and configuration—get back everything you need. Parameters ---------- events : pd.DataFrame Columns: [id_col, event_date_col], optional 'group'. prices : pd.DataFrame Daily returns: [id_col, date_col, ret_col or 'ret_excess', rf_col]. factors : pd.DataFrame Factor returns: [date_col, mkt_col, 'smb', 'hml', ...]. config : EventStudyConfig Returns ------- dict with keys: 'config', 'daily_ar', 'event_ar', 'daily_stats', 'test_stats', 'params' """ config.validate()if verbose:print(f"═══ Event Study: {config.risk_model.value} model ═══")print(f" Windows: estimation={config.estimation_window}, "f"gap={config.gap}, event=({config.event_window_start},{config.event_window_end})")print(f" Min obs: {config.min_estimation_obs}\n")# 1. Trading calendarif verbose: print("Step 1: Building trading calendar...") trading_dates = pd.Series(sorted(prices[date_col].unique())) calendar = build_trading_calendar(trading_dates, config)if verbose: print(f" {len(calendar)} potential event dates\n")# 2. Align eventsif verbose: print("Step 2: Aligning events to trading calendar...") aligned = align_events(events, calendar, id_col, event_date_col)if verbose: print(f" {len(aligned)} aligned events\n")# 3. Extract returnsif verbose: print("Step 3: Extracting returns and merging factors...") evt_rets = extract_returns(aligned, prices, factors, config, id_col, date_col, ret_col, mkt_col, rf_col)if verbose: print()# 4. Estimate modelif verbose: print("Step 4: Estimating risk model parameters...") params = estimate_model(evt_rets, config, id_col, date_col, ret_col)if verbose: print()# 5. Compute abnormal returnsif verbose: print("Step 5: Computing abnormal returns...") daily_ar, event_ar = compute_abnormal_returns( evt_rets, params, config, id_col, date_col, ret_col)if verbose: print()# 6. Test statisticsif verbose: print("Step 6: Computing test statistics...") test_stats = compute_test_statistics(event_ar, params, group_col) daily_stats = compute_daily_stats(daily_ar, id_col)if verbose:print(f" Done.\n")print("═══ Results Summary ═══") cols = ['group', 'N', 'mean_CAR', 'mean_BHAR', 'pct_positive','t_CS', 'p_CS', 't_BMP', 'p_BMP', 't_KP', 'p_KP'] avail = [c for c in cols if c in test_stats.columns]print(test_stats[avail].to_string(index=False))return {'config': config,'params': params,'daily_ar': daily_ar,'event_ar': event_ar,'daily_stats': daily_stats,'test_stats': test_stats,'calendar': calendar, }print("Master pipeline ready.")
Master pipeline ready.
41.4 Demonstration with Simulated Data
Since we are building a general-purpose framework (the actual event data will be supplied later), we demonstrate the full pipeline with realistic simulated data.
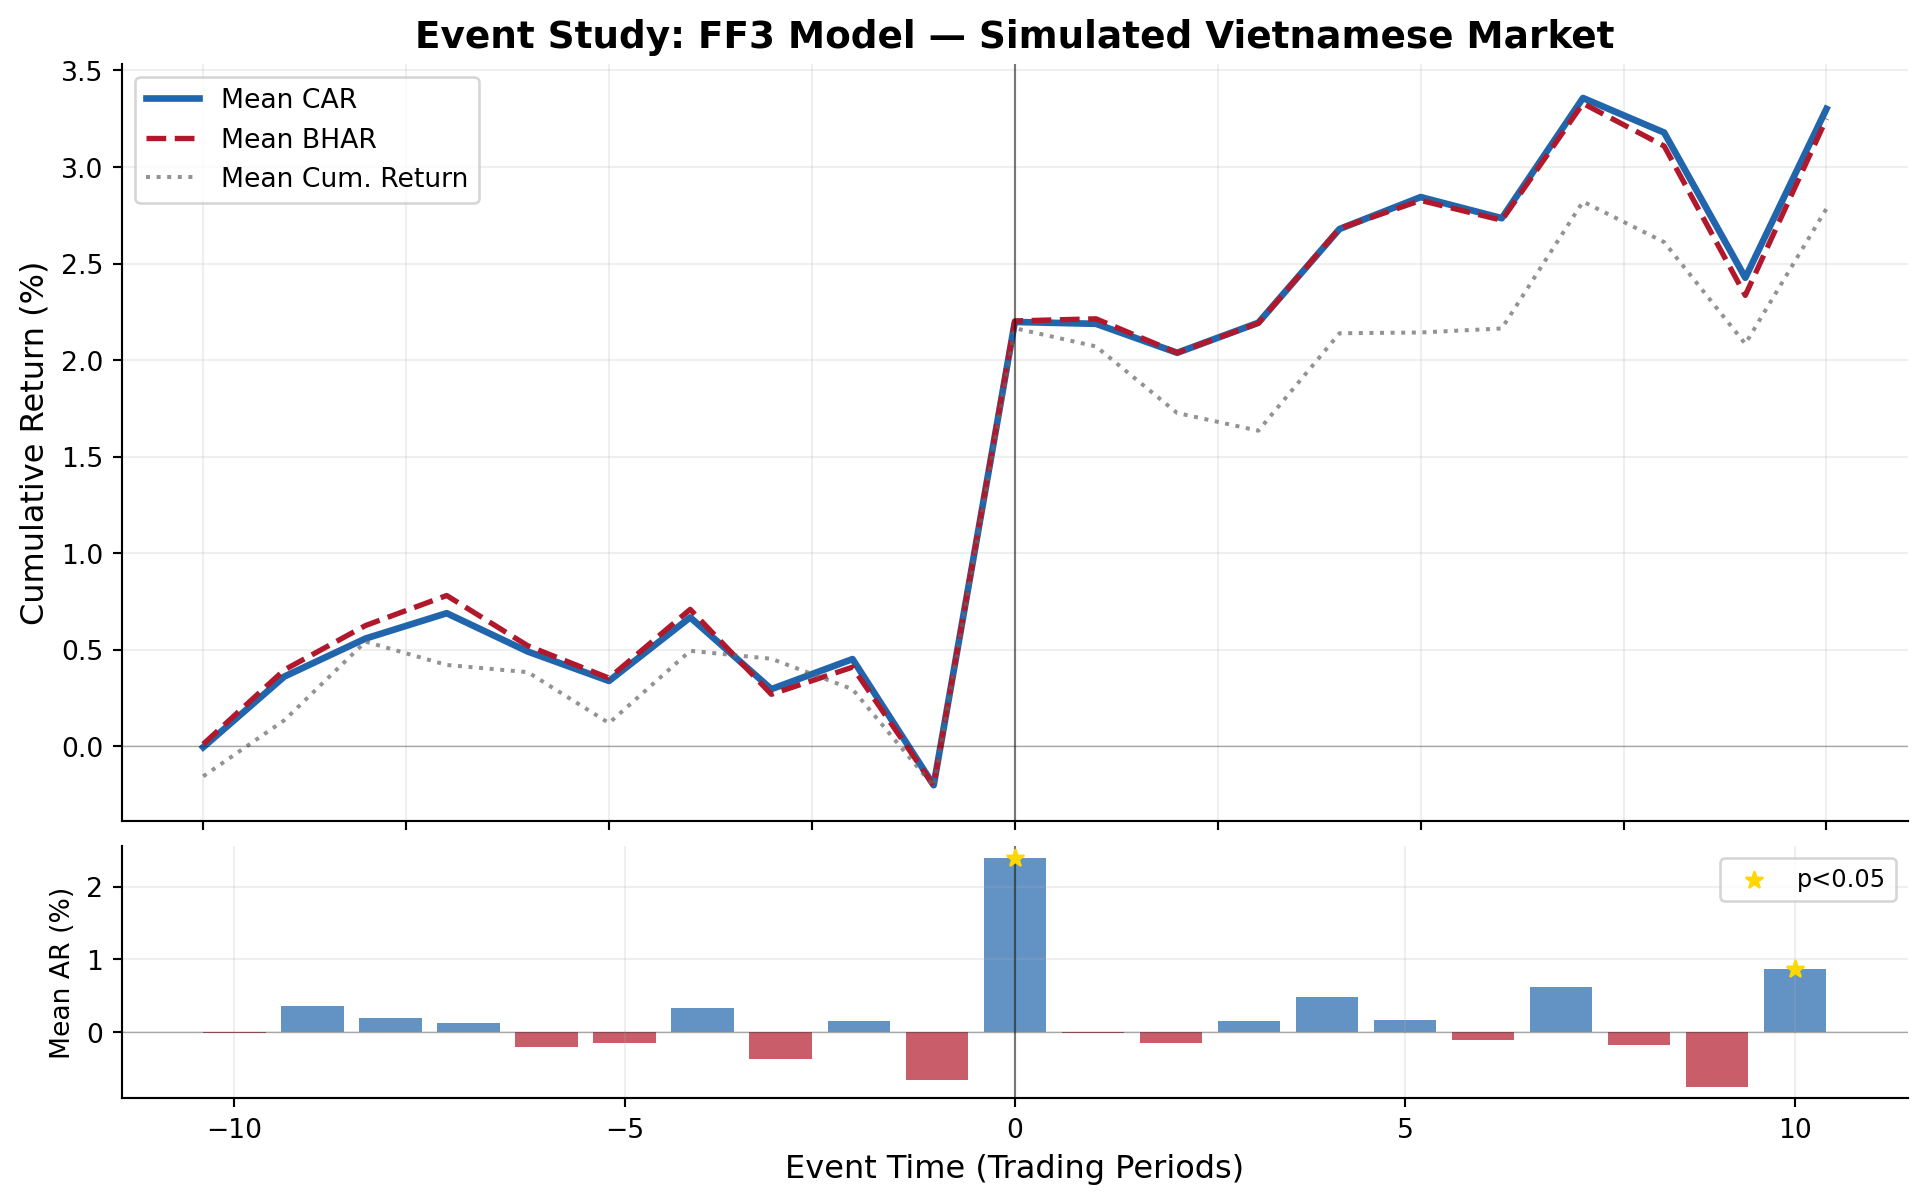
Figure 41.1: Dynamics of cumulative abnormal returns (CARs) and buy-and-hold abnormal returns (BHARs) around the event date. The positive jump at t=0 reflects the injected 2% abnormal return.
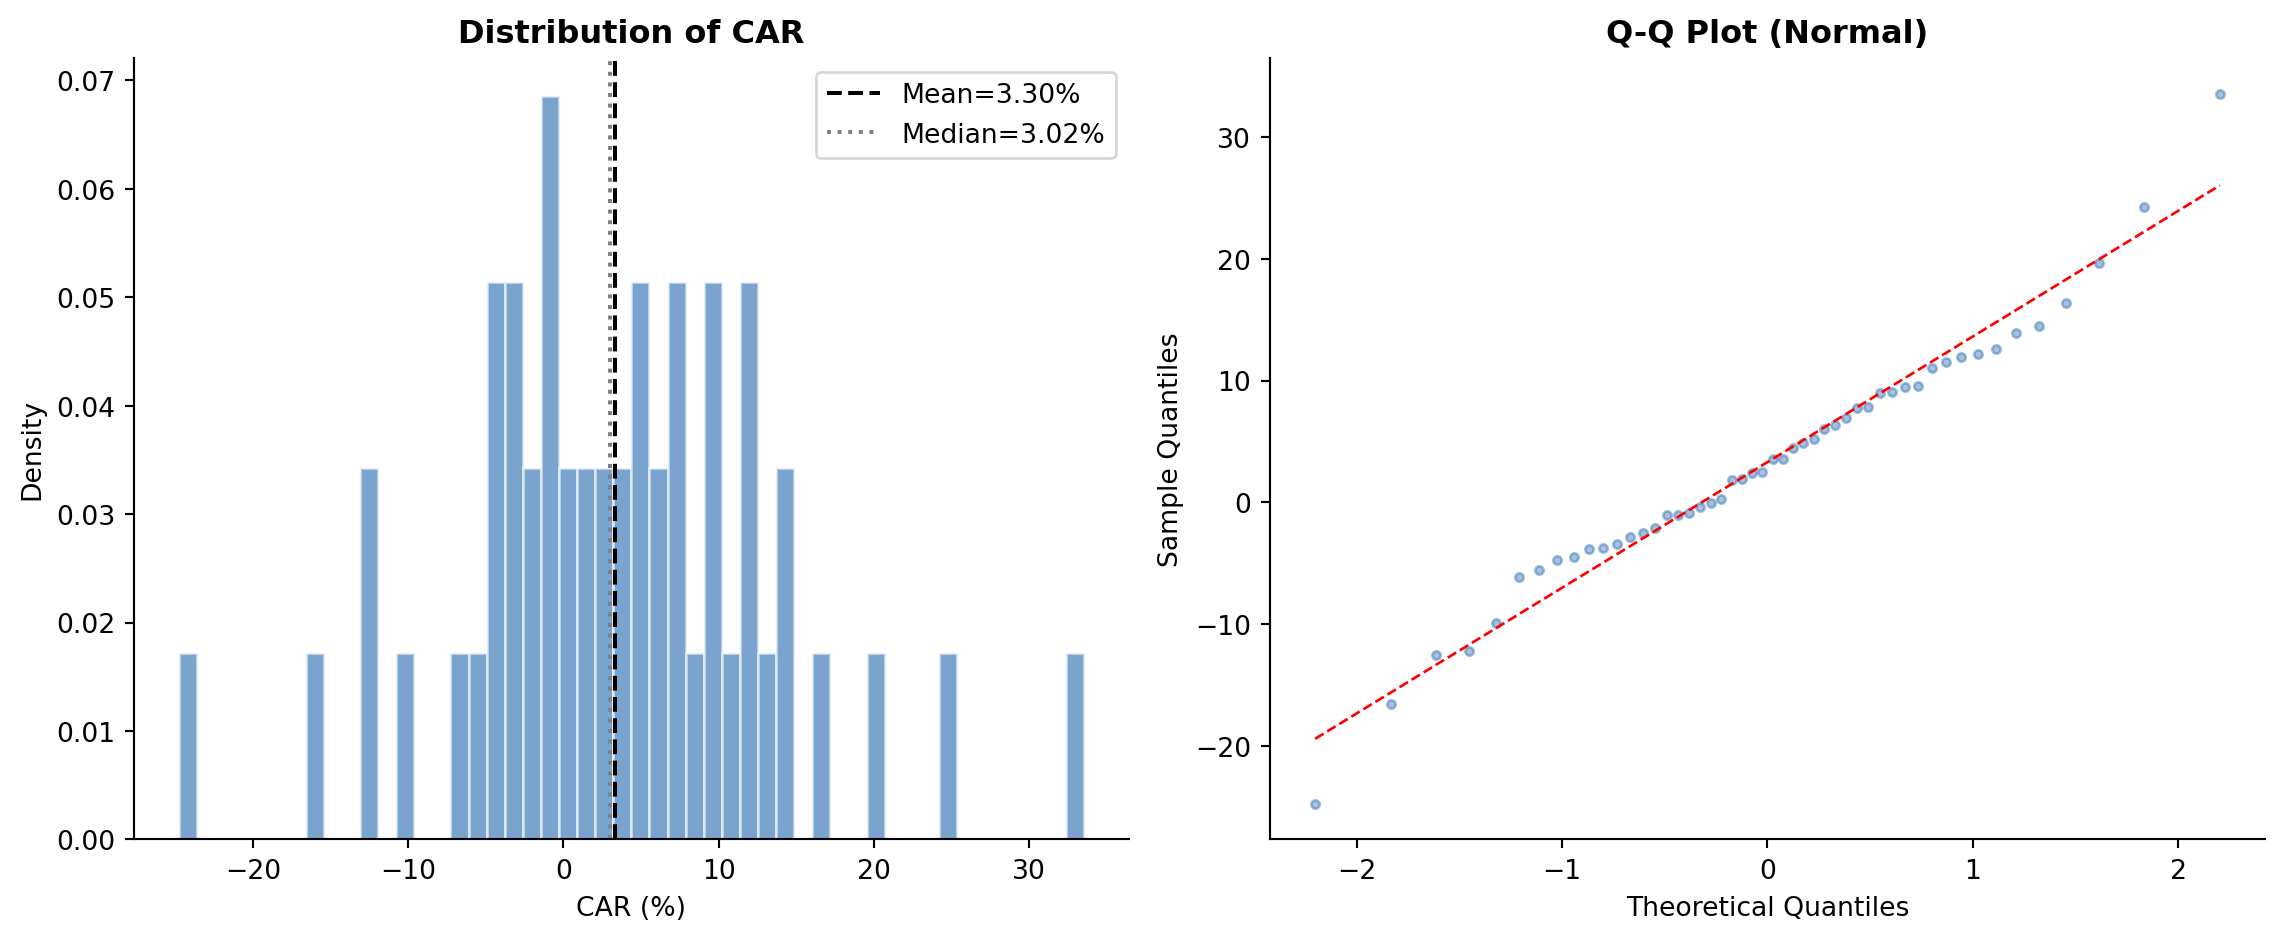
Figure 41.2: Cross-sectional distribution of cumulative abnormal returns. The rightward shift from zero and positive skewness are consistent with the injected positive event effect.
41.4.3 Complete Test Statistics
Show code
# Format for displayts = results['test_stats'].copy()# Select key columnsdisplay_cols = ['group', 'N', 'mean_CAR', 'mean_BHAR', 'pct_positive','t_CS', 'p_CS', 'Z_Patell', 'p_Patell','t_BMP', 'p_BMP', 't_KP', 'p_KP','Z_GSign', 'p_GSign', 't_SkAdj', 'p_SkAdj']avail = [c for c in display_cols if c in ts.columns]display_df = ts[avail].copy()# Formatfor c in display_df.columns:if c in ['N']: display_df[c] = display_df[c].astype(int)elif c.startswith('p_'): display_df[c] = display_df[c].map(lambda x: f'{x:.4f}'if pd.notna(x) else'')elif c in ['mean_CAR', 'mean_BHAR']: display_df[c] = display_df[c].map(lambda x: f'{x:.4%}'if pd.notna(x) else'')elif c =='pct_positive': display_df[c] = display_df[c].map(lambda x: f'{x:.1%}'if pd.notna(x) else'')elifisinstance(display_df[c].iloc[0], (int, float, np.floating)): display_df[c] = display_df[c].map(lambda x: f'{x:.3f}'if pd.notna(x) else'')print(display_df.to_string(index=False))
Table 41.3: Event study test statistics for the full sample and by subgroup
Since our data provides ret_excess rather than raw returns, we recover raw returns as \(R_{it} = R^e_{it} + R_{f,t}\), and the market return as \(R_{m,t} = R^e_{m,t} + R_{f,t}\). The extract_event_returns() function handles this automatically.
41.6.1 Loading the Data
Load Vietnamese market data
# --- Recover raw returns ---# ret = ret_excess + risk_freeprices_daily['ret'] = prices_daily['ret_excess'] + prices_daily['risk_free']prices_monthly['ret'] = prices_monthly['ret_excess'] + prices_monthly['risk_free']# --- Inspect the data ---print("="*70)print("VIETNAMESE MARKET DATA SUMMARY")print("="*70)print(f"\nprices_daily: {prices_daily.shape[0]:,} rows, "f"{prices_daily['symbol'].nunique()} stocks, "f"{prices_daily['date'].min().date()} to {prices_daily['date'].max().date()}")print(f"prices_monthly: {prices_monthly.shape[0]:,} rows, "f"{prices_monthly['symbol'].nunique()} stocks")print(f"\nfactors_ff3_daily: {factors_ff3_daily.shape[0]:,} trading days")print(f" Columns: {list(factors_ff3_daily.columns)}")print(f"factors_ff5_daily: {factors_ff5_daily.shape[0]:,} trading days")print(f" Columns: {list(factors_ff5_daily.columns)}")print(f"\nSample daily returns:")print(prices_daily[['symbol', 'date', 'ret_excess', 'ret', 'risk_free', 'mktcap']] .head(5).to_string(index=False))print(f"\nSample daily factors:")print(factors_ff3_daily.head(5).to_string(index=False))
For this demonstration, we create a sample event file. In practice, events would come from corporate announcements (earnings, M&A, dividends), regulatory changes, or other information shocks. Here we select 50 large-cap Vietnamese stocks and assign random event dates from the most recent two years of data to illustrate the pipeline mechanics.
Create sample event file for demonstration
np.random.seed(2024)# Select the 50 largest stocks by median market caplargest = (prices_daily.groupby('symbol')['mktcap'] .median() .nlargest(50) .index.tolist())# Date range for events: last 2 years of data, with buffer for windowsdate_range = prices_daily['date'].sort_values().unique()n_dates =len(date_range)# Events from the middle portion (need room for estimation + event windows)event_eligible = date_range[int(n_dates *0.3):int(n_dates *0.85)]# Generate 50 random firm-event pairsevent_firms = np.random.choice(largest, 50, replace=True)event_dates = np.random.choice(event_eligible, 50, replace=False)events_demo = pd.DataFrame({'symbol': event_firms,'event_date': pd.to_datetime(event_dates),'group': np.random.choice(['Group_A', 'Group_B'], 50)})# Remove any duplicate firm-date pairsevents_demo = events_demo.drop_duplicates(subset=['symbol', 'event_date'])print(f"Sample event file: {len(events_demo)} firm-event observations")print(f"Unique firms: {events_demo['symbol'].nunique()}")print(f"Date range: {events_demo['event_date'].min().date()} to "f"{events_demo['event_date'].max().date()}")print(f"\nGroup distribution:")print(events_demo['group'].value_counts().to_string())print(f"\nFirst 10 events:")print(events_demo.sort_values('event_date').head(10).to_string(index=False))
Sample event file: 50 firm-event observations
Unique firms: 35
Date range: 2014-06-25 to 2021-10-29

Group distribution:
group
Group_B    26
Group_A    24

First 10 events:
symbol event_date   group
   MCH 2014-06-25 Group_B
   SIP 2014-10-23 Group_B
   VRE 2014-11-14 Group_B
   QNS 2014-12-25 Group_A
   FOX 2015-01-16 Group_B
   THD 2015-01-26 Group_A
   QNS 2015-02-12 Group_A
   HNG 2015-05-07 Group_B
   MML 2015-08-17 Group_B
   ACV 2015-10-15 Group_A
41.6.3 Daily Event Study: Fama-French 3-Factor Model
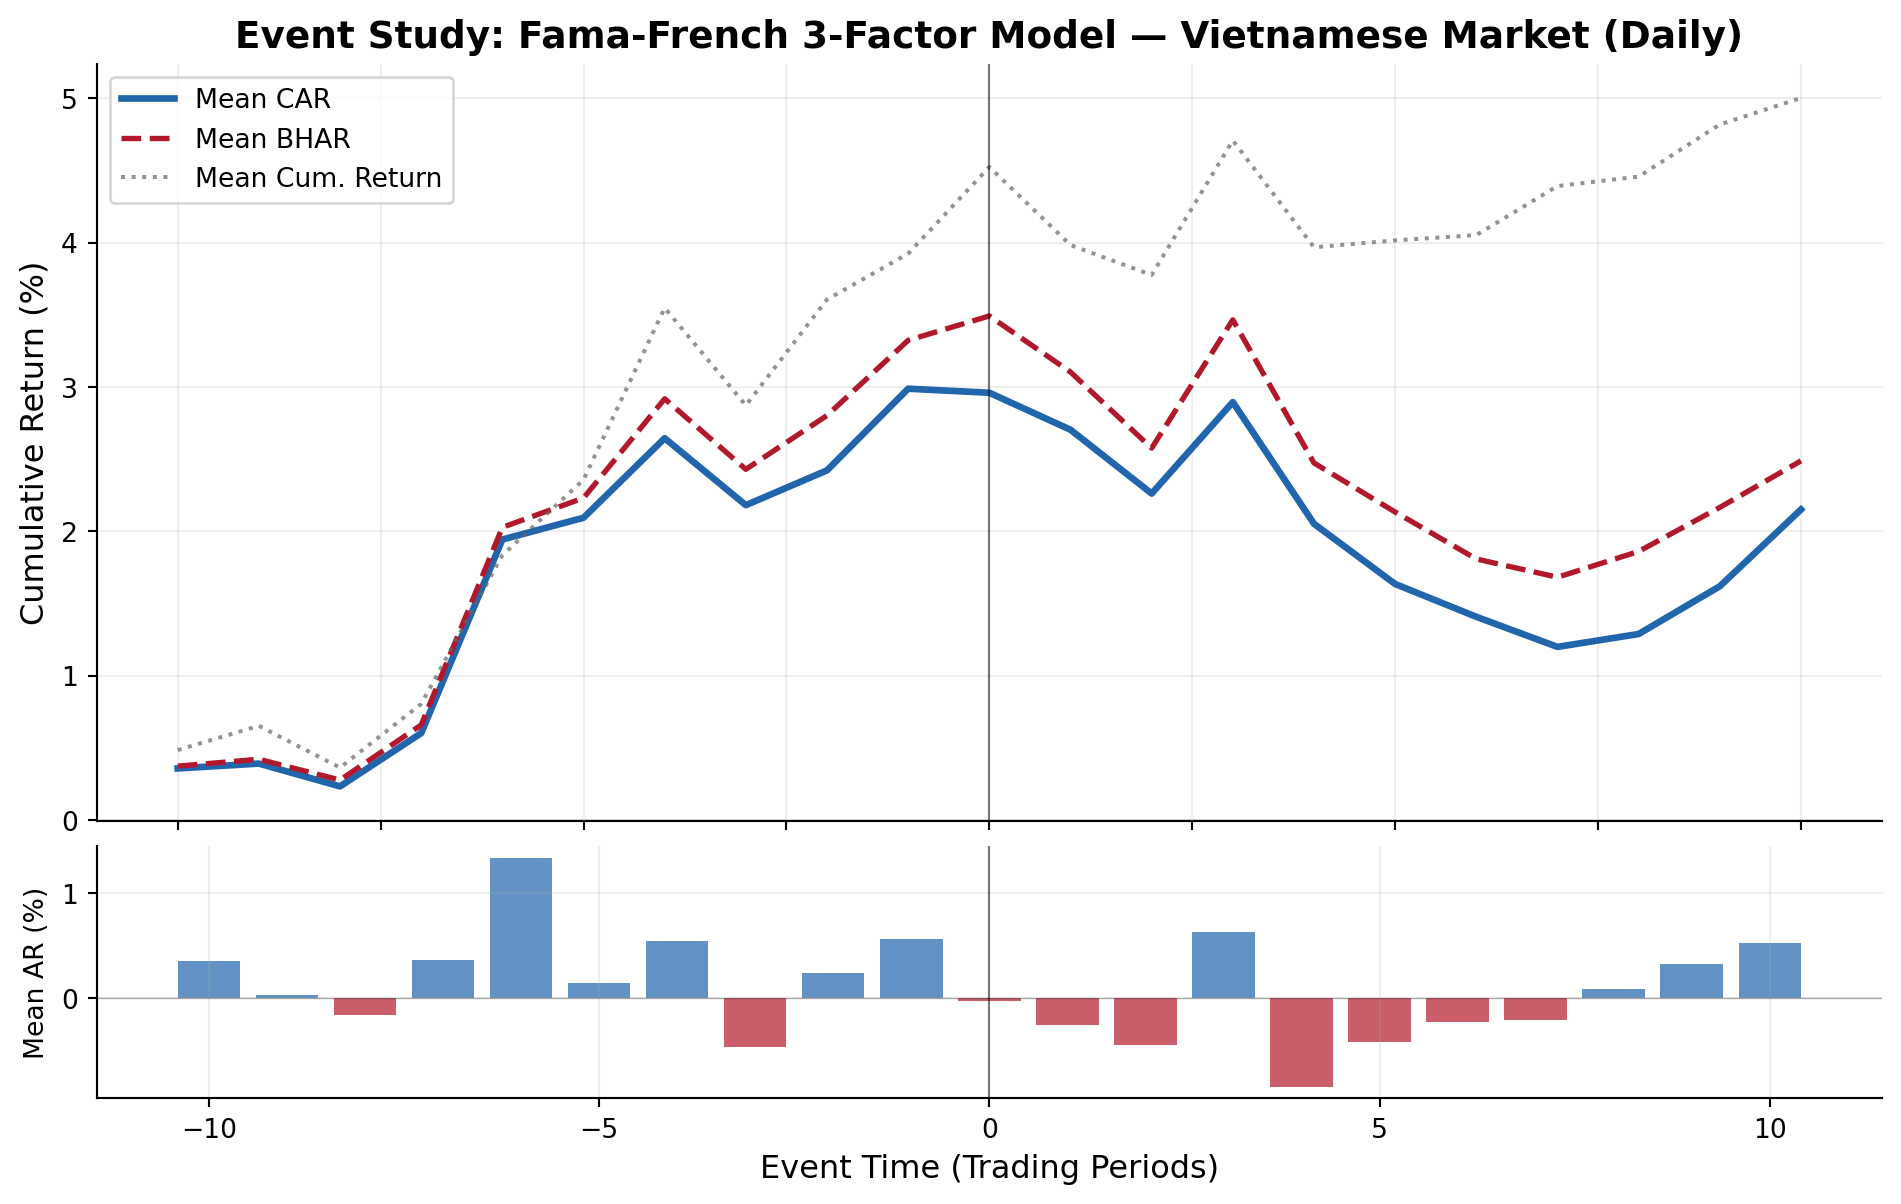
Figure 41.3: Cumulative abnormal returns around event dates for Vietnamese stocks using the Fama-French 3-factor model. The event window spans [-10, +10] trading days.
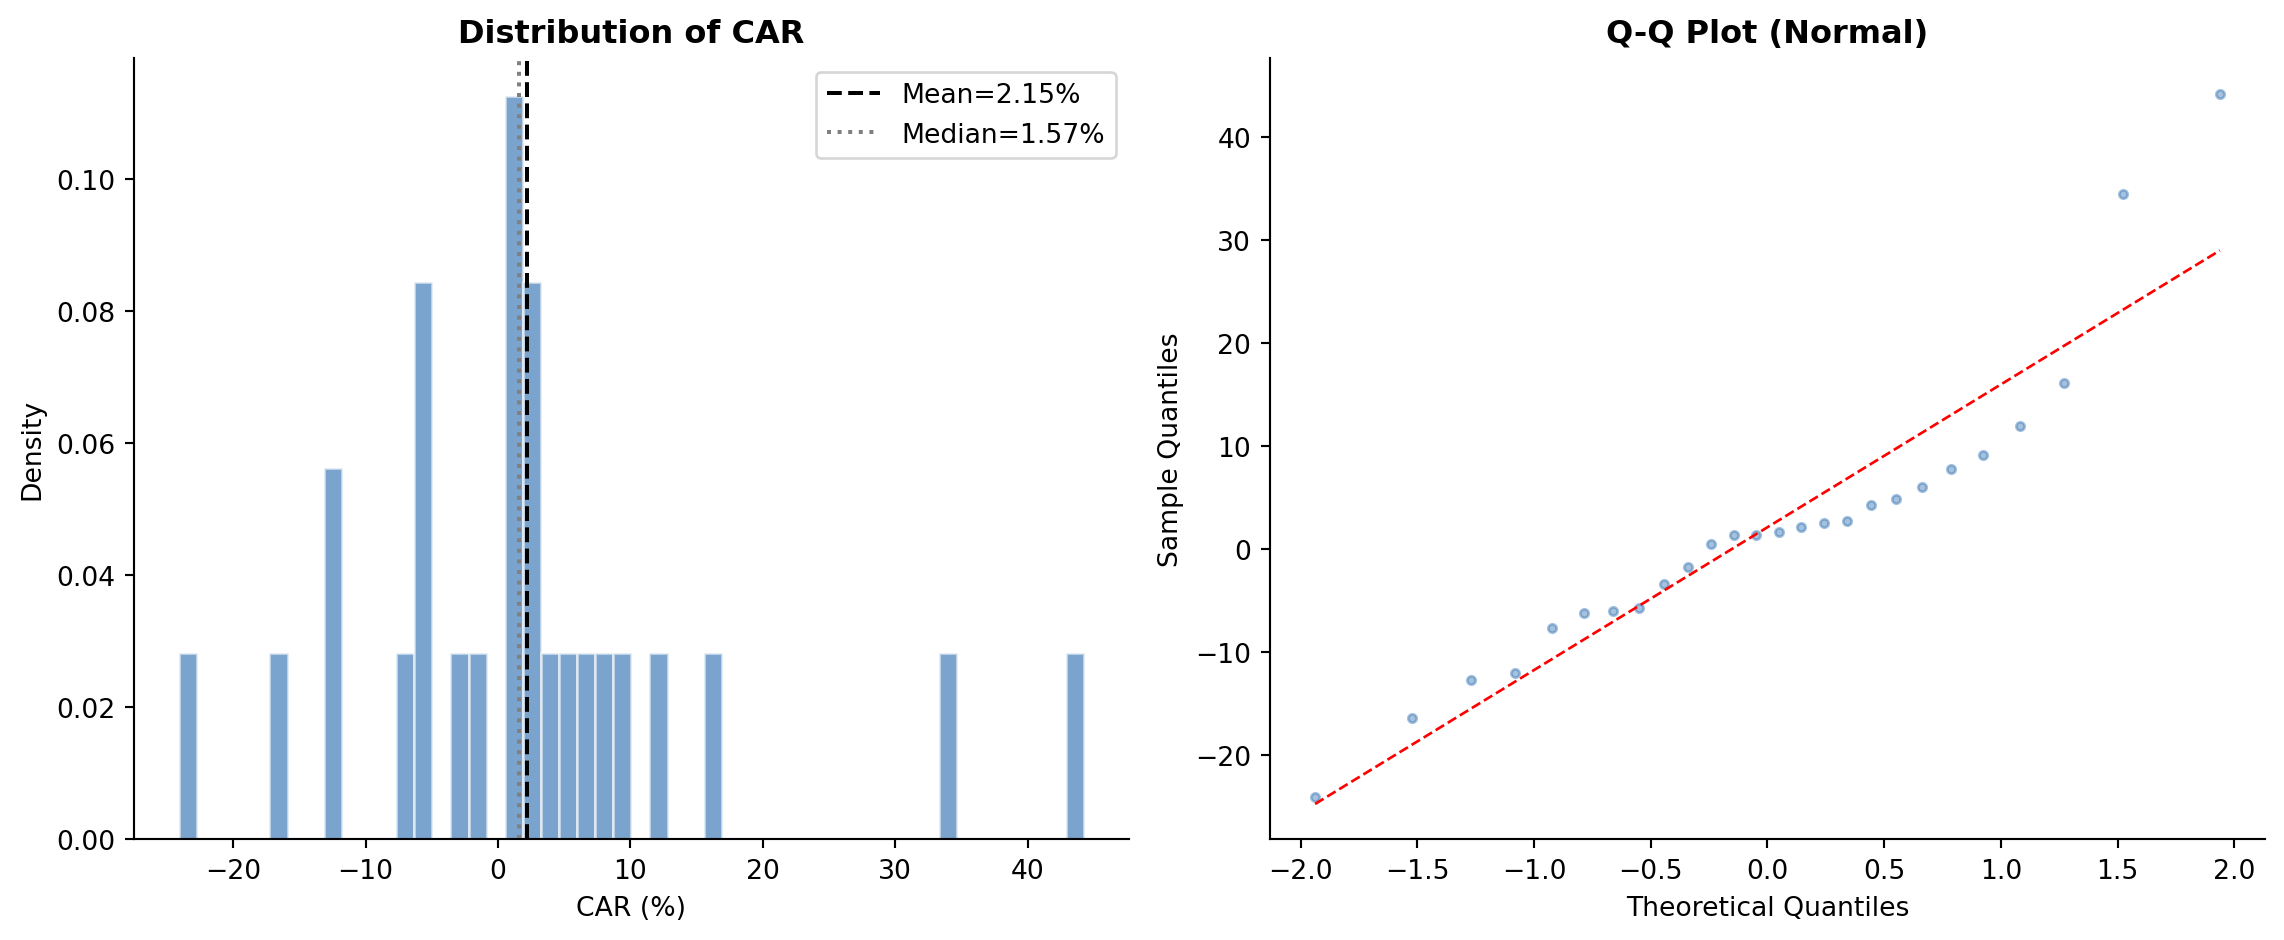
Figure 41.4: Cross-sectional distribution of cumulative abnormal returns (CARs) across firm-events. The histogram and Q-Q plot assess normality assumptions underlying parametric tests.
41.6.5 Complete Test Statistics (Daily)
Show code
ts = results_ff3['test_stats'].copy()display_cols = ['group', 'N', 'mean_CAR', 'median_CAR', 'mean_BHAR', 'pct_positive','t_CS', 'p_CS', 'Z_Patell', 'p_Patell','t_BMP', 'p_BMP', 't_KP', 'p_KP','Z_GSign', 'p_GSign', 't_SkAdj', 'p_SkAdj','W_Wilcoxon', 'p_Wilcoxon']avail = [c for c in display_cols if c in ts.columns]display_df = ts[avail].copy()for c in display_df.columns:if c in ['N']: display_df[c] = display_df[c].astype(int)elif c =='group':continueelif c.startswith('p_'): display_df[c] = display_df[c].map(lambda x: f'{x:.4f}'if pd.notna(x) else'')elif c in ['mean_CAR', 'median_CAR', 'mean_BHAR']: display_df[c] = display_df[c].map(lambda x: f'{x:.4%}'if pd.notna(x) else'')elif c =='pct_positive': display_df[c] = display_df[c].map(lambda x: f'{x:.1%}'if pd.notna(x) else'')elifisinstance(display_df[c].iloc[0], (int, float, np.floating)): display_df[c] = display_df[c].map(lambda x: f'{x:.3f}'if pd.notna(x) else'')print(display_df.to_string(index=False))
Table 41.4: Event study test statistics for the full sample and by subgroup — Daily frequency, FF3 model
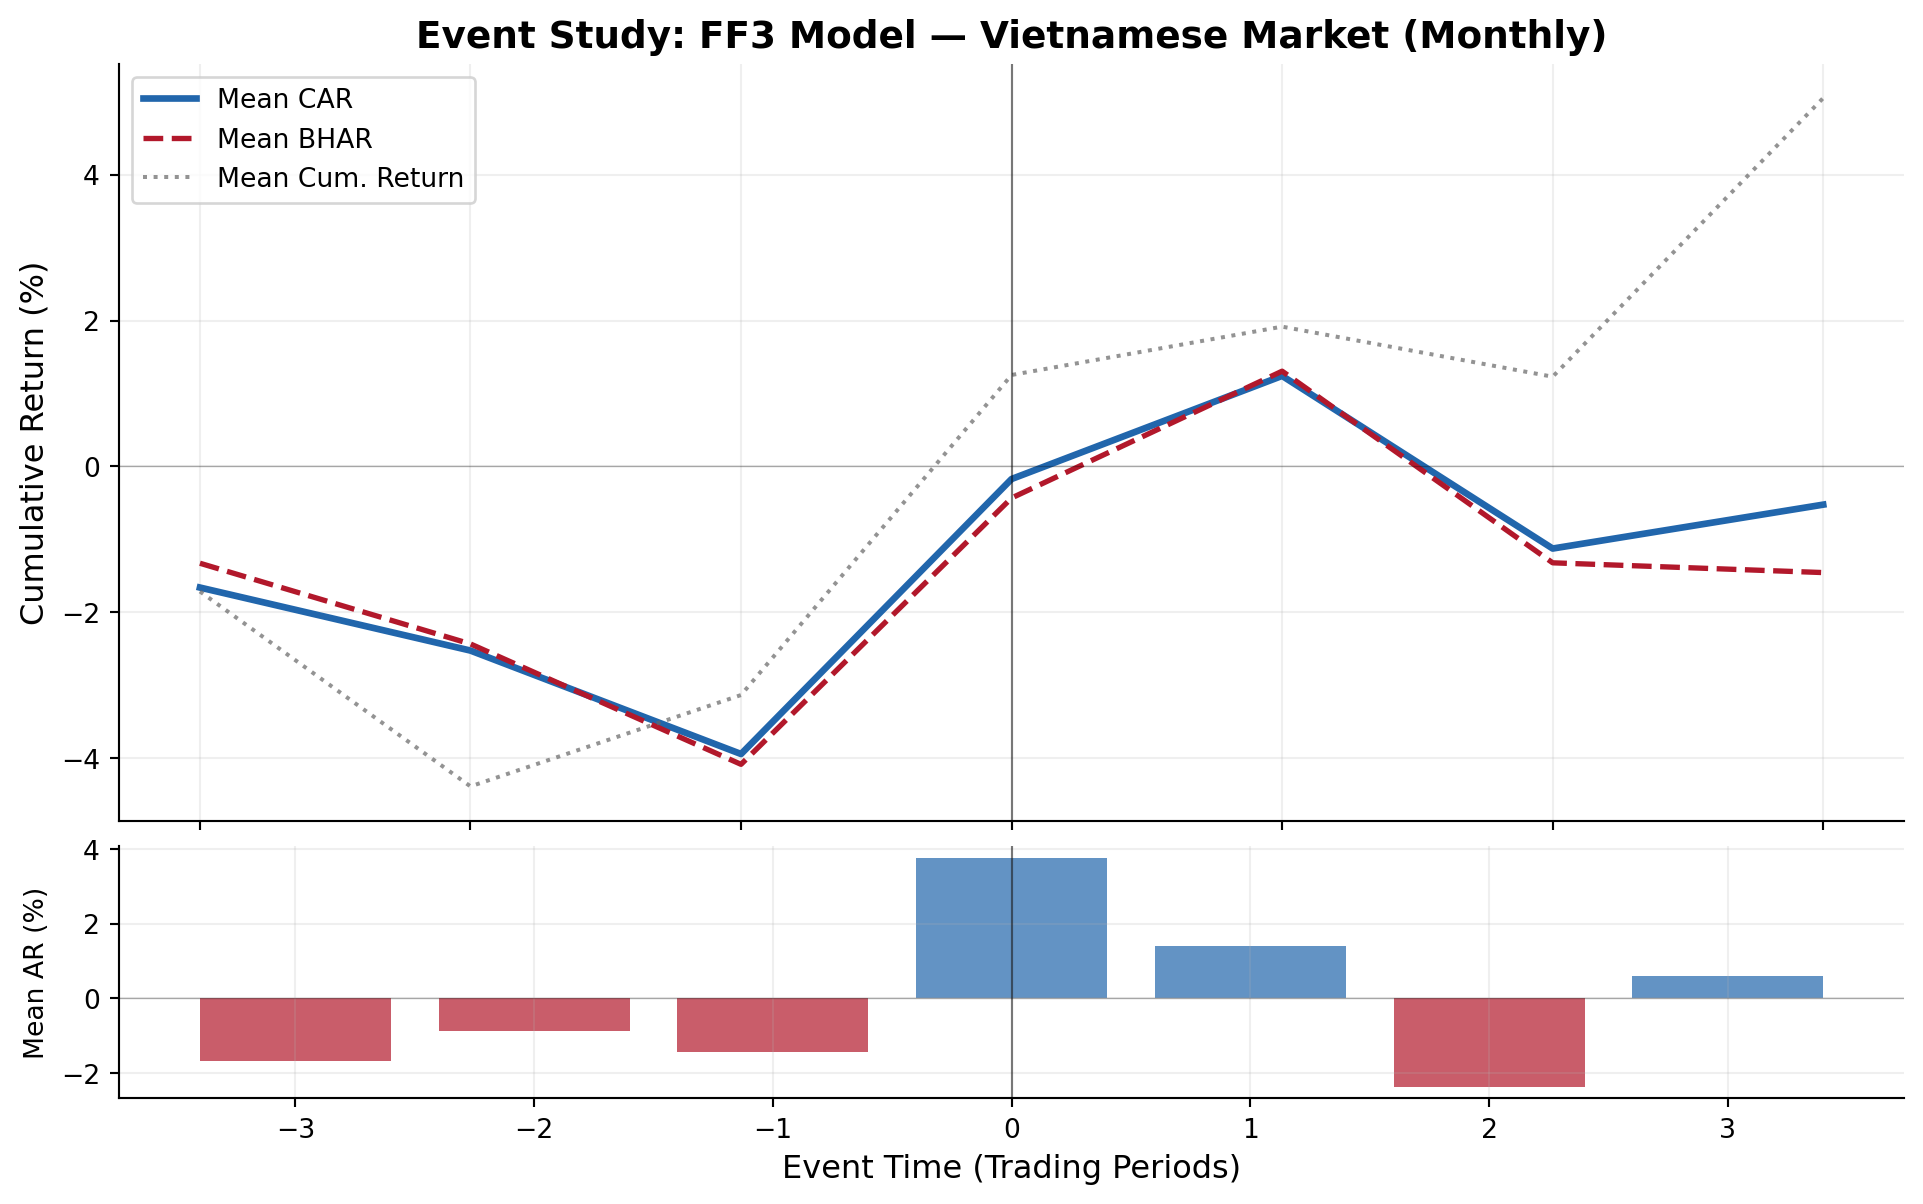
Figure 41.5: Monthly cumulative abnormal returns around event dates. Wider windows capture slower information incorporation typical of emerging markets.
41.6.9 Daily Event Study: Fama-French 5-Factor Model
Table 41.7: Comparison of estimation quality between FF3 and FF5 models
Model Estimation Diagnostics
============================================================

Metric                                  FF3          FF5
------------------------------------------------------
Firm-events estimated                    26           26
Mean R^2                             0.2245       0.2675
Median R^2                           0.1943       0.2692
Mean σ(ε)                          0.021753     0.021351
Mean |α|                           0.001022     0.001130
Mean β(MKT)                          0.8867       0.9721
Mean β(SMB)                         -0.0434       0.0265
Mean β(HML)                          0.2489       0.1493
Mean β(RMW)                               —      -0.0934
Mean β(CMA)                               —       0.1070
41.6.11 Event-Level Detail
Show code
detail = results_ff3['event_ar'].copy()detail_cols = ['symbol', 'evtdate', 'CAR', 'BHAR', 'SCAR', 'sigma','nobs', 'alpha', 'beta_mkt_excess']detail_avail = [c for c in detail_cols if c in detail.columns]detail_show = detail[detail_avail].copy()detail_show['CAR'] = detail_show['CAR'].map(lambda x: f'{x:.4%}')detail_show['BHAR'] = detail_show['BHAR'].map(lambda x: f'{x:.4%}')detail_show['SCAR'] = detail_show['SCAR'].map(lambda x: f'{x:.3f}')print("Event-Level Results (first 20 firm-events)")print("="*100)print(detail_show.head(20).to_string(index=False))
Table 41.8: Event-level detail: CARs and BHARs for each firm-event (FF3 model)
ds = results_ff3['daily_stats'].copy()ds_cols = ['evttime', 'N', 'mean_AR', 'mean_CAR', 'mean_BHAR', 't_AR_CS', 't_AR_BMP']ds_avail = [c for c in ds_cols if c in ds.columns]ds_show = ds[ds_avail].copy()for c in ['mean_AR', 'mean_CAR', 'mean_BHAR']:if c in ds_show.columns: ds_show[c] = ds_show[c].map(lambda x: f'{x:.4%}')for c in ['t_AR_CS', 't_AR_BMP']:if c in ds_show.columns: ds_show[c] = ds_show[c].map(lambda x: f'{x:.3f}'if pd.notna(x) else'')print("Daily Event-Window Dynamics (FF3 Model)")print("="*80)print(ds_show.to_string(index=False))
Table 41.9: Daily dynamics of mean abnormal returns and test statistics within the event window
print("="*70)print("EVENT STUDY RESULTS SUMMARY")print("="*70)ff3_all = results_ff3['test_stats'][results_ff3['test_stats']['group'] =='All'].iloc[0]print(f"\nSample: {int(ff3_all['N'])} firm-event observations")print(f"Frequency: Daily")print(f"Primary Model: Fama-French 3-Factor")print(f"Estimation Window: {config_ff3.estimation_window} trading days")print(f"Event Window: ({config_ff3.event_window_start}, {config_ff3.event_window_end})")print(f"Gap: {config_ff3.gap} trading days")print(f"\n--- Abnormal Return Measures ---")print(f"Mean CAR({config_ff3.event_window_start},{config_ff3.event_window_end}): "f"{ff3_all['mean_CAR']:.4%}")print(f"Median CAR: {ff3_all['median_CAR']:.4%}")print(f"Mean BHAR: {ff3_all['mean_BHAR']:.4%}")print(f"Fraction positive CARs: {ff3_all['pct_positive']:.1%}")print(f"\n--- Statistical Significance ---")print(f"Cross-Sectional t: {ff3_all['t_CS']:.3f} (p = {ff3_all['p_CS']:.4f})")print(f"Patell Z: {ff3_all['Z_Patell']:.3f} (p = {ff3_all['p_Patell']:.4f})")print(f"BMP t: {ff3_all['t_BMP']:.3f} (p = {ff3_all['p_BMP']:.4f})")print(f"Kolari-Pynnönen t: {ff3_all['t_KP']:.3f} (p = {ff3_all['p_KP']:.4f})")print(f"Generalized Sign Z: {ff3_all['Z_GSign']:.3f} (p = {ff3_all['p_GSign']:.4f})")sig_005 =sum(1for k in ['p_CS','p_Patell','p_BMP','p_KP','p_GSign','p_SkAdj','p_Wilcoxon']if k in ff3_all and pd.notna(ff3_all[k]) and ff3_all[k] <0.05)total_tests =sum(1for k in ['p_CS','p_Patell','p_BMP','p_KP','p_GSign','p_SkAdj','p_Wilcoxon']if k in ff3_all and pd.notna(ff3_all[k]))print(f"\n{sig_005}/{total_tests} tests significant at 5% level")# Robustness noteprint(f"\nRobustness: Results checked across {len(models_daily)} risk models "f"and {len(windows)} event windows")
======================================================================
EVENT STUDY RESULTS SUMMARY
======================================================================

Sample: 26 firm-event observations
Frequency: Daily
Primary Model: Fama-French 3-Factor
Estimation Window: 150 trading days
Event Window: (-10, 10)
Gap: 15 trading days

--- Abnormal Return Measures ---
Mean CAR(-10,10): 2.1513%
Median CAR: 1.5701%
Mean BHAR: 2.4885%
Fraction positive CARs: 61.5%

--- Statistical Significance ---
Cross-Sectional t: 0.775 (p = 0.4456)
Patell Z: 0.961 (p = 0.3364)
BMP t: 0.727 (p = 0.4741)
Kolari-Pynnönen t: 0.700 (p = 0.4904)
Generalized Sign Z: 1.177 (p = 0.2393)

0/7 tests significant at 5% level

Robustness: Results checked across 4 risk models and 7 event windows
41.7 Practical Recommendations
Based on the literature and our implementation experience:
Estimation window: Use 150 trading days (~7 months) for daily studies. This balances parameter precision against structural breaks. For monthly studies, 60 months is standard (Kothari and Warner 2007).
Gap: 15 trading days is standard. Increase to 30 if information leakage is a concern.
Event window: Start with (-1, +1) for short-window tests, then expand to (-5, +5) and (-10, +10) for robustness. Report all windows.
Model choice: Always report market model as the baseline. Add FF3 or FF5 for robustness. For Vietnam, local factors are preferable to global factors.
Test statistics: Report at minimum: cross-sectional t (for ease of interpretation), BMP (robust to event-induced variance), and one non-parametric test (sign or Wilcoxon). Report Kolari-Pynnönen if events cluster in calendar time.
Thin trading: For Vietnamese small-caps, consider Dimson (1979) with 1 lead/lag or increase min_estimation_obs to filter out illiquid stocks.
Multiple testing: If testing multiple event windows or subgroups, apply Bonferroni or Holm corrections to control family-wise error rate.
Aharony, Joseph, and Itzhak Swary. 1980. “Quarterly Dividend and Earnings Announcements and Stockholders’ Returns: An Empirical Analysis.”The Journal of Finance 35 (1): 1–12.
Andrade, Gregor, Mark Mitchell, and Erik Stafford. 2001. “New Evidence and Perspectives on Mergers.”Journal of Economic Perspectives 15 (2): 103–20.
Ball, Ray, and Philip Brown. 2013. “An Empirical Evaluation of Accounting Income Numbers.” In Financial Accounting and Equity Markets, 27–46. Routledge.
Barber, Brad M, and John D Lyon. 1997. “Detecting Long-Run Abnormal Stock Returns: The Empirical Power and Specification of Test Statistics.”Journal of Financial Economics 43 (3): 341–72.
Bernard, Victor L, and Jacob K Thomas. 1989. “Post-Earnings-Announcement Drift: Delayed Price Response or Risk Premium?”Journal of Accounting Research 27: 1–36. https://doi.org/10.2307/2491062.
Bhattacharya, Utpal, Hazem Daouk, Brian Jorgenson, and Carl-Heinrich Kehr. 2000. “When an Event Is Not an Event: The Curious Case of an Emerging Market.”Journal of Financial Economics 55 (1): 69–101.
Binder, John. 1998. “The Event Study Methodology Since 1969.”Review of Quantitative Finance and Accounting 11 (2): 111–37.
Boehmer, Ekkehart, Jim Masumeci, and Annette B Poulsen. 1991. “Event-Study Methodology Under Conditions of Event-Induced Variance.”Journal of Financial Economics 30 (2): 253–72.
Brown, Stephen J, and Jerold B Warner. 1980. “Measuring Security Price Performance.”Journal of Financial Economics 8 (3): 205–58.
———. 1985. “Using Daily Stock Returns: The Case of Event Studies.”Journal of Financial Economics 14 (1): 3–31.
Campbell, John Y, Andrew W Lo, A Craig MacKinlay, and Robert F Whitelaw. 1998. “The Econometrics of Financial Markets.”Macroeconomic Dynamics 2 (4): 559–62.
Corrado, Charles J. 1989. “A Nonparametric Test for Abnormal Security-Price Performance in Event Studies.”Journal of Financial Economics 23 (2): 385–95.
Cowan, Arnold Richard. 1992. “Nonparametric Event Study Tests.”Review of Quantitative Finance and Accounting 2 (4): 343–58.
Dimson, Elroy. 1979. “Risk Measurement When Shares Are Subject to Infrequent Trading.”Journal of Financial Economics 7 (2): 197–226. https://doi.org/10.1016/0304-405X(79)90013-8.
Fama, Eugene F. 1998. “Market Efficiency, Long-Term Returns, and Behavioral Finance.”Journal of Financial Economics 49 (3): 283–306.
Fama, Eugene F, Lawrence Fisher, Michael C Jensen, and Richard Roll. 1969. “The Adjustment of Stock Prices to New Information.”International Economic Review 10 (1): 1–21.
Fama, Eugene F., and Kenneth R. French. 1993. “Common risk factors in the returns on stocks and bonds.”Journal of Financial Economics 33 (1): 3–56. https://doi.org/10.1016/0304-405X(93)90023-5.
Flannery, Mark J, and Aris A Protopapadakis. 2002. “Macroeconomic Factors Do Influence Aggregate Stock Returns.”The Review of Financial Studies 15 (3): 751–82.
Griffin, John M, Patrick J Kelly, and Federico Nardari. 2010. “Do Market Efficiency Measures Yield Correct Inferences? A Comparison of Developed and Emerging Markets.”The Review of Financial Studies 23 (8): 3225–77.
Hall, Peter. 1992. “On the Removal of Skewness by Transformation.”Journal of the Royal Statistical Society Series B: Statistical Methodology 54 (1): 221–28.
Jensen, Michael C, and Richard S Ruback. 1983. “The Market for Corporate Control: The Scientific Evidence.”Journal of Financial Economics 11 (1-4): 5–50.
Kolari, James W, and Seppo Pynnönen. 2010. “Event Study Testing with Cross-Sectional Correlation of Abnormal Returns.”The Review of Financial Studies 23 (11): 3996–4025.
Kothari, Sagar P, and Jerold B Warner. 2007. “Econometrics of Event Studies.” In Handbook of Empirical Corporate Finance, 3–36. Elsevier.
MacKinlay, A Craig. 1997. “Event Studies in Economics and Finance.”Journal of Economic Literature 35 (1): 13–39.
Mitchell, Mark L, and Jeffry M Netter. 1993. “The Role of Financial Economics in Securities Fraud Cases: Applications at the Securities and Exchange Commission.”Bus. Law. 49: 545.
Mitchell, Mark L, and Erik Stafford. 2000. “Managerial Decisions and Long-Term Stock Price Performance.”The Journal of Business 73 (3): 287–329.
Patell, James M. 1976. “Corporate Forecasts of Earnings Per Share and Stock Price Behavior: Empirical Test.”Journal of Accounting Research, 246–76.
Scholes, Myron, and Joseph Williams. 1977. “Estimating Betas from Nonsynchronous Data.”Journal of Financial Economics 5 (3): 309–27. https://doi.org/10.1016/0304-405X(77)90041-1.
Schwert, G William. 1981. “Using Financial Data to Measure Effects of Regulation.”The Journal of Law and Economics 24 (1): 121–58.