Does it pay to fill a property with tenants from one industry? Urban economics says clustering makes firms more productive: they share suppliers, draw on a common pool of skilled workers, and learn from each other (Rosenthal and Strange 2004). If tenants value that, they should pay more rent to be near firms like themselves, and the owner of the property should capture part of the gain. Portfolio logic says the opposite. A landlord whose tenants all work in one industry has concentrated its exposure, and one bad year for that industry hits the whole rent roll at once.
Liu, Zheng, and Zhu (2026) take this trade-off to US office buildings, and their answer is that clustering raises value only in one configuration: when a building’s tenants and its surrounding neighborhood both specialize in the same industry. They also show that the stock market agrees. REITs earn positive abnormal returns when they buy specialized buildings and negative ones when they sell them.
This chapter does two things with the paper:
Section 42.1 lays out its design and results, and what changed between the working paper and the published version.
Section 42.2 onward turns it into a worked example for Vietnam. The setting changes from office buildings to industrial parks, and the market test changes from REIT trades to lease announcements by listed park developers. Section 42.3 presents a hand-collected set of announcements, Section 42.4 asks how large an effect they can detect, and Section 42.5 runs the event study with the pipeline from the event-study chapter.
Sources used in this chapter
The paper is Liu, Zheng, and Zhu (2026), Management Science 72(10), 8366–8393. The published PDF sits behind a bot check, so the design details and coefficient magnitudes below come from the February 2022 working paper, “The Agglomerative Effects of Neighborhood and Building Specialization on Office Values,” presented at the European Real Estate Society conference. The question, the trade-off, and the headline result are quoted from the published abstract. Some magnitudes may have changed between versions.
42.1 The Paper
42.1.1 Question and Trade-Off
The published abstract opens with the trade-off: agglomeration within a building or neighborhood brings higher tenant productivity, at the cost of a more concentrated tenant base. Which effect dominates is an empirical question. Earlier work on office rents had found a positive link between clustering and rents, but with averaged rents or averaged measures of clustering, so it could not separate building quality from location (Liu, Zheng, and Zhu 2026). Two features set this paper apart. It measures clustering at two levels, around the building (the “horizontal” dimension) and inside it (the “vertical” dimension, following the evidence that agglomeration operates within buildings and even across floors (Liu, Rosenthal, and Strange 2018)). And it links the two levels by asking whether the building’s main tenant works in the industry its neighborhood specializes in.
42.1.2 Data and Measures
The working-paper sample is 457 office buildings bought or sold by 57 US REITs between 2014 and 2020, with 5,396 tenants hand-collected from CoStar. Neighborhoods are 5-digit ZIP codes, and their industry mix comes from the Census ZIP Code Business Patterns at the 2-digit NAICS level. The paper builds three measures.
Neighborhood concentration is a Herfindahl index of employment shares across industries \(k\) in the ZIP code of building \(i\):
Building-neighborhood specialization is the key measure. Find the industry \(a(i)\) of the building’s largest tenant, and divide the ZIP code’s employment in that industry by national employment in it:
A building whose largest tenant is an IT firm and which stands in a ZIP code full of IT workers has a high SPEC. Because a high SPEC could simply reflect a neighborhood dominated by one industry, the regressions also control for the share of local employment in the anchor’s industry, \(E_{z(i),a(i),t}/E_{z(i),t}\).
42.1.3 Results
The outcomes are log price per square foot, log net operating income (NOI), and the cap rate, regressed on the measures above plus building controls (size, age, height, quality, green label), location controls, and year, REIT, and metropolitan-area fixed effects. In the working paper:
Both kinds of concentration raise value. A one-standard-deviation increase in neighborhood concentration goes with a 6.9% higher price and 4.8% higher NOI. The same increase in tenant concentration goes with an 8.6% higher price and 9.3% higher NOI. Cap-rate effects are weak.
Specialization beats concentration. When \(\text{HHI}^{\text{nbhd}}\) and SPEC enter the same regression, neighborhood concentration loses significance and SPEC survives, at about 8.2% on price and 6.9% on NOI per standard deviation. This horse race is the heart of the paper. Plain density of economic activity is not what tenants pay for. They pay to be near firms in their own industry, which is what knowledge spillovers predict.
Anchors matter. The premium rises with the share of space taken by the largest industry or the largest tenant, and is most precisely estimated for buildings occupied by a single industry or a single tenant.
42.1.4 The Stock-Market Test
Because the buyers and sellers are listed REITs, each transaction is also an event for a stock. The paper estimates abnormal returns with the Fama-French factors plus a REIT index and regresses the REIT’s cumulative abnormal return on the building’s measures. A one-standard-deviation higher tenant concentration in an acquired building goes with a 0.49% higher CAR over days \((0, +1)\), and the same difference in a sold building with a 0.47% lower CAR. SPEC adds about 0.15% for acquisitions. The acquisition effects last one trading day, while the penalty for selling a concentrated building persists for about a week.
42.1.5 From Working Paper to Journal Article
The changes between versions are a lesson in how such a paper is framed. The working-paper title described the method (“The Agglomerative Effects of Neighborhood and Building Specialization on Office Values”). The published title asks a yes/no question with a real tension behind it. In the working paper, the diversification argument appears only in the conclusion. In the published version it opens the abstract. And the result that was one subsection of the working paper, that the premium needs specialization at both levels at once, became the headline. The empirical design hardly changed; the argument around it did.
42.2 From Offices to Industrial Parks
The design needs three things: units that hold several tenants, a way to measure the industries of those tenants and of the surrounding area, and listed owners whose stock reacts when the tenant mix changes. In Vietnam the closest match is not the office market but industrial parks (khu công nghiệp).
Clustering is deliberate and large. Provinces and developers recruit anchor investors, and suppliers follow them. The electronics clusters that grew around Samsung’s plants in Bắc Ninh and Thái Nguyên are the best-known example.
Leases are long. Industrial land is leased for the park’s remaining term, often 40 to 50 years, and the rent is largely paid up front. A lease price is therefore close to a capitalized value, much like the transaction prices in the original paper.
The owners are listed. About a dozen developers trade on HOSE, HNX, and UPCoM, and they announce new tenants through exchange filings, press releases, and signing ceremonies.
Table 42.1 matches each part of the original design to its Vietnamese counterpart.
Table 42.1: Mapping the office design onto Vietnamese industrial parks
The same, using the anchor investor’s VSIC industry
Value outcome
Price, NOI, cap rate
Lease price per m² over the remaining term, occupancy, hectares absorbed
Market test
REIT CARs around acquisitions and sales
Developer CARs around lease announcements and sector shocks
Two parts transplant directly. The horse race between concentration and matched specialization works the same way, and so does the use of a listed owner’s stock price to see whether investors share the valuation. One part does not. Vietnam has no transaction database comparable to CoStar, so the building-level price regressions of Section 42.1.3 need a park-level panel that has to be built from broker reports and provincial records (Section 42.6). The worked example in this chapter therefore starts with the part that can be built from public sources today: the announcement event study.
Translated to this setting, the event study tests one prediction. If tenants pay for proximity to firms in their own industry, a developer’s stock should react more strongly when it signs a tenant from the industry its park is already built around. A signing that deepens the park’s cluster raises the expected rent on the rest of its land, while an unrelated tenant only brings the lease itself. Concentration risk pushes the other way, and Vietnam provides a clean test of that side as well: the US tariff announcements of 2025, which hit export-oriented electronics producers hardest.
42.3 Hand-Collected Lease Announcements
No database records industrial-park leases, so the events have to be collected by hand. The table below was compiled in October 2026 from developers’ own news archives, provincial government portals, and the Vietnamese business press, using these rules.
Developers. All listed park developers were searched: KBC, IDC, BCM, SZC, NTC, D2D, TIP, LHG, VGC, SIP, GVR, PHR, and SNZ. Verifiable events turned up for six of them.
Events. A developer or its subsidiary announces a land lease contract, a memorandum of understanding or agreement in principle, or a land handover with a named tenant in one of its parks, or the province awards that tenant an investment certificate for a project in the park. The window is 2012–2025.
Verification. Each row is confirmed on a dated page that names the tenant, and the page is linked in source_url. The date is the earliest public date found: the signing or ceremony date when the source gives one, otherwise the publication date (date_type records which).
Coding.hectares is filled in only when the source states the area. vsic2 is the VSIC 2018 division of the tenant’s main activity, and anchor_vsic2 is the division of the park’s dominant tenants before the deal, taken from the developer’s and the press’s descriptions of the park. It is left blank when no source names an anchor.
Exclusions. Unnamed tenants, deals without an exact date, leases between developers (such as a sister company’s sub-lease of a whole block), and ready-built factory leases outside the developers’ parks.
Follow-ups.followup flags later stages of a deal that was already public: Hanwha’s contract after its MOU, Amkor’s lease after its agreement in principle, and Foxconn’s investment certificate and lease filing at Quang Châu after the 2022 MOU. They are not news and are dropped from the event study.
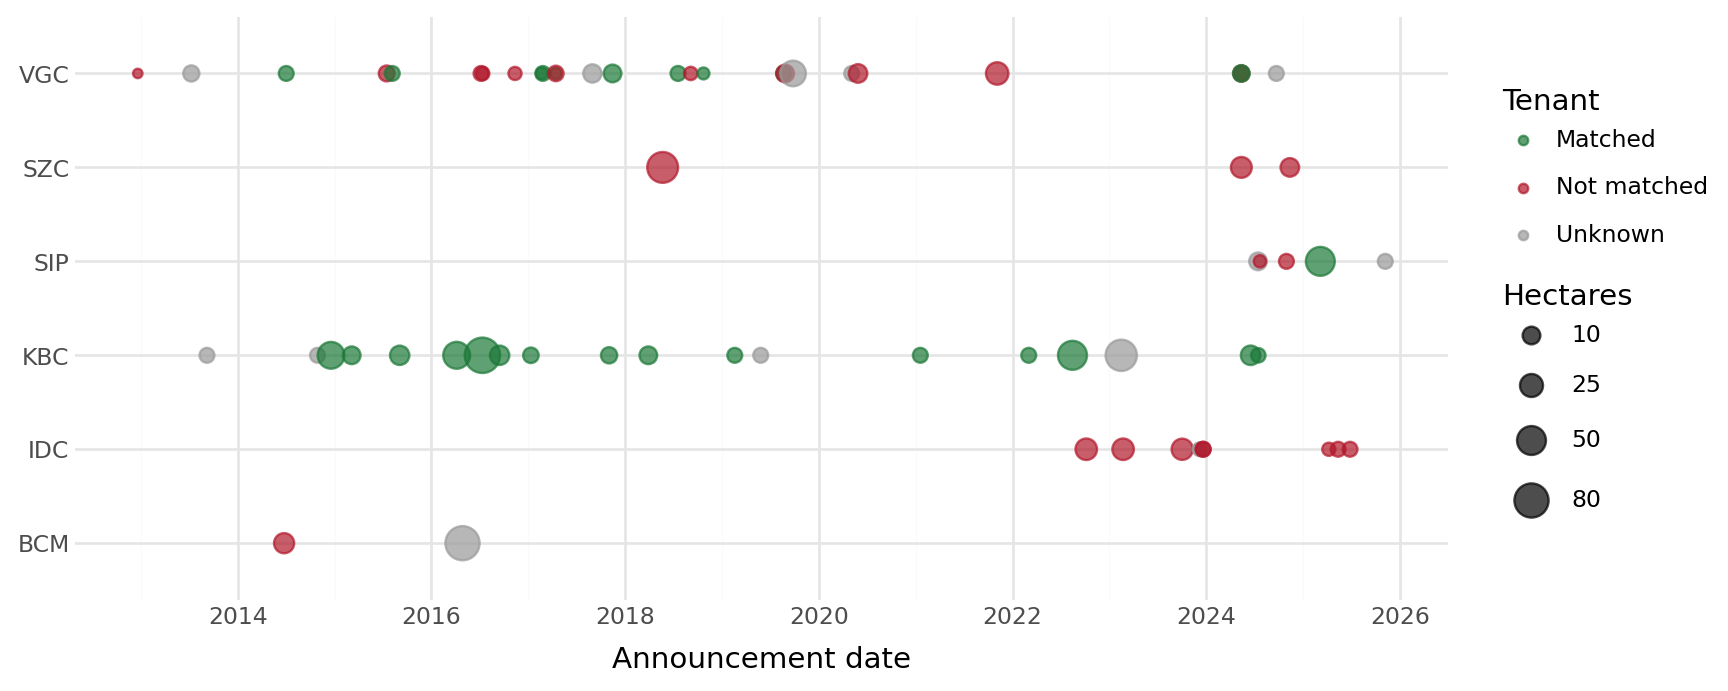
Hand-collected lease announcements by listed industrial park developers
Table 42.2: Lease announcements by developer, excluding follow-ups. Events count distinct announcement days. A deal is matched when the tenant’s VSIC division equals that of the park’s anchor before the deal. The electronics share is the share of stated hectares leased to VSIC 26–27 tenants.
Figure 42.1: Lease announcements by developer, excluding follow-ups. Marker size is the stated area (deals without one are drawn at 5 hectares).
Table 42.2 and Figure 42.1 show the feature of the data that shapes everything that follows: whether a deal is matched is almost a property of the developer. All of KBC’s coded deals are matched. Its parks in Bắc Ninh, Bắc Giang, and Hải Phòng were built around electronics (LG, Goertek, Luxshare, Foxconn), and it kept signing electronics tenants. None of IDICO’s, Sonadezi Châu Đức’s, or Becamex’s coded deals are matched; their parks sign a mix of food, materials, and engineering tenants. Only Viglacera, and to a small degree SIP, signs both kinds.
This matters for the test. A pooled comparison of matched and unmatched deals is mostly a comparison of KBC with IDICO, two developers that also differ in size, region, investor base, and the stage of their land banks. The within-developer comparison, the analog of the REIT fixed effects in Liu, Zheng, and Zhu (2026), is cleaner but rests almost entirely on Viglacera’s 22 coded deals. Both versions are reported in Section 42.5, and Section 42.4 shows what this structure does to inference.
Three limitations should be kept in mind.
Coverage is uneven. Developers publicize flagship deals, so the sample over-represents large, high-profile tenants. KBC’s archive thins out in 2019–2021 and 2024–2025, and several developers have no verifiable events. Exchange filings and annual reports, which were not searched systematically, are the next sources to add.
Some dates are publication dates. For rows with date_type equal to news or press_release, the deal may have been known a few days earlier. The pre-event window in Section 42.5 checks for this.
Not every event is tradable. Events dated before a developer’s shares began trading drop out of the event study automatically. Check each developer’s listing history, as in the survivorship chapter.
42.4 How Much Can These Announcements Detect?
Before running the event study, it helps to know what size of effect is plausible and what size the sample can detect.
A rough upper bound. Take a 25-hectare lease at USD 130 per m² over the remaining term, about the average tier-1 asking rent in northern Vietnam in 2024. That is 250,000 m² and about USD 32 million of revenue. If half of it is profit, a fully unanticipated deal adds about USD 16 million of value, or 1.6% for a developer worth USD 1 billion. Most deals are partly anticipated, because developers guide investors on their pipelines and many announcements follow an earlier MOU. A direct effect of one to two percent is therefore an upper bound for a large deal. The agglomeration channel is different. If a matched anchor raises the expected rent on the rest of the park’s unleased land, the value effect can exceed the deal itself. That is the effect the test is looking for.
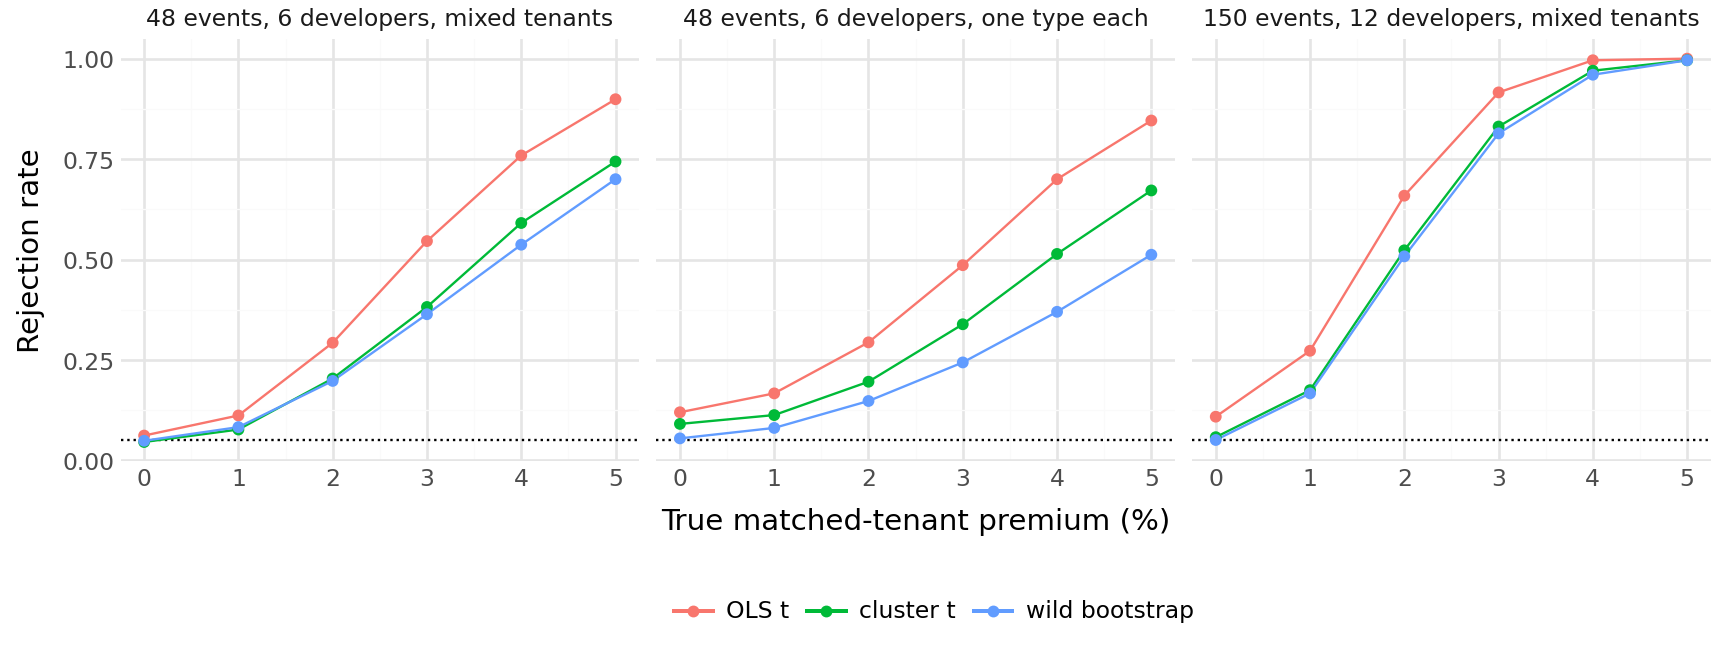
Inference with few developers. The collected sample has 48 events with a known match status, spread over six developers. Two features of such data make standard errors fragile. Events by the same developer share a common component, for instance how much of its pipeline the market already expects. And, as Table 42.2 shows, most developers sign mostly one type of tenant, so MATCH barely varies within developer. The simulation below generates two-day CARs as
with an event-level standard deviation of 4.5%, roughly that of a two-day return for a mid-cap developer, and a developer-level shock \(u_d\) with a standard deviation of 2%. It compares three tests of \(\delta = 0\): the classical OLS \(t\)-test, a cluster-robust \(t\)-test with \(G-1\) degrees of freedom, and a wild cluster bootstrap with the null imposed and Webb’s six-point weights, which is designed for few clusters. The three scenarios are the collected sample size with tenant types mixed within each developer, the same size with each developer signing mostly one type (as in the collected data), and a sample three times larger.
Cluster-robust t-statistics and the wild cluster bootstrap
from scipy import statsdef cluster_t(X, Y, g, j=1):"""Cluster-robust (CR1) t-statistics of coefficient j, one per column of Y. X is (n, k) with the tested regressor in column j, Y is (n, B), and g holds cluster codes 0, ..., G-1. """ n, k = X.shape G = g.max() +1 XtX_inv = np.linalg.inv(X.T @ X) beta = XtX_inv @ X.T @ Y resid = Y - X @ beta S = np.zeros((G, k, Y.shape[1]))for c inrange(k): np.add.at(S[:, c, :], g, X[:, [c]] * resid) meat = np.einsum("gkb,glb->klb", S, S) scale = G / (G -1) * (n -1) / (n - k) var = scale * np.einsum("k,klb,l->b", XtX_inv[j], meat, XtX_inv[j])return beta[j] / np.sqrt(var)WEBB = np.array([-np.sqrt(1.5), -1, -np.sqrt(0.5), np.sqrt(0.5), 1, np.sqrt(1.5)])def wild_cluster_p(X, y, g, j=1, n_boot=999, rng=None):"""Wild cluster bootstrap-t p-value for H0: beta_j = 0, with the null imposed and Webb's six-point weights, which behave well with few clusters. Returns the p-value and the original cluster-robust t-statistic.""" rng = np.random.default_rng(rng) t0 = cluster_t(X, y[:, None], g, j)[0] Xr = np.delete(X, j, axis=1) fit_r = Xr @ np.linalg.lstsq(Xr, y, rcond=None)[0] w = rng.choice(WEBB, size=(g.max() +1, n_boot)) y_star = fit_r[:, None] + (y - fit_r)[:, None] * w[g] t_star = cluster_t(X, y_star, g, j)return np.mean(np.abs(t_star) >=abs(t0)), t0
Size and power of three tests of the matched-tenant premium
def simulate_match_tests(effect, n_events, n_dev, sd_dev, mix, sd_event=0.045, n_sims=1000, n_boot=199, seed=0):"""Rejection rates (two-sided, 5%) of three tests of the matched-tenant premium when announcements cluster within a few developers. CAR_e = effect * match_e + u_dev(e) + eps_e Each developer has its own share of matched deals, drawn from a Beta(mix, mix) distribution: a small `mix` makes most developers sign only one type of tenant. The developer shock u_d (say, how well its announcements are anticipated) does not average out across its events. """ rng = np.random.default_rng(seed) rej = np.zeros(3)for _ inrange(n_sims): dev = rng.integers(0, n_dev, n_events) match = (rng.random(n_events) < rng.beta(mix, mix, n_dev)[dev]).astype(float)if match.min() == match.max():continue car = (effect * match + rng.normal(0, sd_dev, n_dev)[dev]+ rng.normal(0, sd_event, n_events)) g = np.unique(dev, return_inverse=True)[1] G = g.max() +1 X = np.column_stack([np.ones(n_events), match]) fit = stats.linregress(match, car) p_wild, t_cl = wild_cluster_p(X, car, g, n_boot=n_boot, rng=rng) rej += [abs(fit.slope / fit.stderr) > stats.t.ppf(0.975, n_events -2),abs(t_cl) > stats.t.ppf(0.975, G -1), p_wild <0.05]return rej / n_simsscenarios = {"48 events, 6 developers, mixed tenants": (48, 6, 2.0),"48 events, 6 developers, one type each": (48, 6, 0.3),"150 events, 12 developers, mixed tenants": (150, 12, 2.0)}rows = []for name, (n_events, n_dev, mix) in scenarios.items():for effect in [0.0, 0.01, 0.02, 0.03, 0.04, 0.05]: r = simulate_match_tests(effect, n_events, n_dev, sd_dev=0.02, mix=mix) rows.append({"scenario": name, "effect": effect,"OLS t": r[0], "cluster t": r[1], "wild bootstrap": r[2]})power = pd.DataFrame(rows)print(power.set_index(["scenario", "effect"]).round(3).to_string())
Figure 42.2: Rejection rates of three tests of the matched-tenant premium at the 5% level. At a true effect of zero the curves show the test’s size; the dotted line marks 5%. Each scenario is 1,000 simulated samples.
When each developer signs one type of tenant, only the wild bootstrap holds its size. The classical \(t\)-test rejects a true null 12% of the time, because it treats a developer’s announcements as independent observations. The cluster-robust \(t\)-test does better but still rejects 9% of the time, because six clusters are too few for it. The wild bootstrap rejects at 5.5%.
With 48 events, only very large effects are detectable. At a true premium of 5 percentage points, the wild bootstrap rejects 70% of the time when tenant types are mixed and about half the time when they are not. A premium of the size Liu, Zheng, and Zhu (2026) report for US REITs (well under 1% per standard deviation) would be invisible.
More events, from more developers, help most. With 150 events from 12 developers, power reaches 80% at a premium of about 3 percentage points. Extending the hand collection, to exchange filings, to developers without events so far, and to smaller deals, is the most valuable next step.
42.5 Application to Vietnamese Data
The code below runs the two tests on DataCore prices with the pipeline from the event-study chapter: EventStudyConfig, run_event_study, and the functions it calls. It assumes ip_events from Section 42.3 and the inference functions above.
Lease announcements. Several deals signed at one ceremony are one event. Announcements by the same developer within ten days of each other are flagged, because their windows overlap. Abnormal returns come from the market model (VN-Index, estimation window of 150 days ending 15 days before the event). The test regresses CARs on MATCH with developer fixed effects, so the comparison is within developer: is the same developer’s stock rewarded more for a matched tenant than for an unmatched one? Log hectares control for deal size. Inference uses the wild cluster bootstrap. A “clean” sample drops overlapping events and events with a price-limit hit on day 0 or +1 (Section 38.8 explains why limit hits push price discovery into later days).
The 2025 tariff shock. On 3 April 2025 (Vietnam time) the United States announced a 46% tariff on Vietnamese goods. It paused the tariff on 9 April (10 April in Vietnam), and on 2 July (3 July in Vietnam) announced a deal at 20%, with 40% on transshipped goods. All developers share each date, so this is a cross-sectional test: regress each developer’s CAR on its exposure, the share of its collected leased hectares that went to electronics tenants (VSIC 26–27). Concentration risk predicts a negative slope on the announcement and positive slopes on the pause and the deal. The first window runs to day +3, because many stocks closed at their floor price for several sessions after the announcement.
Lease announcements and the 2025 tariff shock on DataCore data
import statsmodels.formula.api as smffrom datacore import DataCoreClientclient = DataCoreClient()# All listed IP developers, including those without a collected event: the# tariff test uses the whole cross-sectiondevelopers =sorted(set(ip_events["ticker"]) | {"KBC", "IDC", "SZC", "BCM", "SIP","GVR", "PHR", "NTC", "D2D", "LHG","TIP", "VGC", "SNZ"})daily = client.get_daily_prices( exchanges=["HOSE", "HNX", "UPCoM"], start_date="2011-01-01", end_date="2025-12-31", include_delisted=True, fields=["ticker", "date", "exchange", "adjusted_close", "volume","market_cap", "limit_up_hit", "limit_down_hit"])daily["date"] = pd.to_datetime(daily["date"])daily = (daily[daily["ticker"].isin(developers)] .rename(columns={"ticker": "symbol"}) .sort_values(["symbol", "date"]).reset_index(drop=True))daily["ret"] = daily.groupby("symbol")["adjusted_close"].pct_change()vn = client.get_index_returns(index="VNINDEX", frequency="daily", start_date="2011-01-01", end_date="2025-12-31")vn["date"] = pd.to_datetime(vn["date"])# Market model on raw returns; the intercept absorbs the risk-free ratefactors = vn[["date"]].assign(mkt_excess=vn["return"])config = EventStudyConfig(estimation_window=150, gap=15, event_window_start=-5, event_window_end=5, min_estimation_obs=100, risk_model=RiskModel.MARKET_MODEL)windows = {"car_m5_m1": (-5, -1), "car_0_p1": (0, 1),"car_m1_p1": (-1, 1), "car_0_p5": (0, 5)}def event_cars(events):"""Run the chapter's pipeline and return one row per event with CARs over each window and a flag for price-limit hits on days 0 and +1.""" res = run_event_study(events, daily[["symbol", "date", "ret"]], factors, config, verbose=False) d = res["daily_ar"] cars = pd.concat( [d[d["evttime"].between(lo, hi)].groupby(["symbol", "evtdate"])["AR"] .sum().rename(name) for name, (lo, hi) in windows.items()], axis=1).reset_index() hits = (d[d["evttime"].between(0, 1)] .merge(daily[["symbol", "date", "limit_up_hit", "limit_down_hit"]], on=["symbol", "date"], how="left")) hits["hit"] = hits["limit_up_hit"].fillna(False) | hits["limit_down_hit"].fillna(False)return cars.merge(hits.groupby(["symbol", "evtdate"])["hit"].any() .rename("limit_hit").reset_index(), on=["symbol", "evtdate"])# --- 1. Lease announcements: matched versus other tenants -------------------# Later stages of a deal already announced are not news. Several deals signed# at one ceremony are one event for the developer's stockev = (ip_events[ip_events["followup"] ==0].dropna(subset=["match"]) .groupby(["ticker", "announce_date"]) .agg(match=("match", "max"), hectares=("hectares", lambda x: x.sum(min_count=1)), n_deals=("tenant", "size")) .reset_index() .rename(columns={"ticker": "symbol", "announce_date": "event_date"}))# Another announcement by the same developer within 10 days contaminates bothgap = ev.sort_values("event_date").groupby("symbol")["event_date"].diff().dt.daysgap_next = ev.sort_values("event_date").groupby("symbol")["event_date"].diff(-1).dt.days.abs()ev["overlap"] = (gap.le(10) | gap_next.le(10)).reindex(ev.index).fillna(False)cars = event_cars(ev[["symbol", "event_date"]])# The pipeline moves event dates to the next trading day; recover each# event's attributes from the latest original date on or before itcars = pd.merge_asof(cars.sort_values("evtdate"), ev.sort_values("event_date"), left_on="evtdate", right_on="event_date", by="symbol", direction="backward")cars["log_ha"] = np.log1p(cars["hectares"].fillna(cars["hectares"].median()))cars["year"] = cars["evtdate"].dt.yearprint(cars.groupby("match")[list(windows)].agg(["mean", "count"]).round(4))rows = []for sample, x in [("all", cars), ("clean", cars[~cars["overlap"] &~cars["limit_hit"]])]:for y in windows: sub = x.dropna(subset=[y]).reset_index(drop=True) g = sub["symbol"].astype("category").cat.codes.to_numpy()for spec in ["pooled", "within"]: X = pd.concat([pd.Series(1.0, index=sub.index, name="const"), sub["match"].astype(float), sub["log_ha"]], axis=1)if spec =="within":# Developer fixed effects: is the same developer's stock rewarded# more for a matched tenant than for an unmatched one? X = pd.concat([X, pd.get_dummies(sub["symbol"], drop_first=True, dtype=float)], axis=1) beta = np.linalg.lstsq(X.to_numpy(), sub[y].to_numpy(), rcond=None)[0] p_wild, t_cl = wild_cluster_p(X.to_numpy(), sub[y].to_numpy(), g, j=1, n_boot=1999, rng=1) rows.append({"sample": sample, "window": y, "spec": spec,"N": len(sub), "developers": g.max() +1,"match_premium": beta[1], "t_cluster": t_cl,"p_wild": p_wild})print(pd.DataFrame(rows).round(4).to_string(index=False))# --- 2. The 2025 US tariff shock: concentration risk --------------------------# Exposure: the share of each developer's leased hectares (deals announced# before the shock) that went to electronics tenants (VSIC 26-27), the sector# most exposed to US demandbase = ip_events[(ip_events["announce_date"] <"2025-04-01")& (ip_events["followup"] ==0)].dropna(subset=["hectares"])exposure = (base.assign(elec_ha=base["hectares"] * base["vsic2"].isin([26, 27])) .groupby("ticker")[["elec_ha", "hectares"]].sum() .eval("elec_ha / hectares").rename("exposure"))shocks = {"46% tariff announced": ("2025-04-03", (0, 3)),"90-day pause": ("2025-04-10", (0, 1)),"20% deal": ("2025-07-03", (0, 1))}for label, (day, (lo, hi)) in shocks.items(): windows["car_shock"] = (lo, hi) sh = event_cars(pd.DataFrame({"symbol": developers,"event_date": pd.Timestamp(day)})) sh = sh.merge(exposure, left_on="symbol", right_index=True, how="inner") fit = smf.ols("car_shock ~ exposure", data=sh).fit(cov_type="HC1")print(f"{label:22s} N={len(sh):2d} slope={fit.params['exposure']:.4f} "f"(HC1 t={fit.tvalues['exposure']:.2f}) "f"limit hits={int(sh['limit_hit'].sum())}")del windows["car_shock"]
We tested the code on synthetic prices shaped like the DataCore tables, using the actual dates of the collected events. Matched deals carried a planted day-0 abnormal return of 3% and other deals 0.5%, and the tariff dates carried planted effects of \(-8\%\), \(+4\%\), and \(+3\%\) times exposure. With low idiosyncratic noise the code recovered all of them: a matched premium of 2.5 to 2.7 percentage points across windows and specifications, and exposure slopes of \(-0.085\), \(0.037\), and \(0.031\). With realistic noise of 2.5% a day, the same planted premium was not significant in the within-developer specification (wild bootstrap \(p\)-values between 0.13 and 0.40 in the event windows), as Section 42.4 predicts for six developers. Only the six developers with collected deals have an exposure measure, so the tariff regressions have six observations. Read the output in this order:
The \((0,+1)\) match premium in the clean sample, within developer, is the main estimate. Judge it by the wild bootstrap \(p\)-value, not by the cluster-robust \(t\). If the pooled estimate is much larger than the within estimate, the pooled premium mostly reflects the difference between KBC and the other developers.
The pre-event window \((-5,-1)\) is a leakage check. A positive premium there means matched deals were known before the date used, so move the date earlier or widen the window.
The \((0,+5)\) window shows whether price limits and thin trading delayed the reaction.
The tariff slopes test concentration risk. With six developers, read their signs and the pattern across the three dates, not their individual significance.
42.6 Extensions
The event study tests whether investors expect clustering to pay. Testing whether it does pay, as Liu, Zheng, and Zhu (2026) do with prices and NOI, needs a park-level panel. Three extensions build it.
A park panel. For each park and year, compute the investor HHI (Equation 42.2 with leased hectares), the anchor’s share of leased land, and SPEC (Equation 42.3) with employment from the GSO Enterprise Survey, using the province or a radius of about 25 km around the park as the neighborhood. Then regress lease prices, occupancy, and hectares absorbed on these measures with year, developer, and province fixed effects, and run the paper’s horse race between regional concentration and SPEC. Lease prices are reported mostly by brokers as asking rents by province and tier, so occupancy and absorption will often be the better-measured outcomes. Freeze locations on pre-2025 province codes: on 1 July 2025 Vietnam merged its 63 provinces into 34 and abolished the district level.
Anchor arrivals. The arrival of a large anchor is a staggered treatment. Comparing rents and absorption in parks, and in neighboring parks, before and after an anchor signs, against parks matched on province and age, estimates spillovers directly. This is the logic of Greenstone, Hornbeck, and Moretti (2010), who compare counties that won a large plant with the runners-up, and the staggered timing calls for an estimator such as Callaway and Sant’Anna (2021). The original paper, with its cross-section of transactions, could not run this test.
Which mechanism.Liu, Zheng, and Zhu (2026) attribute their premium to knowledge spillovers, which are strongest within an industry. In Vietnam’s parks, input sharing may matter more: suppliers locate next to the assembler they sell to. Ellison, Glaeser, and Kerr (2010) separate the channels by asking which industry pairs co-locate. Here the analog is to add a measure of how much of the anchor’s inputs the region already produces, built from the GSO input-output table. A premium that loads on supplier links rather than on the same industry would point to input sharing.
42.7 Summary
Liu, Zheng, and Zhu (2026) find that office values rise with agglomeration only when a building’s tenants and its neighborhood specialize in the same industry, and that REIT investors price this in. The horse race between concentration and matched specialization is what identifies the mechanism.
In Vietnam, industrial parks are the natural setting, and listed developers’ lease announcements are the natural events. Section 42.3 presents 71 hand-collected announcements by six developers, with sources.
In these data, whether a deal is matched is almost a property of the developer: KBC signs electronics tenants into electronics parks, IDICO signs a mix. The within-developer test rests largely on Viglacera.
With six developers, only the wild cluster bootstrap gives reliable inference, and only large effects are detectable. Collecting more events matters more than refining the test.
The 2025 US tariff announcements give a rare outside shock to test the other side of the trade-off: the risk of a concentrated tenant base.
Callaway, Brantly, and Pedro H. C. Sant’Anna. 2021. “Difference-in-Differences with Multiple Time Periods.”Journal of Econometrics 225 (2): 200–230. https://doi.org/10.1016/j.jeconom.2020.12.001.
Ellison, Glenn, Edward L. Glaeser, and William R. Kerr. 2010. “What Causes Industry Agglomeration? Evidence from Coagglomeration Patterns.”American Economic Review 100 (3): 1195–1213. https://doi.org/10.1257/aer.100.3.1195.
Greenstone, Michael, Richard Hornbeck, and Enrico Moretti. 2010. “Identifying Agglomeration Spillovers: Evidence from Winners and Losers of Large Plant Openings.”Journal of Political Economy 118 (3): 536–98. https://doi.org/10.1086/653714.
Liu, Crocker H., Stuart S. Rosenthal, and William C. Strange. 2018. “The Vertical City: Rent Gradients, Spatial Structure, and Agglomeration Economies.”Journal of Urban Economics 106: 101–22. https://doi.org/10.1016/j.jue.2018.04.001.
Rosenthal, Stuart S., and William C. Strange. 2004. “Evidence on the Nature and Sources of Agglomeration Economies.” In Handbook of Regional and Urban Economics, edited by J. Vernon Henderson and Jacques-François Thisse, 4:2119–71. Elsevier. https://doi.org/10.1016/S1574-0080(04)80006-3.
Source Code
# Industrial Park Anchors and Developer Value {#sec-ipa}Does it pay to fill a property with tenants from one industry? Urban economics says clustering makes firms more productive: they share suppliers, draw on a common pool of skilled workers, and learn from each other [@rosenthal2004evidence]. If tenants value that, they should pay more rent to be near firms like themselves, and the owner of the property should capture part of the gain. Portfolio logic says the opposite. A landlord whose tenants all work in one industry has concentrated its exposure, and one bad year for that industry hits the whole rent roll at once.@liu2026agglomeration take this trade-off to US office buildings, and their answer is that clustering raises value only in one configuration: when a building's tenants and its surrounding neighborhood both specialize in the *same* industry. They also show that the stock market agrees. REITs earn positive abnormal returns when they buy specialized buildings and negative ones when they sell them.This chapter does two things with the paper:1. @sec-ipa-paper lays out its design and results, and what changed between the working paper and the published version.2. @sec-ipa-vietnam onward turns it into a worked example for Vietnam. The setting changes from office buildings to industrial parks, and the market test changes from REIT trades to lease announcements by listed park developers. @sec-ipa-events presents a hand-collected set of announcements, @sec-ipa-power asks how large an effect they can detect, and @sec-ipa-application runs the event study with the pipeline from the [event-study chapter](60_event_studies.qmd).::: {.callout-note title="Sources used in this chapter"}The paper is @liu2026agglomeration, *Management Science* 72(10), 8366--8393. The published PDF sits behind a bot check, so the design details and coefficient magnitudes below come from the February 2022 working paper, "The Agglomerative Effects of Neighborhood and Building Specialization on Office Values," presented at the European Real Estate Society conference. The question, the trade-off, and the headline result are quoted from the published abstract. Some magnitudes may have changed between versions.:::## The Paper {#sec-ipa-paper}### Question and Trade-Off {#sec-ipa-question}The published abstract opens with the trade-off: agglomeration within a building or neighborhood brings higher tenant productivity, at the cost of a more concentrated tenant base. Which effect dominates is an empirical question. Earlier work on office rents had found a positive link between clustering and rents, but with averaged rents or averaged measures of clustering, so it could not separate building quality from location [@liu2026agglomeration]. Two features set this paper apart. It measures clustering at two levels, around the building (the "horizontal" dimension) and inside it (the "vertical" dimension, following the evidence that agglomeration operates within buildings and even across floors [@liu2018vertical]). And it links the two levels by asking whether the building's main tenant works in the industry its neighborhood specializes in.### Data and Measures {#sec-ipa-measures}The working-paper sample is 457 office buildings bought or sold by 57 US REITs between 2014 and 2020, with 5,396 tenants hand-collected from CoStar. Neighborhoods are 5-digit ZIP codes, and their industry mix comes from the Census ZIP Code Business Patterns at the 2-digit NAICS level. The paper builds three measures.**Neighborhood concentration** is a Herfindahl index of employment shares across industries $k$ in the ZIP code of building $i$:$$\text{HHI}^{\text{nbhd}}_{i,t} = \sum_{k} \left(\frac{E_{z(i),k,t}}{E_{z(i),t}}\right)^2 .$$ {#eq-ipa-hhi-nbhd}**Tenant concentration** is the same index computed over the industries of the building's tenants, weighted by the floor space each one leases:$$\text{HHI}^{\text{tenant}}_{i,t} = \sum_{l} \left(\frac{A_{i,l,t}}{A_{i,t}}\right)^2 .$$ {#eq-ipa-hhi-tenant}**Building-neighborhood specialization** is the key measure. Find the industry $a(i)$ of the building's largest tenant, and divide the ZIP code's employment in that industry by national employment in it:$$\text{SPEC}_{i,t} = \frac{E_{z(i),a(i),t}}{E_{a(i),t}} .$$ {#eq-ipa-spec}A building whose largest tenant is an IT firm and which stands in a ZIP code full of IT workers has a high SPEC. Because a high SPEC could simply reflect a neighborhood dominated by one industry, the regressions also control for the share of local employment in the anchor's industry, $E_{z(i),a(i),t}/E_{z(i),t}$.### Results {#sec-ipa-results}The outcomes are log price per square foot, log net operating income (NOI), and the cap rate, regressed on the measures above plus building controls (size, age, height, quality, green label), location controls, and year, REIT, and metropolitan-area fixed effects. In the working paper:- **Both kinds of concentration raise value.** A one-standard-deviation increase in neighborhood concentration goes with a 6.9% higher price and 4.8% higher NOI. The same increase in tenant concentration goes with an 8.6% higher price and 9.3% higher NOI. Cap-rate effects are weak.- **Specialization beats concentration.** When $\text{HHI}^{\text{nbhd}}$ and SPEC enter the same regression, neighborhood concentration loses significance and SPEC survives, at about 8.2% on price and 6.9% on NOI per standard deviation. This horse race is the heart of the paper. Plain density of economic activity is not what tenants pay for. They pay to be near firms in their own industry, which is what knowledge spillovers predict.- **Anchors matter.** The premium rises with the share of space taken by the largest industry or the largest tenant, and is most precisely estimated for buildings occupied by a single industry or a single tenant.### The Stock-Market Test {#sec-ipa-market}Because the buyers and sellers are listed REITs, each transaction is also an event for a stock. The paper estimates abnormal returns with the Fama-French factors plus a REIT index and regresses the REIT's cumulative abnormal return on the building's measures. A one-standard-deviation higher tenant concentration in an acquired building goes with a 0.49% higher CAR over days $(0, +1)$, and the same difference in a sold building with a 0.47% lower CAR. SPEC adds about 0.15% for acquisitions. The acquisition effects last one trading day, while the penalty for selling a concentrated building persists for about a week.### From Working Paper to Journal Article {#sec-ipa-writing}The changes between versions are a lesson in how such a paper is framed. The working-paper title described the method ("The Agglomerative Effects of Neighborhood and Building Specialization on Office Values"). The published title asks a yes/no question with a real tension behind it. In the working paper, the diversification argument appears only in the conclusion. In the published version it opens the abstract. And the result that was one subsection of the working paper, that the premium needs specialization at both levels at once, became the headline. The empirical design hardly changed; the argument around it did.## From Offices to Industrial Parks {#sec-ipa-vietnam}The design needs three things: units that hold several tenants, a way to measure the industries of those tenants and of the surrounding area, and listed owners whose stock reacts when the tenant mix changes. In Vietnam the closest match is not the office market but industrial parks (*khu công nghiệp*).- **Clustering is deliberate and large.** Provinces and developers recruit anchor investors, and suppliers follow them. The electronics clusters that grew around Samsung's plants in Bắc Ninh and Thái Nguyên are the best-known example.- **Leases are long.** Industrial land is leased for the park's remaining term, often 40 to 50 years, and the rent is largely paid up front. A lease price is therefore close to a capitalized value, much like the transaction prices in the original paper.- **The owners are listed.** About a dozen developers trade on HOSE, HNX, and UPCoM, and they announce new tenants through exchange filings, press releases, and signing ceremonies.@tbl-ipa-mapping matches each part of the original design to its Vietnamese counterpart.| Element | @liu2026agglomeration (US offices) | Vietnam (industrial parks) ||----|----|----|| Unit | Office building traded by a REIT | Industrial park; each lease announcement by its listed developer || Tenants | CoStar tenant rosters | Investor projects in each park, from developers and provincial IP management boards || Concentration inside | HHI of tenant industries by floor space | HHI of investor industries by leased hectares || Surrounding area | 5-digit ZIP code, Census ZIP Business Patterns | Province on pre-2025 boundaries or a radius around the park, GSO Enterprise Survey || Match measure | SPEC, @eq-ipa-spec | The same, using the anchor investor's VSIC industry || Value outcome | Price, NOI, cap rate | Lease price per m² over the remaining term, occupancy, hectares absorbed || Market test | REIT CARs around acquisitions and sales | Developer CARs around lease announcements and sector shocks |: Mapping the office design onto Vietnamese industrial parks {#tbl-ipa-mapping}Two parts transplant directly. The horse race between concentration and matched specialization works the same way, and so does the use of a listed owner's stock price to see whether investors share the valuation. One part does not. Vietnam has no transaction database comparable to CoStar, so the building-level price regressions of @sec-ipa-results need a park-level panel that has to be built from broker reports and provincial records (@sec-ipa-extensions). The worked example in this chapter therefore starts with the part that can be built from public sources today: the announcement event study.Translated to this setting, the event study tests one prediction. **If tenants pay for proximity to firms in their own industry, a developer's stock should react more strongly when it signs a tenant from the industry its park is already built around.** A signing that deepens the park's cluster raises the expected rent on the rest of its land, while an unrelated tenant only brings the lease itself. Concentration risk pushes the other way, and Vietnam provides a clean test of that side as well: the US tariff announcements of 2025, which hit export-oriented electronics producers hardest.## Hand-Collected Lease Announcements {#sec-ipa-events}No database records industrial-park leases, so the events have to be collected by hand. The table below was compiled in October 2026 from developers' own news archives, provincial government portals, and the Vietnamese business press, using these rules.- **Developers.** All listed park developers were searched: KBC, IDC, BCM, SZC, NTC, D2D, TIP, LHG, VGC, SIP, GVR, PHR, and SNZ. Verifiable events turned up for six of them.- **Events.** A developer or its subsidiary announces a land lease contract, a memorandum of understanding or agreement in principle, or a land handover with a *named* tenant in one of its parks, or the province awards that tenant an investment certificate for a project in the park. The window is 2012--2025.- **Verification.** Each row is confirmed on a dated page that names the tenant, and the page is linked in `source_url`. The date is the earliest public date found: the signing or ceremony date when the source gives one, otherwise the publication date (`date_type` records which).- **Coding.** `hectares` is filled in only when the source states the area. `vsic2` is the VSIC 2018 division of the tenant's main activity, and `anchor_vsic2` is the division of the park's dominant tenants *before* the deal, taken from the developer's and the press's descriptions of the park. It is left blank when no source names an anchor.- **Exclusions.** Unnamed tenants, deals without an exact date, leases between developers (such as a sister company's sub-lease of a whole block), and ready-built factory leases outside the developers' parks.- **Follow-ups.** `followup` flags later stages of a deal that was already public: Hanwha's contract after its MOU, Amkor's lease after its agreement in principle, and Foxconn's investment certificate and lease filing at Quang Châu after the 2022 MOU. They are not news and are dropped from the event study.```{python}#| label: ipa-events#| code-summary: "Hand-collected lease announcements by listed industrial park developers"import ioimport numpy as npimport pandas as pdip_events = pd.read_csv(io.StringIO("""ticker,announce_date,date_type,deal_type,tenant,industry,vsic2,hectares,park,province,anchor_vsic2,followup,source_urlBCM,2014-06-24,signing_ceremony,lease_contract,Kingtec Group,LED lights and table/wall lamps,27,16,Mỹ Phước 3,Bình Dương,22,0,https://en.vietstock.vn/2014/06/kingtec-invests-us$30-million-in-binh-duong-38-179364.htmBCM,2016-04-27,signing_ceremony,mou,DDK Vietnam,bicycles and bicycle parts (specialised sub-zone),30,80,Bàu Bàng mở rộng,Bình Dương,,0,https://tuoitre.vn/saigontimes/binh-duong-mo-rong-kcn-bau-bang-them-1-000-ha/IDC,2022-10-06,signing_ceremony,lease_contract,Phu My Super White Float Glass Co. Ltd (PFG; Viglacera subsidiary),super-white float glass,23,20,Phú Mỹ II mở rộng,Bà Rịa-Vũng Tàu,24,0,https://idico.com.vn/en/tin-tuc/idico-ky-hop-dong-voi-cong-ty-kinh-phu-myIDC,2023-02-22,signing_ceremony,lease_contract,Suntory PepsiCo Vietnam Beverage Co. Ltd,beverages and dairy,11,20,Hựu Thạnh,Long An,52,0,https://idico.com.vn/vi/tin-tuc/suntory-pepsico-huuthanhIDC,2023-10-03,news,investment_certificate,Hyosung Vietnam Co. Ltd,carbon fibre,20,19.2,Phú Mỹ II,Bà Rịa-Vũng Tàu,24,0,https://theinvestor.vn/ba-ria-vung-tau-province-okays-540-mln-hyosung-carbon-fiber-factory-d6855.htmlIDC,2023-12-08,press_release,investment_certificate,J&W Vietnam (mechanical tools factory),air compressors and power tools,28,3.71,Cầu Nghìn,Thái Bình,,0,https://idico.com.vn/vi/tin-tuc/idico-ban-giao-giay-chung-nhan-dau-tu-cho-cac-du-an-dau-tu-fdi-tai-thai-binhIDC,2023-12-08,press_release,investment_certificate,WEISHENG Vietnam (industrial tools factory),industrial tools,25,2.65,Cầu Nghìn,Thái Bình,,0,https://idico.com.vn/vi/tin-tuc/idico-ban-giao-giay-chung-nhan-dau-tu-cho-cac-du-an-dau-tu-fdi-tai-thai-binhIDC,2023-12-08,press_release,investment_certificate,XINGYU Vietnam (pump factory),pumps,28,1.80,Cầu Nghìn,Thái Bình,,0,https://idico.com.vn/vi/tin-tuc/idico-ban-giao-giay-chung-nhan-dau-tu-cho-cac-du-an-dau-tu-fdi-tai-thai-binhIDC,2023-12-21,signing_ceremony,lease_contract,Cynthia International Co. Ltd (Liancheng Vietnam Electronics Technology),metal/plastic electronic components (connectors),26,,Hựu Thạnh,Long An,52,0,https://idico.com.vn/vi/tin-tuc/idico-ky-hop-dong-voi-cac-nha-dau-tu-trung-quocIDC,2023-12-21,signing_ceremony,lease_contract,Miracle Pharm Pte. Ltd. (Viet Thanh Biotechnology Co. Ltd),biotech and veterinary medicine,21,,Hựu Thạnh,Long An,52,0,https://idico.com.vn/vi/tin-tuc/idico-ky-hop-dong-voi-cac-nha-dau-tu-trung-quocIDC,2025-04-08,signing_ceremony,mou,Topsun Logistics Equipment Industrial Co. Ltd,cargo lashing straps / winches / racks / chains,25,3,Phú Mỹ II,Bà Rịa-Vũng Tàu,24,0,https://idico.com.vn/vi/tin-tuc/su-kien-dinh-cua-nha-dau-tu-trong-boi-canh-thi-truong-nhieu-bien-dongIDC,2025-05-13,signing_ceremony,lease_contract,Advanced Materials Zili Vietnam Co. Ltd (Zili Group),corundum refractory materials,23,,Phú Mỹ II,Bà Rịa-Vũng Tàu,24,0,https://idico.com.vn/vi/tin-tuc/ky-ket-cong-ty-advanced-materials-zili-tu-singapore-chinh-thuc-dau-tu-vao-he-sinh-thai-cong-nghiep-idicoIDC,2025-06-27,signing_ceremony,lease_contract,Vifon Long An Co. Ltd,instant / rice-based processed food,10,,Hựu Thạnh,Long An,52,0,https://www.idico.com.vn/vi/tin-tuc/vifon-dau-tu-nha-may-che-bien-thuc-pham-tai-khu-cong-nghiep-idico-huu-thanhKBC,2013-09-06,signing_ceremony,investment_certificate,LG Electronics,consumer electronics,26,,Tràng Duệ,Hải Phòng,,0,https://kinhbaccity.vn/en/402-lg-electronics-inc-chinh-thuc-duoc-thanh-pho-hai-phong-cap-giay-chung-nhan-dau-tu-vao-khu-trang-due-thuoc-khu-kinh-te-dinh-vu-cat-hai.htmKBC,2014-10-28,signing_ceremony,lease_contract,C.P. Vietnam Livestock JSC,food/feed processing,10,,Tân Phú Trung,Hồ Chí Minh City,,0,https://kinhbaccity.vn/en/483-xay-dung-nha-may-300-trieu-usd-tai-kcn-tan-phu-trung.htmKBC,2014-12-18,signing_ceremony,mou,LG Electronics,consumer electronics,26,40,Tràng Duệ,Hải Phòng,26,0,https://kinhbaccity.vn/en/494-lg-electronics-leases-more-land-in-trang-due-ip.htmKBC,2015-03-06,signing_ceremony,mou,Haengsung Electronics,PCB assembly (electronic components),26,10,Tràng Duệ,Hải Phòng,26,0,https://kinhbaccity.vn/en/512-kbc-tinh-hinh-thu-fdi-hai-thang-dau-nam-2015.htmKBC,2015-09-03,signing_ceremony,mou,Hee-Sung Electronics,LED backlights/touch panels,26,13.86,Tràng Duệ,Hải Phòng,26,0,https://cafef.vn/tin-tuc-du-an/kbc-ky-hop-dong-cho-thue-dat-kcn-trang-due-tri-gia-khoang-250-ty-20150903105608869.chnKBC,2016-04-05,news,mou,LG Display,display panels,26,40.4,Tràng Duệ,Hải Phòng,26,0,https://cafef.vn/tin-tuc-du-an/lg-display-se-xay-dung-du-an-15-ty-usd-tai-kcn-trang-due-20160405215211015.chnKBC,2016-07-11,signing_ceremony,mou,JA Solar (JA Solar Hongkong Investment),solar cells,26,88,Quang Châu,Bắc Giang,26,0,https://kinhbaccity.vn/en/630-ja-solar-thue-88-ha-dat-tai-kcn-quang-chau-de-dau-tu-du-an-san-xuat-pin-nang-luong-mat-troi-cong-nghe-cao-voi-tong-von-hon-1-ty-usd-.htmKBC,2016-09-14,signing_ceremony,mou,Luxshare-ICT,electronics components,26,14,Quang Châu,Bắc Giang,26,0,https://kinhbaccity.vn/en/644-quang-chau-industrial-park-received-550-million-invested-capitals-from-hong-kong-investors.htmKBC,2017-01-10,signing_ceremony,mou,Hanwha Techwin,CCTV/security cameras,26,6,Quế Võ mở rộng,Bắc Ninh,26,0,https://kinhbaccity.vn/en/669-kbc-welcomes-the-first-high-tech-investor-to-que-vo-industrial-park-bac-ninh-province-in-2017.htmKBC,2017-03-02,press_release,lease_contract,Hanwha Techwin,CCTV/security cameras,26,6,Quế Võ mở rộng,Bắc Ninh,26,1,https://kinhbaccity.vn/en/683-hanwha-techwin-signed-the-official-contract-with-kbc-increasing-the-investment-capital-for-first-phase-up-to-usd-100-million.htmKBC,2017-11-01,signing_ceremony,lease_contract,LG Innotek,camera modules,26,7.2,Tràng Duệ,Hải Phòng,26,0,https://kinhbaccity.vn/en/734-lg-innotek-mo-rong-san-xuat-giai-doan-2-tiep-tuc-thue-them-dat-tai-kcn-trang-due.htmKBC,2018-03-29,signing_ceremony,mou,Samkwang Co. Ltd,mobile phone components,26,10,Quang Châu,Bắc Giang,26,0,https://kinhbaccity.vn/en/755-trien-vong-lon-cho-kbc-tu-viec-thu-hut-du-an-dau-tu-150-trieu-usd-cua-samkwang.htmKBC,2019-02-18,press_release,investment_certificate,Goertek (Hong Kong),acoustic/electronic devices,26,,Quế Võ,Bắc Ninh,26,0,https://kinhbaccity.vn/en/799-tin-hieu-kha-quan-trong-thu-hut-dau-tu-cua-kbc-tu-nhung-ngay-dau-nam-moi-2019.htmKBC,2019-05-27,signing_ceremony,investment_certificate,Billion Max Vietnam (Winson Group),plastic toys/baby products,32,,Sài Gòn - Chân Mây,Thừa Thiên Huế,,0,https://kinhbaccity.vn/831-du-an-nha-may-che-xuat-billion-max-viet-nam-trong-kcn-va-kptq-sai-gon-chan-may-duoc-trao-giay-chung-nhan-dang-ky-dau-tu.htmKBC,2021-01-18,news,investment_certificate,Foxconn Singapore (Fukang Technology),laptops/tablets assembly,26,,Quang Châu,Bắc Giang,26,0,https://english.vov.vn/en/economy/foxconn-pours-us270-million-into-bac-giang-project-831451.vovKBC,2022-03-03,press_release,investment_certificate,Goertek Vina,acoustic/electronic devices,26,,Quế Võ,Bắc Ninh,26,0,https://kinhbaccity.vn/en/1157-goertek-tiep-tuc-mo-rong-quy-mo-dien-tich-tang-von-dau-tu-du-an-tai-kcn-que-vo-len-gan-566-trieu-usd.htmKBC,2022-08-15,signing_ceremony,mou,Foxconn (Hon Hai),electronics assembly,26,50.5,Quang Châu,Bắc Giang,26,0,https://kinhbaccity.vn/en/1280-foxconn-signs-the-memorandum-of-understanding-mou-to-sublease-50-5-ha-in-quang-chau-industrial-park-bac-giang-province.htmKBC,2023-01-02,signing_ceremony,investment_certificate,Ingrasys (Singapore)/Fulian Co. (Foxconn),precision electronics,26,49.6,Quang Châu mở rộng,Bắc Giang,26,1,https://kinhbaccity.vn/en/1396-du-an-nha-may-cong-nghe-chinh-xac-fulian-dau-tu-tai-kcn-quang-chau-bac-giang-duoc-cap-giay-chung-nhan-dang-ky-dau-tu-vao-ngay-dau-nam-2023-eng.htmKBC,2023-02-14,exchange_filing,lease_contract,Fulian Precision Technology Component (Foxconn),precision electronics,26,45,Quang Châu,Bắc Giang,26,1,https://www.rfa.org/vietnamese/news/vietnamnews/foxconn-leases-new-site-in-vn-as-apple-contractor-continues-to-diversify-production-away-from-china-02162023071333.htmlKBC,2023-02-15,signing_ceremony,mou,Goertek,acoustic/electronic devices,26,62.7,Nam Sơn - Hạp Lĩnh,Bắc Ninh,,0,https://doanhnhan.baophapluat.vn/tap-doan-cong-nghe-noi-tieng-the-gioi-ky-bien-ban-ghi-nho-thue-627-ha-tai-khu-cong-nghiep-nam-son--hap-linh-cua-kbc-50106.htmlKBC,2024-06-17,news,investment_certificate,Foxconn Singapore (FCPV Foxconn Bac Ninh),printed circuit boards,26,14.26,Nam Sơn - Hạp Lĩnh,Bắc Ninh,26,0,https://en.vietstock.vn/2024/06/foxconn-to-pour-383-million-into-bac-ninh-factory-974-568100.htmKBC,2024-07-16,news,investment_certificate,Shunsin Technology (Foxconn),IC packaging,26,4.43,Quang Châu,Bắc Giang,26,0,https://en.baobacninhtv.vn/quang-chau-industrial-park-lures-additional-investment-of-80-million-usd-110543.bbgSIP,2024-07-15,signing_ceremony,investment_certificate,King King Group (Best Base),handicraft products,,10,Phước Đông,Tây Ninh,13,0,https://saigonvrg.com.vn/vi/tay-ninh-trao-giay-chung-nhan-dau-tu-cho-du-an-fdi-tai-kcn-phuoc-dongSIP,2024-07-22,signing_ceremony,investment_certificate,Jinhua Vietnam (Anhui Jinhua Zinc Oxide),zinc oxide,20,2.30,Phước Đông,Tây Ninh,13,0,https://saigonvrg.com.vn/vi/tay-ninh-cap-phep-dau-tu-du-an-fdi-22-trieu-usd-vao-kcn-phuoc-dongSIP,2024-10-30,signing_ceremony,lease_contract,Thantawan Industry (Vietnam),plastic packaging,22,,Phước Đông,Tây Ninh,13,0,https://saigonvrg.com.vn/vi/sai-gon-vrg-ky-ket-hop-tac-cung-cong-ty-thantawan-industrySIP,2025-03-07,signing_ceremony,investment_certificate,Global Hantex,knitted fabric/garment accessories,13,50,Phước Đông,Tây Ninh,13,0,https://baodautu.vn/tay-ninh-cap-phep-dau-tu-du-an-fdi-quy-mo-50-ha-tai-kcn-phuoc-dong-d251394.htmlSIP,2025-11-07,signing_ceremony,mou,Transimex Port (Transimex group),port/logistics,52,,Lộc An - Bình Sơn,Đồng Nai,,0,https://saigonvrg.com.vn/vi/le-ky-ket-bien-ban-ghi-nho-thue-lai-quyen-su-dung-dat-tai-khu-cong-nghiep-loc-an-binh-son-giua-cong-ty-co-phan-cang-transimex-va-cong-ty-co-phan-dau-tu-va-phat-trien-vrg-long-thanhSZC,2018-05-22,press_release,lease_contract,SH Solar Farm Vina Co. Ltd,solar power generation,35,60,Châu Đức,Bà Rịa-Vũng Tàu,15,0,https://sonadezichauduc.com.vn/vn/kcn-do-thi-va-san-golf-chau-duc-don-du-an-dien-nang-luong-mat-troi.htmlSZC,2024-05-13,signing_ceremony,lease_contract,Electronic Tripod Vietnam (Chau Duc) Co. Ltd (Tripod Technology),printed circuit boards,26,18,Châu Đức,Bà Rịa-Vũng Tàu,15,0,https://sonadezichauduc.com.vn/vn/tripod-dau-tu-nha-may-250-trieu-usd-tai-kcn-chau-duc.htmlSZC,2024-11-12,news,investment_certificate,Ton Vina One (coated steel sheet plant),coated steel sheet,24,12,Châu Đức,Bà Rịa-Vũng Tàu,15,0,https://nguoiquansat.vn/cac-mo-vang-tai-vung-tau-don-hon-2-900-ty-dong-chi-trong-mot-thang-176822.htmlVGC,2012-12-19,signing_ceremony,lease_contract,Curious Seiki Vietnam,auto parts,29,1.1961,Tiên Sơn,Bắc Ninh,26,0,https://viglacera.com.vn/blog/curious-seiki-nhat-ban-trien-khai-dau-tu-tai-khu-cong-nghiep-tien-son-viglaceraVGC,2013-07-09,signing_ceremony,mou,Yazaki Hai Phong Vietnam,auto wiring harnesses,29,7,Đông Mai,Quảng Ninh,,0,https://viglacera.com.vn/blog/tap-doan-yazaki-nhat-ban-dau-tu-tai-kcn-dong-mai-viglaceraVGC,2014-07-02,signing_ceremony,investment_certificate,Samsung Display Vietnam,display panels,26,,Yên Phong I,Bắc Ninh,26,0,https://viglacera.com.vn/en/blog/bac-ninh-awards-a-one-billion-usd-investment-certificate-to-sam-sung-display-project-implemented-in-yen-phong-industrial-zoneVGC,2015-07-16,signing_ceremony,lease_contract,Ottogi Vietnam,food and beverages,10,6.6,Yên Phong I,Bắc Ninh,26,0,https://viglacera.com.vn/en/blog/one-more-high-reputation-korean-enterprises-invests-in-viglacera-yen-phong-idustrial-zoneVGC,2015-08-06,signing_ceremony,investment_certificate,Samsung Display Vietnam (USD 3bn expansion),display panels,26,,Yên Phong I,Bắc Ninh,26,0,https://viglacera.com.vn/blog/samsung-display-tiep-tuc-dau-tu-them-3-ty-usd-vao-kcn-yen-phong-viglaceraVGC,2016-07-06,signing_ceremony,lease_contract,Sakai Amiori,textiles (knitting),13,,Phú Hà,Phú Thọ,14,0,https://viglacera.com.vn/en/blog/phu-ha-industrial-park-a-new-attractive-destination-for-japanese-enterprisesVGC,2016-07-12,signing_ceremony,investment_certificate,Vietnam Vega Balls (Yuan Chi Group),sports balls,32,3.24,Đông Mai,Quảng Ninh,29,0,https://viglacera.com.vn/en/blog/issuance-of-investment-certificate-for-taiwanese-enterprise-in-dong-mai-industrial-parkVGC,2016-11-11,signing_ceremony,lease_contract,NT Vina,phone components (vibration motors/camera),26,3,Phú Hà,Phú Thọ,14,0,https://viglacera.com.vn/en/blog/phu-ha-industrial-zone-successfully-attracts-korean-electronics-enterpriseVGC,2017-02-20,press_release,lease_contract,Davo C&M,electronic components (Samsung vendor),26,2,Phú Hà,Phú Thọ,26,0,https://viglacera.com.vn/blog/khu-cong-nghiep-phu-ha-viglacera-thu-hut-nhieu-doanh-nghiep-ve-tinh-cho-samsungVGC,2017-02-24,signing_ceremony,investment_certificate,Samsung Display Vietnam (USD 2.5bn expansion),display panels,26,,Yên Phong I,Bắc Ninh,26,0,https://viglacera.com.vn/en/blog/more-than-25-billion-usd-was-invested-in-yen-phong-viglacera-industrial-park-from-samsungVGC,2017-04-14,signing_ceremony,lease_contract,Haehwa,phone camera modules,26,1.7,Phú Hà,Phú Thọ,26,0,https://viglacera.com.vn/blog/cac-cong-ty-ve-tinh-cua-samsung-lien-tiep-dau-tu-vao-khu-cong-nghiep-phu-haVGC,2017-04-14,signing_ceremony,lease_contract,Woojin Global Logistics (Logisvalley Vina),logistics/warehousing,52,6,Yên Phong mở rộng,Bắc Ninh,26,0,https://viglacera.com.vn/blog/cac-doanh-nghiep-lon-han-quoc-tiep-tuc-dau-tu-vao-khu-cong-nghiep-yen-phong-mo-rongVGC,2017-08-30,press_release,lease_contract,Toyoda Gosei (Haiphong Thai Binh Plant),airbag parts/steering wheels,29,11.3,Tiền Hải,Thái Bình,,0,https://www.toyoda-gosei.com/news/details.php?id=159VGC,2017-11-14,press_release,lease_contract,Anam Electronics Vietnam,audio electronics,26,10,Đồng Văn IV,Hà Nam,26,0,https://viglacera.com.vn/en/blog/dong-van-iv-industrial-park-viglacera-has-successfully-attracted-large-korean-electronics-manufacturersVGC,2018-07-19,press_release,lease_contract,Moda Innochips,circuit boards/phone parts,26,5.1,Phú Hà,Phú Thọ,26,0,https://viglacera.com.vn/en/blog/viglacera-phu-ha-industrial-park-attracts-many-high-technology-enterprisesVGC,2018-09-05,signing_ceremony,lease_contract,Asentec,auto parts (wheel-speed sensors/cables),29,3.2,Phú Hà,Phú Thọ,26,0,https://viglacera.com.vn/blog/khu-cong-nghiep-phu-ha-viglacera-thu-hut-them-doanh-nghiep-san-xuat-phu-tung-o-to-tu-han-quocVGC,2018-10-23,signing_ceremony,lease_contract,ActRo Vina,phone camera components,26,2,Phú Hà,Phú Thọ,26,0,https://viglacera.com.vn/en/blog/korean-enterprises-continue-to-invest-in-phu-ha-industrial-park-viglaceraVGC,2019-08-21,press_release,lease_contract,Qisda Corporation,monitors/projectors,26,,Đồng Văn IV,Hà Nam,26,0,https://viglacera.com.vn/en/blog/a-taiwanese-enterprise-invested-nearly-400-million-usd-in-dong-van-4-industrial-park-viglaceraVGC,2019-08-27,press_release,lease_contract,Foxconn Singapore (Hon Hai),TV screen component assembly,26,10,Đông Mai,Quảng Ninh,29,0,https://viglacera.com.vn/en/blog/dong-mai-industrial-park-viglacera-successfully-attracted-one-of-the-leading-electronics-and-information-technology-corporations-in-the-worldVGC,2019-09-26,signing_ceremony,investment_certificate,Kanglongda,disposable gloves/PE fibre,22,35,Phong Điền,Thừa Thiên Huế,,0,https://viglacera.com.vn/en/blog/thua-thien-hue-province-awarded-investment-registration-certificate-for-a-200-million-usd-project-in-phong-dien-industrial-park-viglaceraVGC,2020-05-04,press_release,mou,Hyosung TNS,ATMs/financial equipment,28,,Yên Phong II-C,Bắc Ninh,,0,https://viglacera.com.vn/en/blog/viglaceras-industrial-parks-grow-stably-in-the-first-quarter-of-2020VGC,2020-05-28,signing_ceremony,lease_contract,INOUE Rubber Vietnam (IRC Tire),motorcycle/bicycle tyres,22,12,Phú Hà,Phú Thọ,26,0,https://viglacera.com.vn/en/blog/japanese-enterprises-continue-to-choose-phu-ha-industrial-park-viglaceraVGC,2021-11-04,signing_ceremony,mou,Amkor Technology,semiconductor packaging/test,26,23,Yên Phong II-C,Bắc Ninh,28,0,https://bacninh.gov.vn/web/english/59/-/details/4790216/bac-ninh-amkor-sign-agreement-to-develop-semiconductor-factory-in-yen-phongVGC,2022-01-20,signing_ceremony,lease_contract,Amkor Technology,semiconductor packaging/test,26,23,Yên Phong II-C,Bắc Ninh,28,1,https://viglacera.com.vn/blog/khu-cong-nghiep-yen-phong-2c-thu-hut-thanh-cong-tap-doan-san-xuat-vat-lieu-ban-dan-hang-dau-the-gioiVGC,2024-05-13,signing_ceremony,lease_contract,AAC Technologies,acoustic/optical components,26,,Yên Phong II-C,Bắc Ninh,26,0,https://viglacera.com.vn/blog/viglacera-ky-ket-hop-dong-voi-doanh-nghiep-trung-quoc-tai-thuong-hai-trung-quocVGC,2024-05-13,signing_ceremony,lease_contract,Cayi Technology Vietnam,vacuum flasks,25,7,Yên Phong II-C,Bắc Ninh,26,0,https://viglacera.com.vn/blog/viglacera-ky-ket-hop-dong-voi-doanh-nghiep-trung-quoc-tai-thuong-hai-trung-quocVGC,2024-05-13,signing_ceremony,lease_contract,Micro Commercial Components Vietnam (Yangjie),semiconductor devices,26,8,Yên Phong II-C,Bắc Ninh,26,0,https://viglacera.com.vn/blog/viglacera-ky-ket-hop-dong-voi-doanh-nghiep-trung-quoc-tai-thuong-hai-trung-quocVGC,2024-09-22,signing_ceremony,mou,Johnson Health Tech,fitness equipment,32,,Thuận Thành (Eco-Smart),Bắc Ninh,,0,https://vneconomy.vn/bac-ninh-trao-quyet-dinh-chu-truong-dau-tu-va-chung-nhan-dau-tu-voi-so-von-gan-5-6-ty-usd.htm"""), parse_dates=["announce_date"], dtype={"vsic2": "Int64", "anchor_vsic2": "Int64"})# MATCH = 1 when the tenant's VSIC division equals that of the park's anchor# before the deal; missing when either code is unknownip_events["match"] = (ip_events["vsic2"] == ip_events["anchor_vsic2"]).astype("Int64")print(f"{len(ip_events)} deals by {ip_events['ticker'].nunique()} developers, "f"{ip_events['announce_date'].min():%Y}-{ip_events['announce_date'].max():%Y}; "f"{int(ip_events['followup'].sum())} are later stages of an earlier deal")``````{python}#| label: tbl-ipa-events#| tbl-cap: "Lease announcements by developer, excluding follow-ups. Events count distinct announcement days. A deal is matched when the tenant's VSIC division equals that of the park's anchor before the deal. The electronics share is the share of stated hectares leased to VSIC 26--27 tenants."new = ip_events[ip_events["followup"] ==0].copy()new["ha"] = new["hectares"].fillna(0)new["elec_ha"] = new["ha"] * new["vsic2"].isin([26, 27])summary = new.groupby("ticker").agg( deals=("tenant", "size"), events=("announce_date", "nunique"), matched=("match", lambda m: int((m ==1).sum())), unmatched=("match", lambda m: int((m ==0).sum())), unknown=("match", lambda m: int(m.isna().sum())), hectares=("ha", "sum"), elec_ha=("elec_ha", "sum"),)summary["electronics_share"] = (summary.pop("elec_ha") / summary["hectares"]).round(2)summary.loc["Total"] = summary.sum()summary.loc["Total", "electronics_share"] =round( new["elec_ha"].sum() / new["ha"].sum(), 2)summary.astype({c: intfor c in ["deals", "events", "matched", "unmatched","unknown"]}).round({"hectares": 1})``````{python}#| label: fig-ipa-timeline#| fig-cap: "Lease announcements by developer, excluding follow-ups. Marker size is the stated area (deals without one are drawn at 5 hectares)."#| fig-alt: "Dot plot with one row per developer and announcement dates from 2012 to 2025 on the horizontal axis. KBC's dots, from 2013 to 2024, are almost all green (matched). IDICO's dots, from 2022 to 2025, are all red (not matched). Viglacera's row from 2012 to 2024 mixes green and red dots. SIP, SZC and BCM have a few dots each, mostly red or grey, with one large green dot for SIP in 2025."from plotnine import (ggplot, aes, geom_point, labs, theme_minimal, theme, scale_color_manual, scale_size_continuous, scale_x_datetime)timeline = new.assign( status=new["match"].map({1: "Matched", 0: "Not matched"}).fillna("Unknown"), size_ha=new["hectares"].fillna(5))(ggplot(timeline, aes("announce_date", "ticker", color="status", size="size_ha"))+ geom_point(alpha=0.7)+ scale_color_manual(values={"Matched": "#1b7837", "Not matched": "#b2182b","Unknown": "#999999"})+ scale_size_continuous(range=(1.5, 7), breaks=[10, 25, 50, 80])+ scale_x_datetime(date_labels="%Y", date_breaks="2 years")+ labs(x="Announcement date", y="", color="Tenant", size="Hectares")+ theme_minimal()+ theme(figure_size=(9, 3.6)))```@tbl-ipa-events and @fig-ipa-timeline show the feature of the data that shapes everything that follows: **whether a deal is matched is almost a property of the developer.** All of KBC's coded deals are matched. Its parks in Bắc Ninh, Bắc Giang, and Hải Phòng were built around electronics (LG, Goertek, Luxshare, Foxconn), and it kept signing electronics tenants. None of IDICO's, Sonadezi Châu Đức's, or Becamex's coded deals are matched; their parks sign a mix of food, materials, and engineering tenants. Only Viglacera, and to a small degree SIP, signs both kinds.This matters for the test. A pooled comparison of matched and unmatched deals is mostly a comparison of KBC with IDICO, two developers that also differ in size, region, investor base, and the stage of their land banks. The within-developer comparison, the analog of the REIT fixed effects in @liu2026agglomeration, is cleaner but rests almost entirely on Viglacera's 22 coded deals. Both versions are reported in @sec-ipa-application, and @sec-ipa-power shows what this structure does to inference.Three limitations should be kept in mind.- **Coverage is uneven.** Developers publicize flagship deals, so the sample over-represents large, high-profile tenants. KBC's archive thins out in 2019--2021 and 2024--2025, and several developers have no verifiable events. Exchange filings and annual reports, which were not searched systematically, are the next sources to add.- **Some dates are publication dates.** For rows with `date_type` equal to `news` or `press_release`, the deal may have been known a few days earlier. The pre-event window in @sec-ipa-application checks for this.- **Not every event is tradable.** Events dated before a developer's shares began trading drop out of the event study automatically. Check each developer's listing history, as in the [survivorship chapter](15_missing_data_and_survivorship.qmd).## How Much Can These Announcements Detect? {#sec-ipa-power}Before running the event study, it helps to know what size of effect is plausible and what size the sample can detect.**A rough upper bound.** Take a 25-hectare lease at USD 130 per m² over the remaining term, about the average tier-1 asking rent in northern Vietnam in 2024. That is 250,000 m² and about USD 32 million of revenue. If half of it is profit, a fully unanticipated deal adds about USD 16 million of value, or 1.6% for a developer worth USD 1 billion. Most deals are partly anticipated, because developers guide investors on their pipelines and many announcements follow an earlier MOU. A direct effect of one to two percent is therefore an upper bound for a large deal. The agglomeration channel is different. If a matched anchor raises the expected rent on the *rest* of the park's unleased land, the value effect can exceed the deal itself. That is the effect the test is looking for.**Inference with few developers.** The collected sample has 48 events with a known match status, spread over six developers. Two features of such data make standard errors fragile. Events by the same developer share a common component, for instance how much of its pipeline the market already expects. And, as @tbl-ipa-events shows, most developers sign mostly one type of tenant, so MATCH barely varies within developer. The simulation below generates two-day CARs as$$\text{CAR}_e = \delta \cdot \text{MATCH}_e + u_{d(e)} + \varepsilon_e ,$$ {#eq-ipa-sim}with an event-level standard deviation of 4.5%, roughly that of a two-day return for a mid-cap developer, and a developer-level shock $u_d$ with a standard deviation of 2%. It compares three tests of $\delta = 0$: the classical OLS $t$-test, a cluster-robust $t$-test with $G-1$ degrees of freedom, and a wild cluster bootstrap with the null imposed and Webb's six-point weights, which is designed for few clusters. The three scenarios are the collected sample size with tenant types mixed within each developer, the same size with each developer signing mostly one type (as in the collected data), and a sample three times larger.```{python}#| label: ipa-infer#| code-summary: "Cluster-robust t-statistics and the wild cluster bootstrap"from scipy import statsdef cluster_t(X, Y, g, j=1):"""Cluster-robust (CR1) t-statistics of coefficient j, one per column of Y. X is (n, k) with the tested regressor in column j, Y is (n, B), and g holds cluster codes 0, ..., G-1. """ n, k = X.shape G = g.max() +1 XtX_inv = np.linalg.inv(X.T @ X) beta = XtX_inv @ X.T @ Y resid = Y - X @ beta S = np.zeros((G, k, Y.shape[1]))for c inrange(k): np.add.at(S[:, c, :], g, X[:, [c]] * resid) meat = np.einsum("gkb,glb->klb", S, S) scale = G / (G -1) * (n -1) / (n - k) var = scale * np.einsum("k,klb,l->b", XtX_inv[j], meat, XtX_inv[j])return beta[j] / np.sqrt(var)WEBB = np.array([-np.sqrt(1.5), -1, -np.sqrt(0.5), np.sqrt(0.5), 1, np.sqrt(1.5)])def wild_cluster_p(X, y, g, j=1, n_boot=999, rng=None):"""Wild cluster bootstrap-t p-value for H0: beta_j = 0, with the null imposed and Webb's six-point weights, which behave well with few clusters. Returns the p-value and the original cluster-robust t-statistic.""" rng = np.random.default_rng(rng) t0 = cluster_t(X, y[:, None], g, j)[0] Xr = np.delete(X, j, axis=1) fit_r = Xr @ np.linalg.lstsq(Xr, y, rcond=None)[0] w = rng.choice(WEBB, size=(g.max() +1, n_boot)) y_star = fit_r[:, None] + (y - fit_r)[:, None] * w[g] t_star = cluster_t(X, y_star, g, j)return np.mean(np.abs(t_star) >=abs(t0)), t0``````{python}#| label: ipa-sim#| code-summary: "Size and power of three tests of the matched-tenant premium"def simulate_match_tests(effect, n_events, n_dev, sd_dev, mix, sd_event=0.045, n_sims=1000, n_boot=199, seed=0):"""Rejection rates (two-sided, 5%) of three tests of the matched-tenant premium when announcements cluster within a few developers. CAR_e = effect * match_e + u_dev(e) + eps_e Each developer has its own share of matched deals, drawn from a Beta(mix, mix) distribution: a small `mix` makes most developers sign only one type of tenant. The developer shock u_d (say, how well its announcements are anticipated) does not average out across its events. """ rng = np.random.default_rng(seed) rej = np.zeros(3)for _ inrange(n_sims): dev = rng.integers(0, n_dev, n_events) match = (rng.random(n_events) < rng.beta(mix, mix, n_dev)[dev]).astype(float)if match.min() == match.max():continue car = (effect * match + rng.normal(0, sd_dev, n_dev)[dev]+ rng.normal(0, sd_event, n_events)) g = np.unique(dev, return_inverse=True)[1] G = g.max() +1 X = np.column_stack([np.ones(n_events), match]) fit = stats.linregress(match, car) p_wild, t_cl = wild_cluster_p(X, car, g, n_boot=n_boot, rng=rng) rej += [abs(fit.slope / fit.stderr) > stats.t.ppf(0.975, n_events -2),abs(t_cl) > stats.t.ppf(0.975, G -1), p_wild <0.05]return rej / n_simsscenarios = {"48 events, 6 developers, mixed tenants": (48, 6, 2.0),"48 events, 6 developers, one type each": (48, 6, 0.3),"150 events, 12 developers, mixed tenants": (150, 12, 2.0)}rows = []for name, (n_events, n_dev, mix) in scenarios.items():for effect in [0.0, 0.01, 0.02, 0.03, 0.04, 0.05]: r = simulate_match_tests(effect, n_events, n_dev, sd_dev=0.02, mix=mix) rows.append({"scenario": name, "effect": effect,"OLS t": r[0], "cluster t": r[1], "wild bootstrap": r[2]})power = pd.DataFrame(rows)print(power.set_index(["scenario", "effect"]).round(3).to_string())``````{python}#| label: fig-ipa-power#| fig-cap: "Rejection rates of three tests of the matched-tenant premium at the 5% level. At a true effect of zero the curves show the test's size; the dotted line marks 5%. Each scenario is 1,000 simulated samples."#| fig-alt: "Line chart in three panels, one per scenario, with the true effect from 0 to 5 percent on the horizontal axis and the rejection rate on the vertical axis. In each panel the three tests rise with the effect. In the panel where each developer signs one type of tenant, the OLS t-test rejects 12 percent of the time at zero effect and the cluster t-test 9 percent, while the wild bootstrap stays near 5 percent. With 48 events only the over-rejecting OLS t-test reaches 80 percent power, and only at a 5 percent effect; with 150 events the wild bootstrap reaches 80 percent at about 3 percent."from plotnine import (ggplot, aes, geom_line, geom_point, geom_hline, facet_wrap, labs, theme_minimal, theme, scale_x_continuous)plot_df = power.melt(id_vars=["scenario", "effect"], var_name="test", value_name="rejection_rate")plot_df["scenario"] = pd.Categorical(plot_df["scenario"], list(scenarios))(ggplot(plot_df, aes("effect * 100", "rejection_rate", color="test"))+ geom_hline(yintercept=0.05, linetype="dotted")+ geom_line() + geom_point(size=1.5)+ facet_wrap("~scenario", ncol=3)+ scale_x_continuous(breaks=[0, 1, 2, 3, 4, 5])+ labs(x="True matched-tenant premium (%)", y="Rejection rate", color="")+ theme_minimal()+ theme(figure_size=(9, 3.4), legend_position="bottom"))```Three lessons follow from @fig-ipa-power.- **When each developer signs one type of tenant, only the wild bootstrap holds its size.** The classical $t$-test rejects a true null 12% of the time, because it treats a developer's announcements as independent observations. The cluster-robust $t$-test does better but still rejects 9% of the time, because six clusters are too few for it. The wild bootstrap rejects at 5.5%.- **With 48 events, only very large effects are detectable.** At a true premium of 5 percentage points, the wild bootstrap rejects 70% of the time when tenant types are mixed and about half the time when they are not. A premium of the size @liu2026agglomeration report for US REITs (well under 1% per standard deviation) would be invisible.- **More events, from more developers, help most.** With 150 events from 12 developers, power reaches 80% at a premium of about 3 percentage points. Extending the hand collection, to exchange filings, to developers without events so far, and to smaller deals, is the most valuable next step.## Application to Vietnamese Data {#sec-ipa-application}The code below runs the two tests on DataCore prices with the pipeline from the [event-study chapter](60_event_studies.qmd): `EventStudyConfig`, `run_event_study`, and the functions it calls. It assumes `ip_events` from @sec-ipa-events and the inference functions above.- **Lease announcements.** Several deals signed at one ceremony are one event. Announcements by the same developer within ten days of each other are flagged, because their windows overlap. Abnormal returns come from the market model (VN-Index, estimation window of 150 days ending 15 days before the event). The test regresses CARs on MATCH with developer fixed effects, so the comparison is within developer: is the same developer's stock rewarded more for a matched tenant than for an unmatched one? Log hectares control for deal size. Inference uses the wild cluster bootstrap. A "clean" sample drops overlapping events and events with a price-limit hit on day 0 or +1 (@sec-price-limit-delayed explains why limit hits push price discovery into later days).- **The 2025 tariff shock.** On 3 April 2025 (Vietnam time) the United States announced a 46% tariff on Vietnamese goods. It paused the tariff on 9 April (10 April in Vietnam), and on 2 July (3 July in Vietnam) announced a deal at 20%, with 40% on transshipped goods. All developers share each date, so this is a cross-sectional test: regress each developer's CAR on its exposure, the share of its collected leased hectares that went to electronics tenants (VSIC 26--27). Concentration risk predicts a negative slope on the announcement and positive slopes on the pause and the deal. The first window runs to day +3, because many stocks closed at their floor price for several sessions after the announcement.```{python}#| label: ipa-application#| eval: false#| code-summary: "Lease announcements and the 2025 tariff shock on DataCore data"import statsmodels.formula.api as smffrom datacore import DataCoreClientclient = DataCoreClient()# All listed IP developers, including those without a collected event: the# tariff test uses the whole cross-sectiondevelopers =sorted(set(ip_events["ticker"]) | {"KBC", "IDC", "SZC", "BCM", "SIP","GVR", "PHR", "NTC", "D2D", "LHG","TIP", "VGC", "SNZ"})daily = client.get_daily_prices( exchanges=["HOSE", "HNX", "UPCoM"], start_date="2011-01-01", end_date="2025-12-31", include_delisted=True, fields=["ticker", "date", "exchange", "adjusted_close", "volume","market_cap", "limit_up_hit", "limit_down_hit"])daily["date"] = pd.to_datetime(daily["date"])daily = (daily[daily["ticker"].isin(developers)] .rename(columns={"ticker": "symbol"}) .sort_values(["symbol", "date"]).reset_index(drop=True))daily["ret"] = daily.groupby("symbol")["adjusted_close"].pct_change()vn = client.get_index_returns(index="VNINDEX", frequency="daily", start_date="2011-01-01", end_date="2025-12-31")vn["date"] = pd.to_datetime(vn["date"])# Market model on raw returns; the intercept absorbs the risk-free ratefactors = vn[["date"]].assign(mkt_excess=vn["return"])config = EventStudyConfig(estimation_window=150, gap=15, event_window_start=-5, event_window_end=5, min_estimation_obs=100, risk_model=RiskModel.MARKET_MODEL)windows = {"car_m5_m1": (-5, -1), "car_0_p1": (0, 1),"car_m1_p1": (-1, 1), "car_0_p5": (0, 5)}def event_cars(events):"""Run the chapter's pipeline and return one row per event with CARs over each window and a flag for price-limit hits on days 0 and +1.""" res = run_event_study(events, daily[["symbol", "date", "ret"]], factors, config, verbose=False) d = res["daily_ar"] cars = pd.concat( [d[d["evttime"].between(lo, hi)].groupby(["symbol", "evtdate"])["AR"] .sum().rename(name) for name, (lo, hi) in windows.items()], axis=1).reset_index() hits = (d[d["evttime"].between(0, 1)] .merge(daily[["symbol", "date", "limit_up_hit", "limit_down_hit"]], on=["symbol", "date"], how="left")) hits["hit"] = hits["limit_up_hit"].fillna(False) | hits["limit_down_hit"].fillna(False)return cars.merge(hits.groupby(["symbol", "evtdate"])["hit"].any() .rename("limit_hit").reset_index(), on=["symbol", "evtdate"])# --- 1. Lease announcements: matched versus other tenants -------------------# Later stages of a deal already announced are not news. Several deals signed# at one ceremony are one event for the developer's stockev = (ip_events[ip_events["followup"] ==0].dropna(subset=["match"]) .groupby(["ticker", "announce_date"]) .agg(match=("match", "max"), hectares=("hectares", lambda x: x.sum(min_count=1)), n_deals=("tenant", "size")) .reset_index() .rename(columns={"ticker": "symbol", "announce_date": "event_date"}))# Another announcement by the same developer within 10 days contaminates bothgap = ev.sort_values("event_date").groupby("symbol")["event_date"].diff().dt.daysgap_next = ev.sort_values("event_date").groupby("symbol")["event_date"].diff(-1).dt.days.abs()ev["overlap"] = (gap.le(10) | gap_next.le(10)).reindex(ev.index).fillna(False)cars = event_cars(ev[["symbol", "event_date"]])# The pipeline moves event dates to the next trading day; recover each# event's attributes from the latest original date on or before itcars = pd.merge_asof(cars.sort_values("evtdate"), ev.sort_values("event_date"), left_on="evtdate", right_on="event_date", by="symbol", direction="backward")cars["log_ha"] = np.log1p(cars["hectares"].fillna(cars["hectares"].median()))cars["year"] = cars["evtdate"].dt.yearprint(cars.groupby("match")[list(windows)].agg(["mean", "count"]).round(4))rows = []for sample, x in [("all", cars), ("clean", cars[~cars["overlap"] &~cars["limit_hit"]])]:for y in windows: sub = x.dropna(subset=[y]).reset_index(drop=True) g = sub["symbol"].astype("category").cat.codes.to_numpy()for spec in ["pooled", "within"]: X = pd.concat([pd.Series(1.0, index=sub.index, name="const"), sub["match"].astype(float), sub["log_ha"]], axis=1)if spec =="within":# Developer fixed effects: is the same developer's stock rewarded# more for a matched tenant than for an unmatched one? X = pd.concat([X, pd.get_dummies(sub["symbol"], drop_first=True, dtype=float)], axis=1) beta = np.linalg.lstsq(X.to_numpy(), sub[y].to_numpy(), rcond=None)[0] p_wild, t_cl = wild_cluster_p(X.to_numpy(), sub[y].to_numpy(), g, j=1, n_boot=1999, rng=1) rows.append({"sample": sample, "window": y, "spec": spec,"N": len(sub), "developers": g.max() +1,"match_premium": beta[1], "t_cluster": t_cl,"p_wild": p_wild})print(pd.DataFrame(rows).round(4).to_string(index=False))# --- 2. The 2025 US tariff shock: concentration risk --------------------------# Exposure: the share of each developer's leased hectares (deals announced# before the shock) that went to electronics tenants (VSIC 26-27), the sector# most exposed to US demandbase = ip_events[(ip_events["announce_date"] <"2025-04-01")& (ip_events["followup"] ==0)].dropna(subset=["hectares"])exposure = (base.assign(elec_ha=base["hectares"] * base["vsic2"].isin([26, 27])) .groupby("ticker")[["elec_ha", "hectares"]].sum() .eval("elec_ha / hectares").rename("exposure"))shocks = {"46% tariff announced": ("2025-04-03", (0, 3)),"90-day pause": ("2025-04-10", (0, 1)),"20% deal": ("2025-07-03", (0, 1))}for label, (day, (lo, hi)) in shocks.items(): windows["car_shock"] = (lo, hi) sh = event_cars(pd.DataFrame({"symbol": developers,"event_date": pd.Timestamp(day)})) sh = sh.merge(exposure, left_on="symbol", right_index=True, how="inner") fit = smf.ols("car_shock ~ exposure", data=sh).fit(cov_type="HC1")print(f"{label:22s} N={len(sh):2d} slope={fit.params['exposure']:.4f} "f"(HC1 t={fit.tvalues['exposure']:.2f}) "f"limit hits={int(sh['limit_hit'].sum())}")del windows["car_shock"]```We tested the code on synthetic prices shaped like the DataCore tables, using the actual dates of the collected events. Matched deals carried a planted day-0 abnormal return of 3% and other deals 0.5%, and the tariff dates carried planted effects of $-8\%$, $+4\%$, and $+3\%$ times exposure. With low idiosyncratic noise the code recovered all of them: a matched premium of 2.5 to 2.7 percentage points across windows and specifications, and exposure slopes of $-0.085$, $0.037$, and $0.031$. With realistic noise of 2.5% a day, the same planted premium was not significant in the within-developer specification (wild bootstrap $p$-values between 0.13 and 0.40 in the event windows), as @sec-ipa-power predicts for six developers. Only the six developers with collected deals have an exposure measure, so the tariff regressions have six observations. Read the output in this order:1. **The $(0,+1)$ match premium in the clean sample**, within developer, is the main estimate. Judge it by the wild bootstrap $p$-value, not by the cluster-robust $t$. If the pooled estimate is much larger than the within estimate, the pooled premium mostly reflects the difference between KBC and the other developers.2. **The pre-event window $(-5,-1)$** is a leakage check. A positive premium there means matched deals were known before the date used, so move the date earlier or widen the window.3. **The $(0,+5)$ window** shows whether price limits and thin trading delayed the reaction.4. **The tariff slopes** test concentration risk. With six developers, read their signs and the pattern across the three dates, not their individual significance.## Extensions {#sec-ipa-extensions}The event study tests whether investors *expect* clustering to pay. Testing whether it *does* pay, as @liu2026agglomeration do with prices and NOI, needs a park-level panel. Three extensions build it.**A park panel.** For each park and year, compute the investor HHI (@eq-ipa-hhi-tenant with leased hectares), the anchor's share of leased land, and SPEC (@eq-ipa-spec) with employment from the GSO Enterprise Survey, using the province or a radius of about 25 km around the park as the neighborhood. Then regress lease prices, occupancy, and hectares absorbed on these measures with year, developer, and province fixed effects, and run the paper's horse race between regional concentration and SPEC. Lease prices are reported mostly by brokers as asking rents by province and tier, so occupancy and absorption will often be the better-measured outcomes. Freeze locations on pre-2025 province codes: on 1 July 2025 Vietnam merged its 63 provinces into 34 and abolished the district level.**Anchor arrivals.** The arrival of a large anchor is a staggered treatment. Comparing rents and absorption in parks, and in neighboring parks, before and after an anchor signs, against parks matched on province and age, estimates spillovers directly. This is the logic of @greenstone2010identifying, who compare counties that won a large plant with the runners-up, and the staggered timing calls for an estimator such as @callaway2021difference. The original paper, with its cross-section of transactions, could not run this test.**Which mechanism.** @liu2026agglomeration attribute their premium to knowledge spillovers, which are strongest within an industry. In Vietnam's parks, input sharing may matter more: suppliers locate next to the assembler they sell to. @ellison2010causes separate the channels by asking which industry pairs co-locate. Here the analog is to add a measure of how much of the anchor's inputs the region already produces, built from the GSO input-output table. A premium that loads on supplier links rather than on the same industry would point to input sharing.## Summary {#sec-ipa-summary}- @liu2026agglomeration find that office values rise with agglomeration only when a building's tenants and its neighborhood specialize in the same industry, and that REIT investors price this in. The horse race between concentration and matched specialization is what identifies the mechanism.- In Vietnam, industrial parks are the natural setting, and listed developers' lease announcements are the natural events. @sec-ipa-events presents 71 hand-collected announcements by six developers, with sources.- In these data, whether a deal is matched is almost a property of the developer: KBC signs electronics tenants into electronics parks, IDICO signs a mix. The within-developer test rests largely on Viglacera.- With six developers, only the wild cluster bootstrap gives reliable inference, and only large effects are detectable. Collecting more events matters more than refining the test.- The 2025 US tariff announcements give a rare outside shock to test the other side of the trade-off: the risk of a concentrated tenant base.