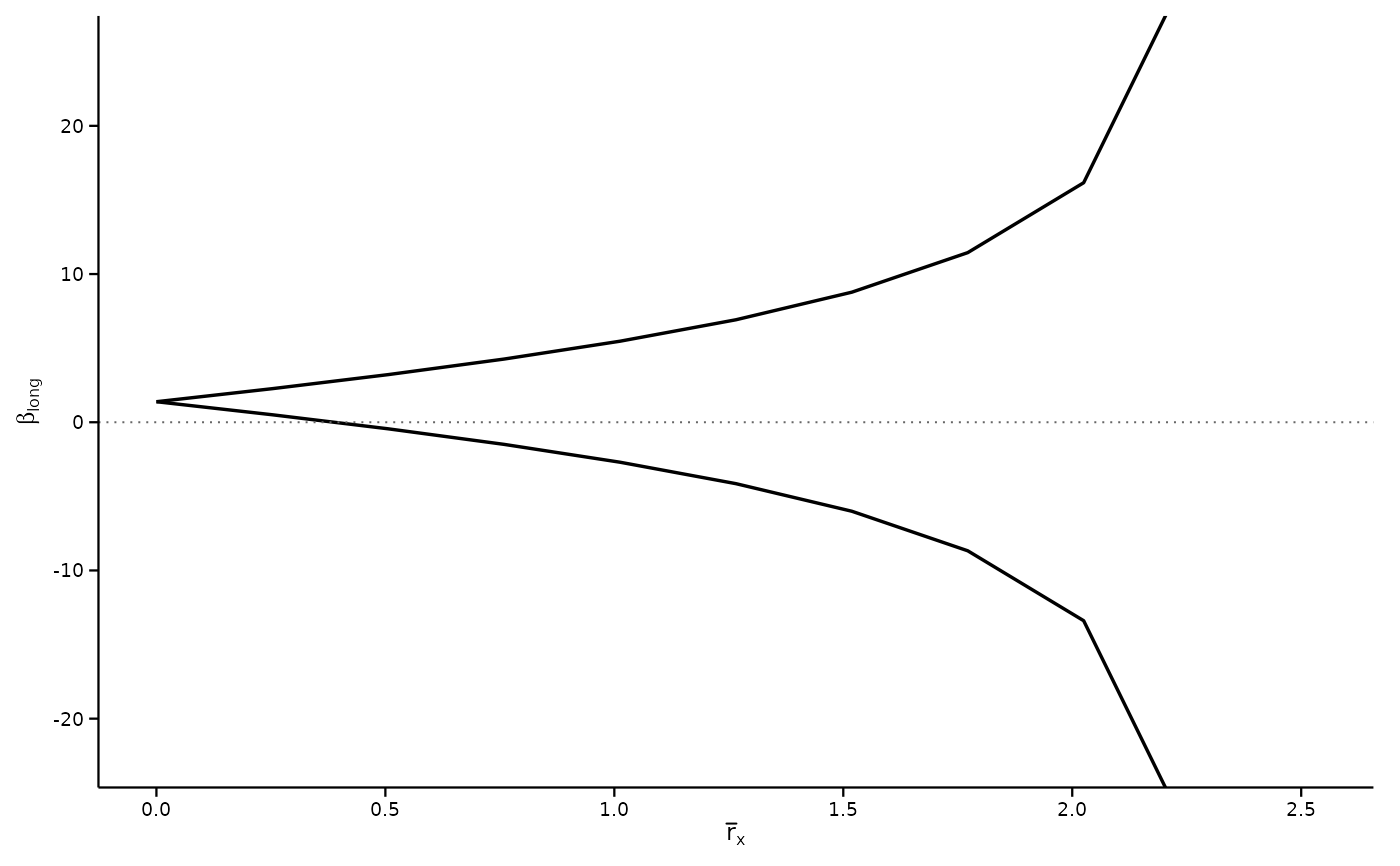
A ggplot2 theme tuned for figures that will be dropped into a paper. It follows the conventions of the economics journals: an L of axis lines rather than a box, no grid, ticks outside the panel, no figure title (the caption carries it), and a legend along the top so the plot region keeps its aspect ratio when the figure is scaled down to one column.
Usage
theme_regsen(
  base_size = 11,
  base_family = "",
  grid = c("none", "y", "x", "both"),
  legend_position = "top"
)
Arguments
- base_size
Base font size in points.
- base_family
Base font family. The empty string uses the device default, which keeps figures reproducible across machines.
- grid
One of
"none"(default),"y","x"or"both", choosing which faint grid lines to draw. The default is none, following the economics journals: a figure should carry ink only where it carries data. Use"y"when readers need to take values off the axis.- legend_position
Passed to
ggplot2::theme(). Defaults to"top".
Details
To match a LaTeX manuscript's body type, pass a serif family, e.g.
theme_regsen(base_family = "Times New Roman"). Fonts are left to the
caller because what is installed varies by machine, and a missing family
would make figures unreproducible.
The default base_size of 11 assumes a figure rendered at roughly
6 inches wide. For a two-column journal figure, render at 3.3 inches and
pass base_size = 9; the type will then sit at about 8pt on the page.
Examples
data(bfg2020)
res <- regsen_bounds(
    avgrep2000to2016 ~ tye_tfe890_500kNI_100_l6 + log_area_2010 + lat + lon,
    data = bfg2020, compare = c("log_area_2010", "lat", "lon"), cbar = 0.1
)
plot(res) + theme_regsen(base_size = 9)