Binned Scatter Plot for RD Analysis
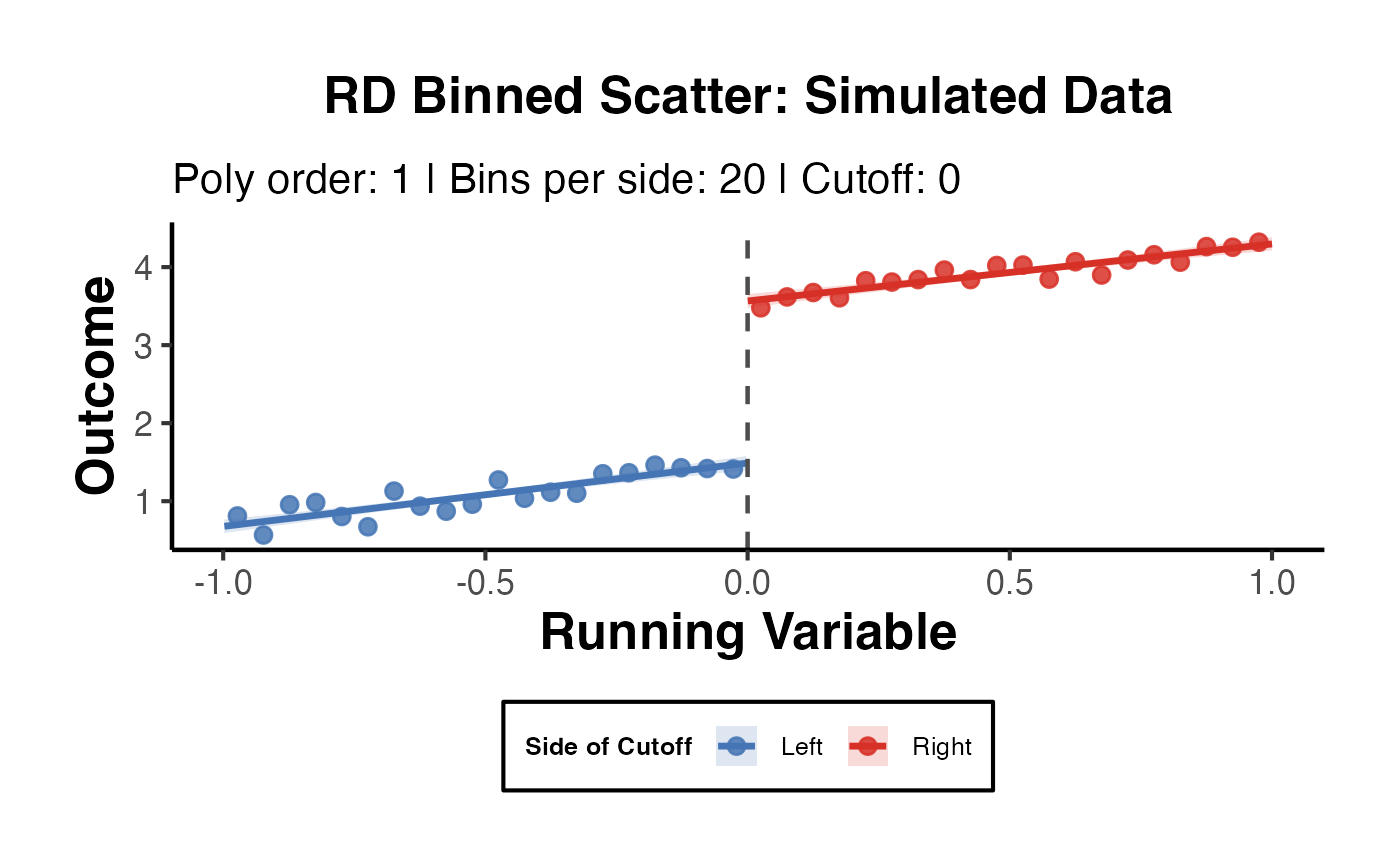
rd_binscatter.RdProduces a publication-ready RD plot that clearly visualises the discontinuity at the cutoff by displaying bin means and a polynomial fit on each side, with an optional confidence ribbon.
Usage
rd_binscatter(
  y,
  x,
  cutoff = 0,
  nbins = 20,
  poly_order = 1,
  show_ci = TRUE,
  xlab = "Running Variable",
  ylab = "Outcome",
  title = NULL
)
Arguments
- y
Numeric vector. Outcome variable.
- x
Numeric vector. Running variable (same length as
y).- cutoff
Numeric. The RD cutoff value. Default
0.- nbins
Integer. Number of bins on each side of the cutoff. Default
20.- poly_order
Integer. Degree of the polynomial fit (1 = linear, 2 = quadratic). Default
1.- show_ci
Logical. Show 95% confidence ribbon around the polynomial fit. Default
TRUE.- xlab
Character. x-axis label. Default
"Running Variable".- ylab
Character. y-axis label. Default
"Outcome".- title
Character or
NULL. Plot title.
Details
Binned Scatter Plot for Regression Discontinuity Analysis
Creates a customisable binned scatter plot for regression discontinuity (RD) analysis. The running variable is split into equal-width bins on each side of the cutoff, bin means are computed, and a polynomial of chosen order is fitted separately on each side. Optional 95% confidence bands are shown. The cutoff is marked with a vertical line and a visible gap between the two sides. No dependency on rdrobust is required.