Randomization Inference and Placebo Tests for Treatment Effects
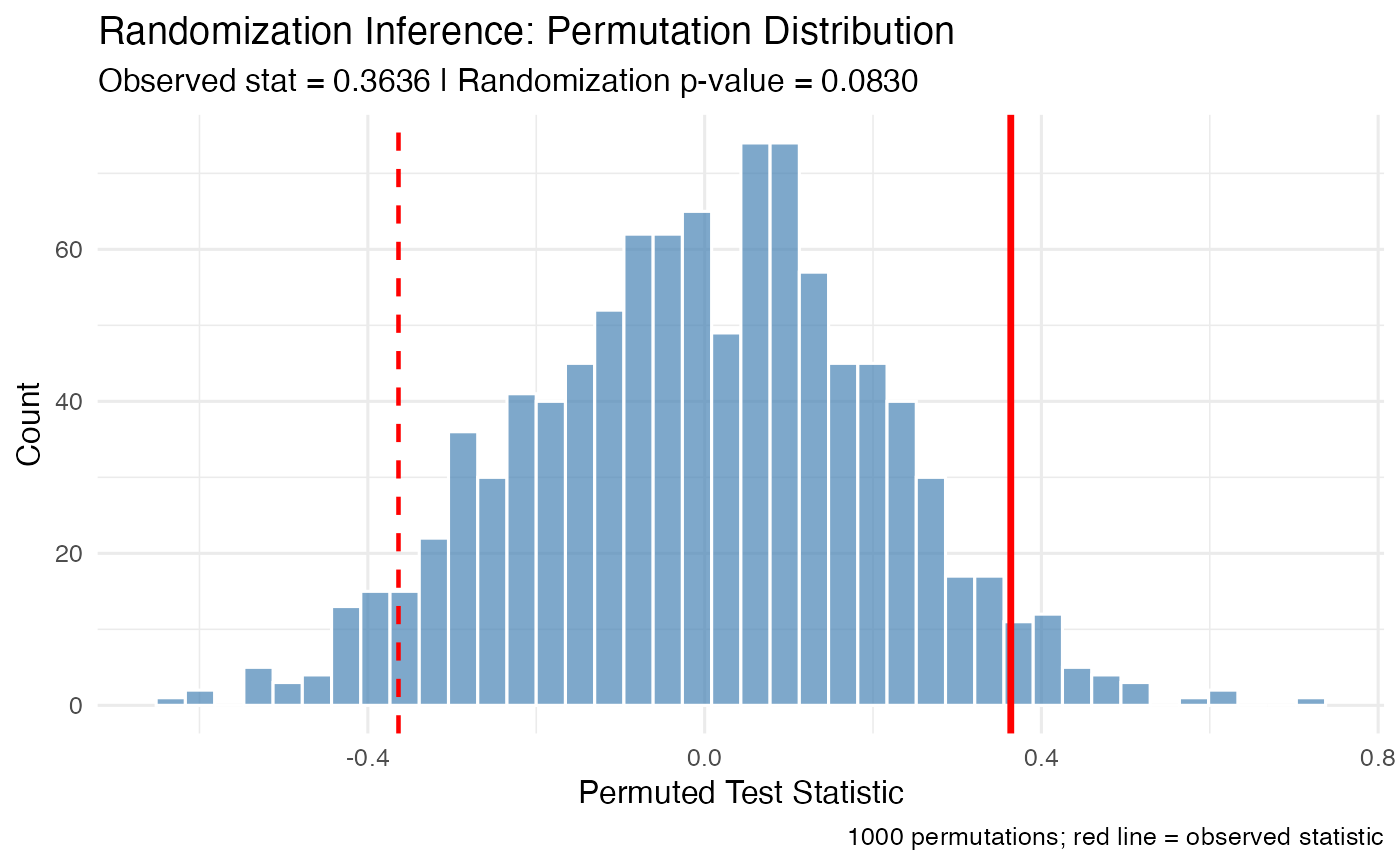
placebo_test.RdConducts Fisher's randomization inference (permutation test) for causal effects, computing sharp null p-values and visualizing the randomization distribution. Also supports in-time and in-space placebo tests.
Usage
placebo_test(
  data,
  outcome,
  treatment,
  estimator = "ate",
  unit_var = NULL,
  time_var = NULL,
  post_var = NULL,
  n_perms = 1000,
  test_stat = c("mean", "t"),
  two_sided = TRUE,
  seed = 42,
  plot = TRUE
)
Arguments
- data
A data frame.
- outcome
Character. Name of the outcome variable.
- treatment
Character. Name of the binary treatment indicator.
- estimator
Function or character. The estimator to use:
"ate"(default, difference in means),"did"(difference-in-differences requirestime_var), or a custom functionf(data, outcome, treatment, ...)returning a scalar.- unit_var
Character. Unit identifier (for panel/DiD). Default
NULL.- time_var
Character. Time period variable (for DiD). Default
NULL.- post_var
Character. Binary indicator for post-treatment period (for DiD). Default
NULL.- n_perms
Integer. Number of permutations. Default
1000.- test_stat
Character. Test statistic:
"mean"(difference in means) or"t"(t-statistic). Default"mean".- two_sided
Logical. Two-sided p-value. Default
TRUE.- seed
Integer. Random seed. Default
42.- plot
Logical. Whether to plot the permutation distribution. Default
TRUE.
Value
A list with:
- observed_stat
Numeric. Observed test statistic.
- p_value
Numeric. Randomization inference p-value.
- perm_dist
Numeric vector of permuted test statistics.
- plot
ggplot2 histogram of the permutation distribution.