Overlap Weights and Trimming for Propensity Score Analysis
overlap_weights.RdComputes overlap weights (also called average overlap weights, ATO weights) or trimmed inverse probability weights. Overlap weights target the population with the most covariate overlap and have the desirable property of minimizing the asymptotic variance among all balancing weights.
Usage
overlap_weights(
  data,
  treatment,
  covariates,
  ps_formula = NULL,
  weight_type = c("overlap", "ipw", "att", "trim"),
  trim_threshold = 0.1,
  normalize = TRUE,
  plot = TRUE
)
Arguments
- data
A data frame.
- treatment
Character. Name of the binary treatment indicator (0/1).
- covariates
Character vector. Covariates for the propensity score model.
- ps_formula
Formula or
NULL. Custom propensity score formula. IfNULL, uses a main-effects logistic regression oncovariates.- weight_type
Character. Type of weight:
"overlap"(default, ATO),"ipw"(ATE weights),"att"(ATT weights),"trim"(trimmed IPW).- trim_threshold
Numeric. Propensity scores below this or above
1 - trim_thresholdare trimmed (excluded). Only used whenweight_type = "trim". Default0.1.- normalize
Logical. Whether to normalize weights to sum to 1 within each treatment arm. Default
TRUE.- plot
Logical. If
TRUE, produce a propensity score overlap plot. DefaultTRUE.
Value
A list with:
- weights
Numeric vector of length
nrow(data).- ps
Numeric vector of propensity scores.
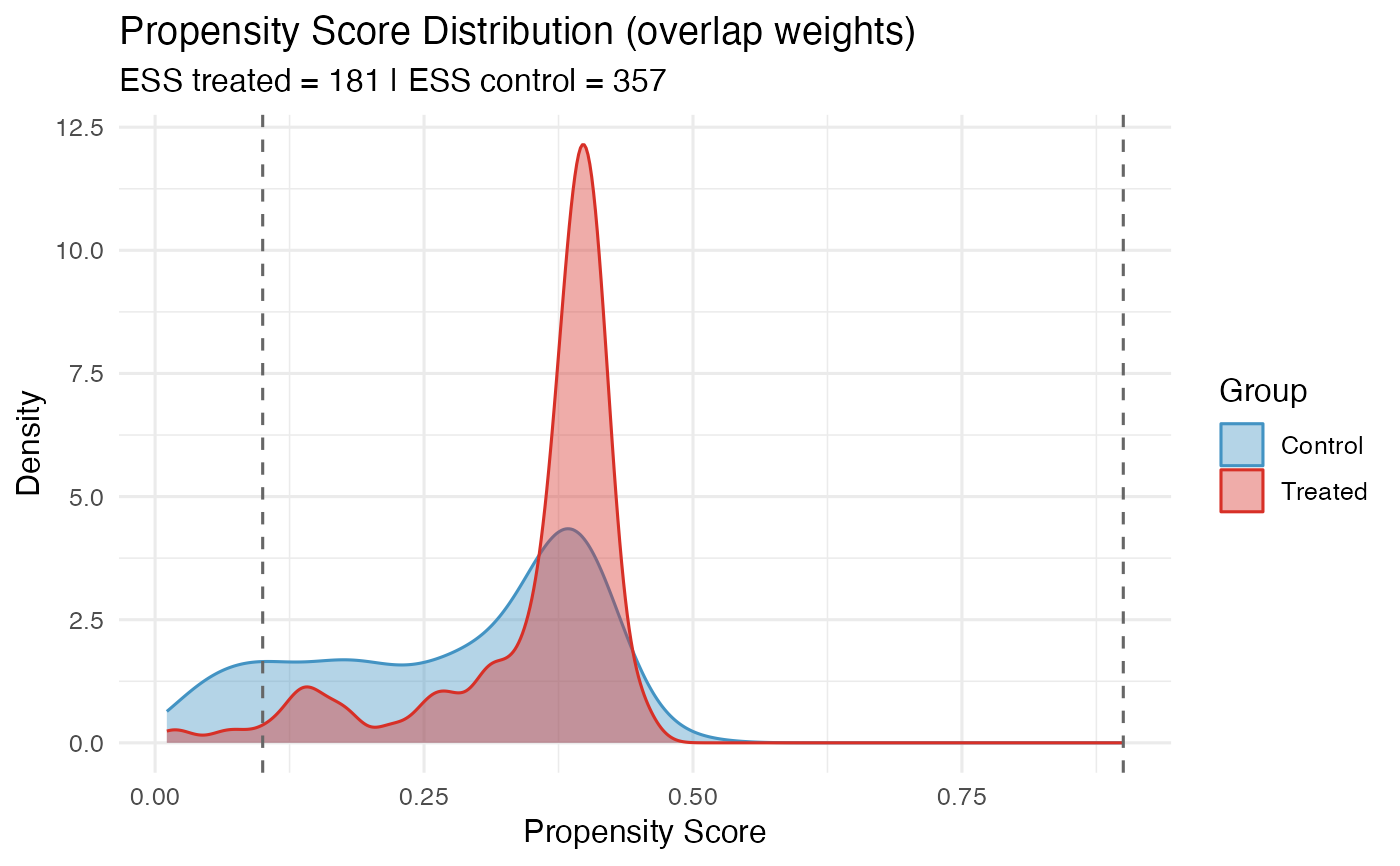
- ess_treated
Effective sample size in the treated arm.
- ess_control
Effective sample size in the control arm.
- n_trimmed
Number of trimmed observations (only for
"trim").- plot
ggplot2 overlap plot.
Details
Overlap weights for unit \(i\) are: $$w_i = D_i (1 - e_i) + (1 - D_i) e_i$$ where \(e_i = P(D=1|X_i)\). These automatically down-weight units near the boundaries of the propensity score distribution.
References
Li, F., Morgan, K. L., & Zaslavsky, A. M. (2018). Balancing covariates via propensity score weighting. Journal of the American Statistical Association, 113(521), 390–400.
Crump, R. K., Hotz, V. J., Imbens, G. W., & Mitnik, O. A. (2009). Dealing with limited overlap in estimation of average treatment effects. Biometrika, 96(1), 187–199.