Quick Causal DAG Visualization
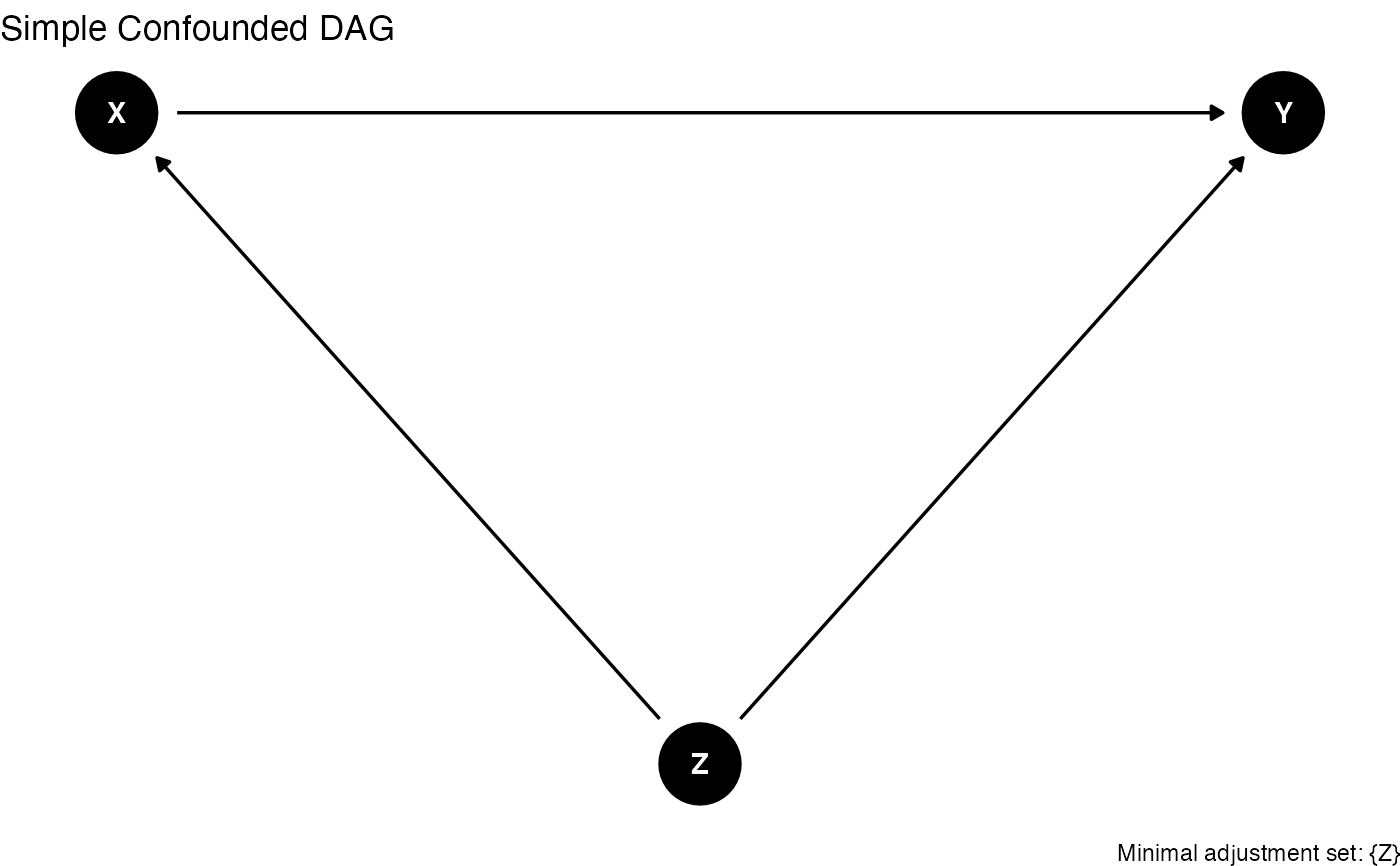
dag_plot.RdCreates a styled causal directed acyclic graph (DAG) for visualizing assumed causal structures. Wraps dagitty and ggdag (if available) to produce publication-ready DAG figures with highlighted backdoor paths, adjustment sets, and treatment/outcome nodes.
Usage
dag_plot(
  dag_string,
  exposure = NULL,
  outcome = NULL,
  layout = c("auto", "circle", "star", "tree"),
  show_adjustment_set = TRUE,
  show_paths = FALSE,
  title = NULL,
  node_size = 14
)
Arguments
- dag_string
Character. A
dagittyDAG specification string, e.g."dag{ X -> Y; Z -> X; Z -> Y }". Can also be adagittyobject.- exposure
Character. Name of the treatment/exposure node.
- outcome
Character. Name of the outcome node.
- layout
Character. Layout algorithm. One of
"circle","star","tree","auto". Default"auto".- show_adjustment_set
Logical. Highlight a minimal adjustment set. Default
TRUE.- show_paths
Logical. Annotate causal paths. Default
FALSE.- title
Character. Plot title. Default
NULL.- node_size
Numeric. Node size for ggdag. Default
14.
Value
A ggplot2 object. If neither dagitty nor ggdag is
installed, returns the raw dag_string invisibly with a message.