Universal Coefficient Plot
coef_plot.RdCreates a publication-ready coefficient (forest) plot from any model or
list of models. Supports lm, glm, fixest,
ivreg, and tidy data frames.
Arguments
- models
A model object, a named list of model objects, or a tidy data frame with columns
term,estimate,conf.low,conf.high(broom-style) orci_lower,ci_upper(causalverse-style).- terms
Character vector. Terms to include. If
NULL(default), all non-intercept terms are shown.- term_labels
Named character vector mapping original term names to display labels, e.g.
c(am = "Transmission (auto)").- model_labels
Character vector. Display names for each model, used in the legend. Defaults to list element names or
"Model".- sort_by
Character. Sort terms by
"estimate"(default),"name", or"none".- add_zero_line
Logical. Add a vertical reference line at zero. Default
TRUE.- color_by
Character. Color points by
"model"(default) or"significance"(significant at 5 percent in a different color).- conf_level
Numeric. Confidence level for intervals extracted from model objects. Default
0.95.- dodge_width
Numeric. Horizontal offset between multiple models. Default
0.4.- title
Character or
NULL. Plot title.- xlab
Character. X-axis label. Default
"Estimate (95 pct CI)".
Examples
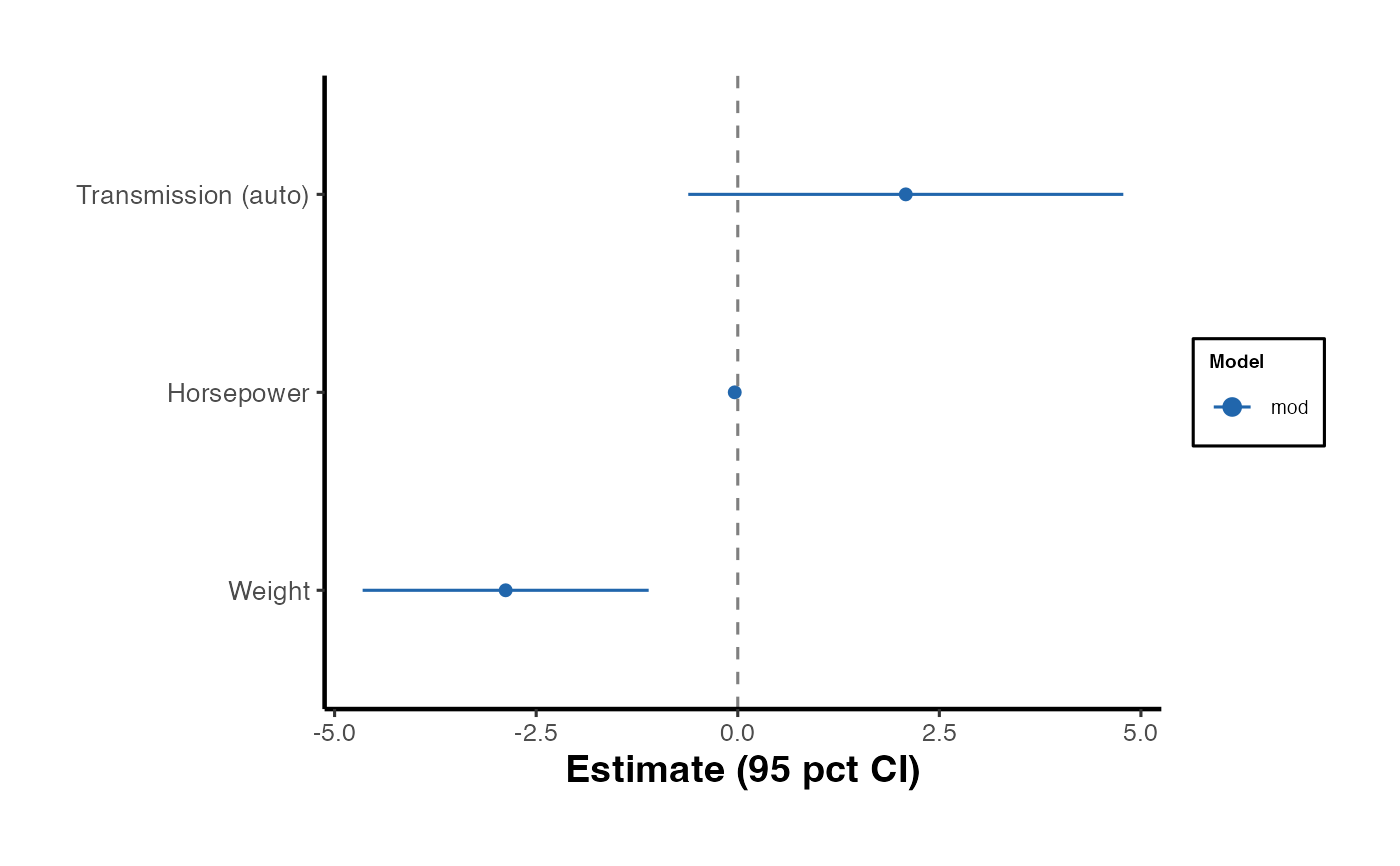
# Single lm model
mod <- lm(mpg ~ am + wt + hp, data = mtcars)
coef_plot(mod, terms = c("am", "wt", "hp"),
          term_labels = c(am = "Transmission (auto)",
                          wt = "Weight", hp = "Horsepower"))


if (FALSE) { # \dontrun{
# Multiple models
mod2 <- lm(mpg ~ am + wt + hp + disp, data = mtcars)
coef_plot(
  list(Parsimonious = mod, Full = mod2),
  terms = c("am", "wt", "hp"),
  color_by = "significance"
)
} # }
if (FALSE) { # \dontrun{
# Multiple models
mod2 <- lm(mpg ~ am + wt + hp + disp, data = mtcars)
coef_plot(
list(Parsimonious = mod, Full = mod2),
terms = c("am", "wt", "hp"),
color_by = "significance"
)
} # }