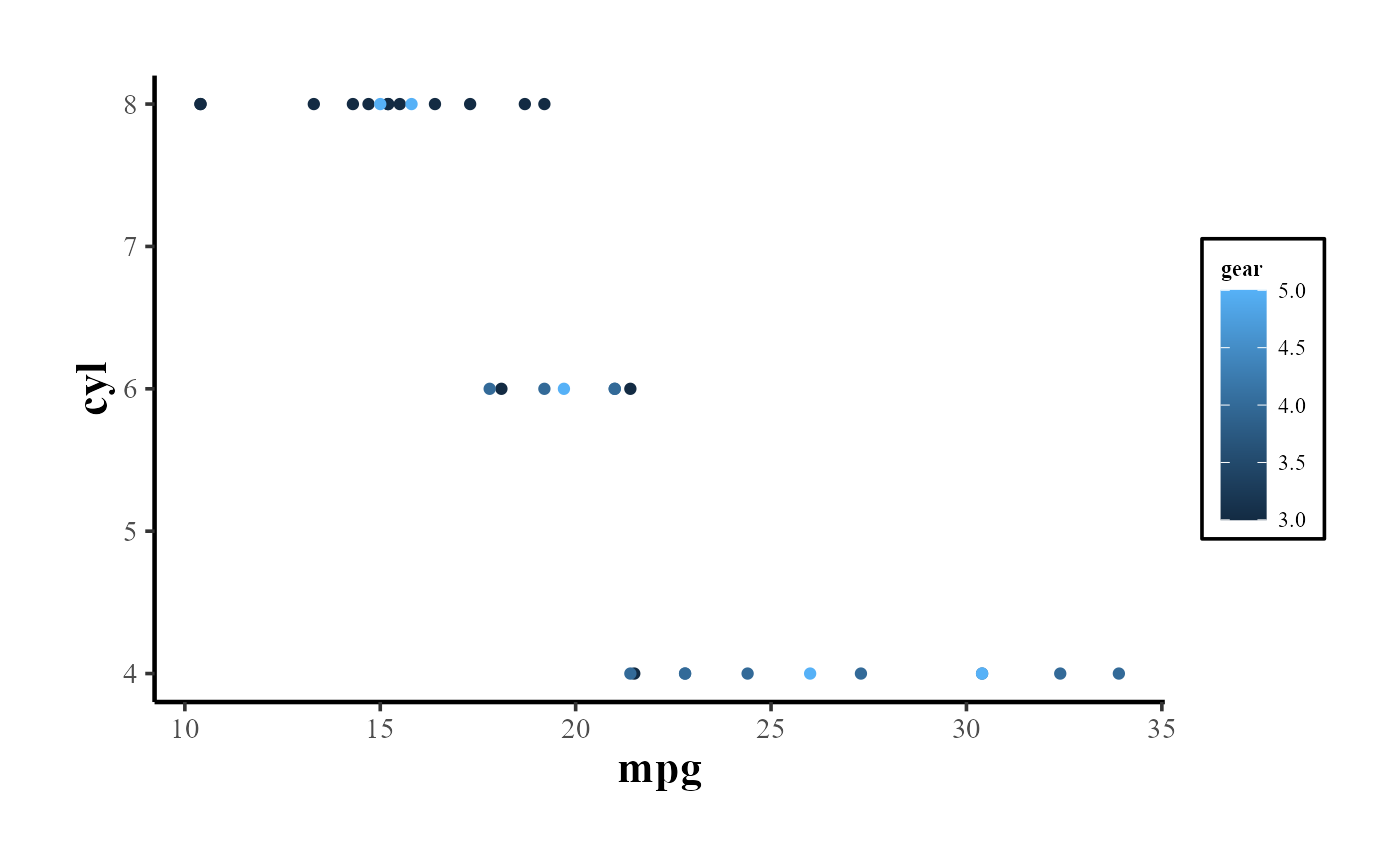
American-Marketing-Association-ready theme for plots
amatheme.RdCreate a custom ggplot2 theme that complies with the American Marketing Association style. This theme removes major and minor gridlines, panel borders, and adds black lines along the axes.
Arguments
- base_size
Base font size for the plot. Default is 14.
- title_size
Font size for the plot title. Relative to the base size. Default is 1.2 times the base size.
- axis_title_size
Font size for the axis titles. Relative to the base size. Default is 1.2 times the base size.
- legend_title_size
Font size for the legend title. Relative to the base size. Default is 0.6 times the base size.
- legend_text_size
Font size for the legend text. Relative to the base size. Default is 0.6 times the base size.
- axis_text_size
Font size for the axis text. Relative to the base size. Default is equal to the base size.
- ...
Additional theme elements to be passed to the
ggplot2::theme()function.
Value
A custom ggplot2 theme object.